#ZRX/USDT Bullish Impulse, New All-Time High Late 2025#ZRX
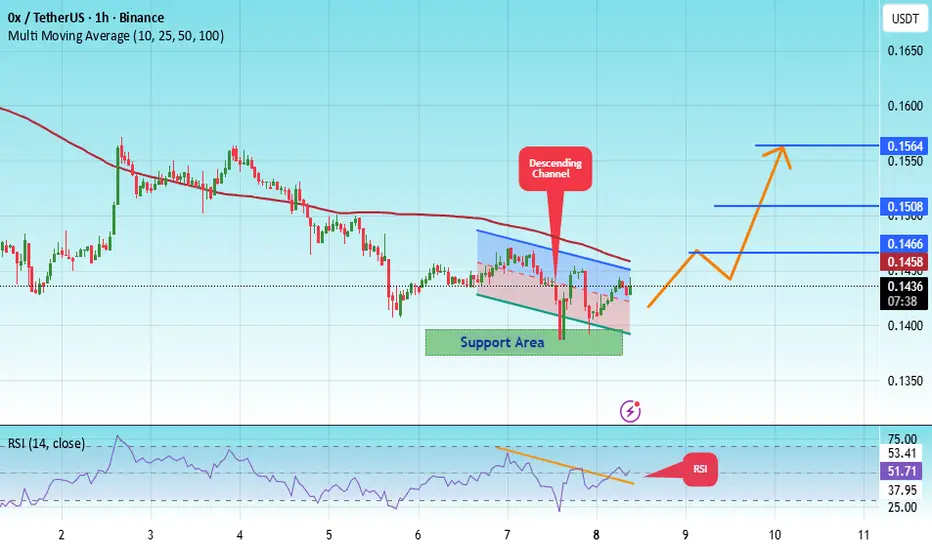
The price is moving in a descending channel on the 1-hour timeframe. It has reached the lower boundary and is heading towards breaking above it, with a retest of the upper boundary expected.
We have a downtrend on the RSI indicator, which has reached near the lower boundary, and an upward rebound is expected.
There is a key support zone in green at 0.1380. The price has bounced from this level multiple times and is expected to bounce again.
We have a trend towards consolidation above the 100-period moving average, as we are moving close to it, which supports the upward movement.
Entry price: 0.1436
First target: 0.1466
Second target: 0.1508
Third target: 0.1564
Don't forget a simple principle: money management.
Place your stop-loss order below the green support zone.
For any questions, please leave a comment.
Thank you.
Market insights
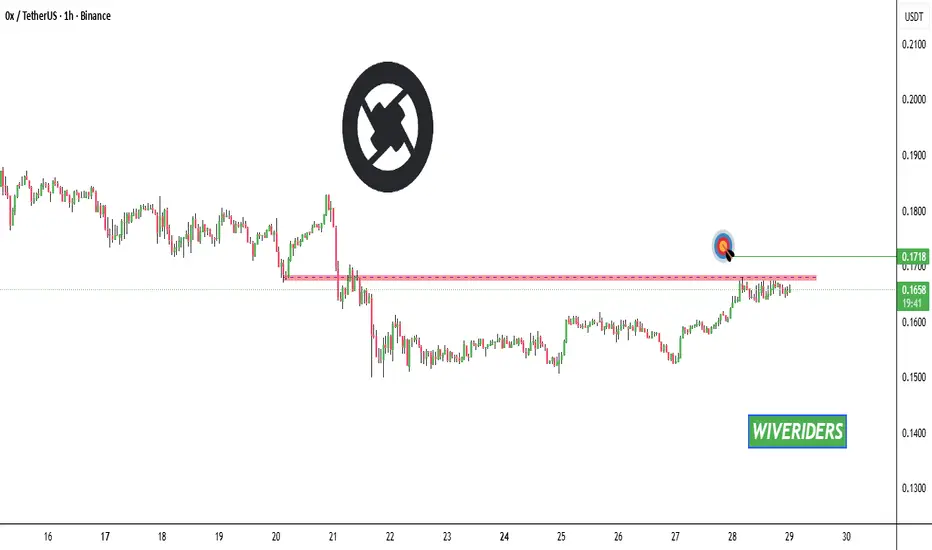
ZRX Update📊 ZRX Update
ZRX is testing the red resistance zone right right now 🔴.
If price manages to break out above this red level,
the first target will be the green line level 🟢 —
the next key zone on the chart.
Scalp LONG – ZRX🐂 Scalp LONG – ZRX
ZRX has broken its downtrend and is now pressing against the upper boundary of its accumulation range. A clean breakout from this box would open a strong path for price to retest the previous high. Momentum is stabilizing, and structure favors a bullish continuation if liquidity is cleared above the range.
Key Signals
Downtrend already broken → structure shifting bullish
Price compressing at the top of accumulation
Breakout = high probability move toward prior highs
🎯 TP: 0.1791
🛡️ SL: 0.1500
📊 RR: 1 : 2.38
A focused long setup, waiting for confirmation as ZRX escapes the range.


ZRXNEWCONNECT:ZRX is breaking out from the resistance line, confirming the bullish structure. From current levels, there’s a potential 600% gain to be made as momentum builds and volume starts to rise. The breakout looks clean and the trend is shifting in favor of the bulls.

#ZRX/USDT Bullish Impulse, New All-Time High Late 2025#ZRX
The price is moving in an ascending channel on the 1-hour frame, adhering well to it, and is heading for a strong breakout and retest.
We have a bearish trend on the RSI indicator that is about to be broken and retested, which supports the upward breakout.
There is a major support area in green at 0.1930, which represents a strong support point.
We are heading for stability above the 100 moving average.
Entry price: 0.1944.
First target: 0.1982.
Second target: 0.2000.
Third target: 0.2036.
Don't forget a simple matter: capital management.
When you reach the first target, save some money and then change your stop-loss order to an entry order.
For inquiries, please leave a comment.
Thank you.

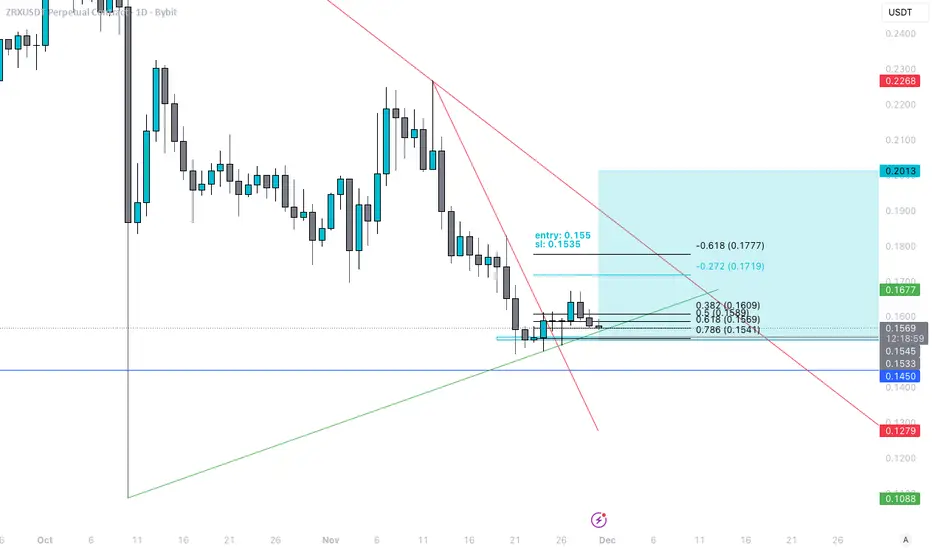
ZRXThe coin may have started moving upwards.
Gray line - entry point
Red line - mandatory stop loss
Green line - approximate take profit
Black text above the green line - current data at the time of publication (volume/date/intraday price movement)

ZRXUSDT 1D#ZRX is currently trading within a falling wedge pattern on the daily chart. For the bullish scenario to remain valid, the price must hold above the support zone. In case of a breakout above the wedge resistance and the daily SMA100, the potential upside targets are:
🎯 $0.2413
🎯 $0.2796
🎯 $0.3106
🎯 $0.3415
🎯 $0.3856
🎯 $0.4417
⚠️ Always remember to use a tight stop-loss and maintain proper risk management.

ZRXNEWCONNECT:ZRX is gearing up for a strong breakout setup, and I’m expecting a potential 600% move within the next 50 days once it breaks resistance. The structure is tightening, momentum is building, and volume confirmation could ignite a sharp rally soon.

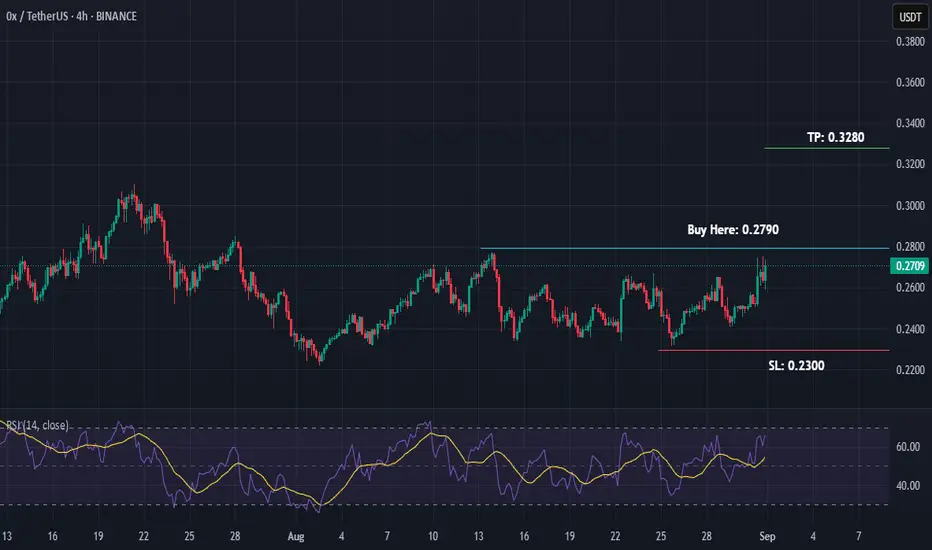
ZRX/USDT Buy-Stop on Range BreakoutZRX/USDT is in a range on 4H Timeframe.
We are taking a 1:1 trade from the breakout of this range.
Should be an easy one. Let's see how it goes.
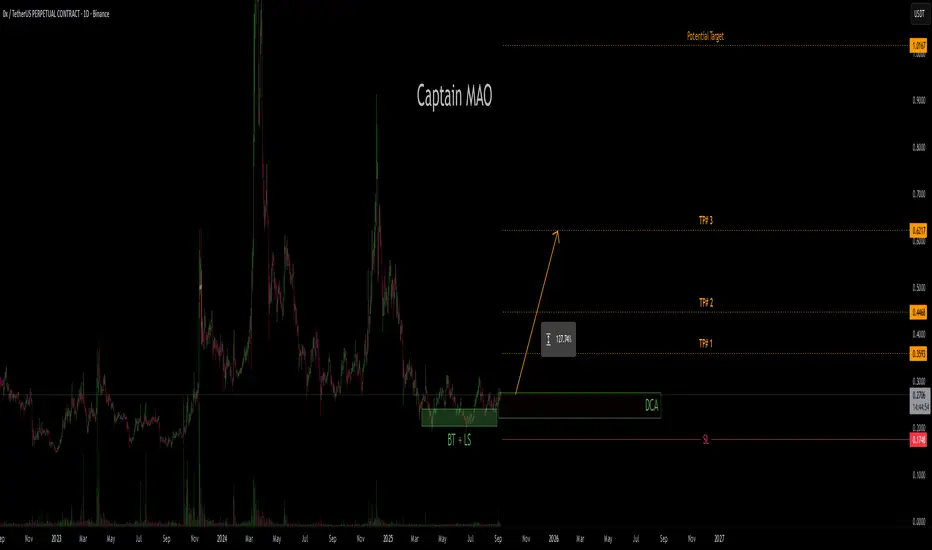
ZRX/USDT – Final Stage Before ReversalZRX/USDT appears to be entering the final stage before a major reversal. The recent move acted as a bear trap and liquidity sweep, effectively shaking out weak hands and resetting market sentiment.
Currently, price is consolidating within this zone, showing signs of accumulation as buyers gradually take control. If the structure holds, ZRX has strong potential to ignite its next bullish leg, with a target toward the $1.00 zone.
ZRXUSDT UPDATE#ZRX
UPDATE
ZRX Technical Setup
Pattern : Bullish Falling Wedge Pattern
Current Price: $0.2612
Target Price: $0.62
Target % Gain: 140.67%
Technical Analysis: ZRX has broken out of a bullish falling wedge on the 1D chart, signaling potential reversal. A sustained close above $0.26 confirms bullish momentum, supported by the wedge breakout pattern.
Time Frame: 1D
Risk Management Tip: Always use proper risk management.

ZRX Just Broke Out… But Is It a Bull Trap Before a Collapse?Yello Paradisers did you catch that breakout from the falling wedge, or are you about to get faked out like the rest?
💎#ZRX/USDT has finally broken out of its descending resistance after weeks of compression. While this is a promising signal, this move alone is not enough. What really matters now is how price behaves on the retest. We're watching closely for a pullback either into the previous wedge resistance or directly into the key demand zone between $0.205 and $0.215. That area needs to hold if the bulls want to keep momentum on their side.
💎The structure remains valid as long as we stay above the $0.180 level. A break below that zone would completely invalidate this bullish setup and open the door to a deeper drop. On the upside, if buyers step in with volume, the path toward $0.260 and possibly $0.300 becomes much more realistic.
💎This is not the moment to chase. Let retail traders jump in too early our job is to position smartly, not emotionally. Watch the retest, measure the reaction, and act only when the market confirms.
This is where most retail traders get trapped, they chase the move too late or panic-sell too early. Don’t be that trader. Stay focused. Be precise.
MyCryptoParadise
iFeel the success🌴

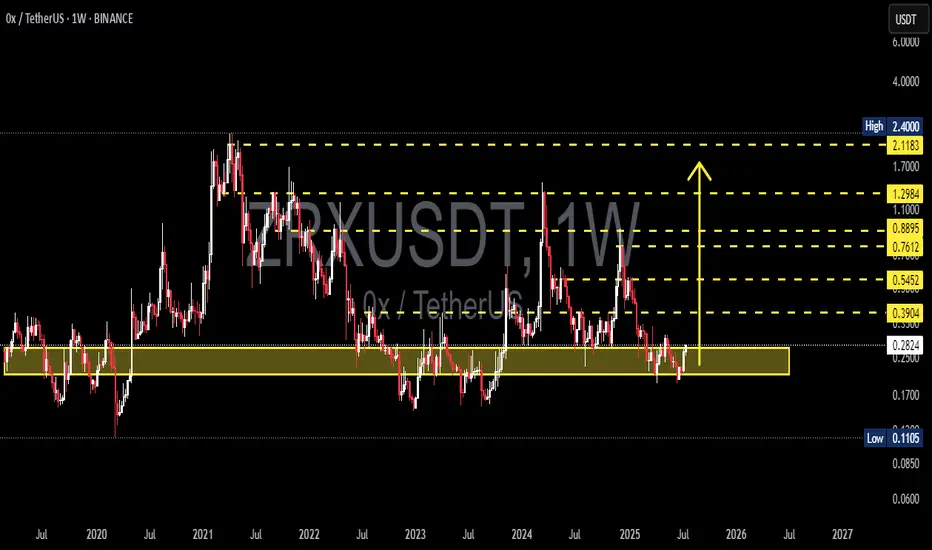
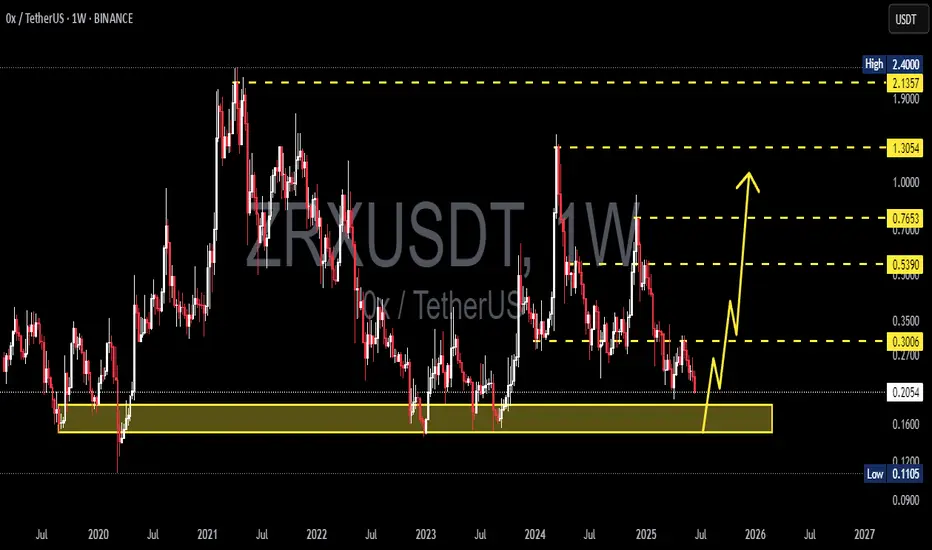
ZRXUSDT Weekly Analysis – Major Reversal Brewing from Multi-Year🔍 Technical Overview:
ZRX (0x Protocol) is currently showing strong signs of a long-term accumulation phase, with price once again revisiting a critical historical demand zone between $0.25 and $0.30. This area has acted as solid support multiple times since 2019, and the current structure suggests a potential macro-level reversal is underway.
Key technical highlights include:
Strong Historical Demand Zone: The yellow box highlights a multi-tested area of support where major rallies have originated.
Double Bottom Formation: A potential double bottom pattern is forming, indicating a reversal setup.
Volatility Compression: Price action has tightened into a sideways range, often a precursor to a breakout.
Well-defined Fibonacci Resistance Levels: Layered resistance targets give a clear path for bullish continuation once breakout is confirmed.
🟢 Bullish Scenario:
If ZRX holds above the $0.28 level and successfully breaks out above $0.39, it could trigger a powerful rally toward higher key resistance zones.
🎯 Bullish Target Zones:
✅ $0.5452 – First major resistance
✅ $0.7612 – Previous breakout level
✅ $0.8895 – Horizontal supply zone
✅ $1.1000 – Psychological round number
✅ $1.2984 – Pre-2022 breakdown area
✅ $2.1183 – $2.4000 – Ultimate high and previous cycle top
A clean breakout from current levels could yield multiple 100% gains, with a favorable reward-to-risk ratio for mid- to long-term swing traders.
🔴 Bearish Scenario:
Failure to hold the $0.25–$0.28 support zone would invalidate the bullish structure and may result in a drop toward the historical low of $0.1105.
Weekly candle close below $0.25 would be a strong bearish signal.
This would suggest prolonged downside or range-bound movement.
🧠 Strategic Notes:
This setup favors patient swing traders and investors looking for reversal plays in oversold altcoins.
Accumulating within the current demand zone, with a breakout confirmation above $0.39, presents a compelling strategy.
Consider using laddered entries and a stop-loss below the demand zone for optimal risk control.
⚠️ Risk Management:
ZRX is a low-cap altcoin, and while the upside potential is substantial, volatility remains high. Always apply strict risk management and position sizing to protect capital.
📌 Summary:
ZRX is offering one of the cleanest reversal setups in the altcoin market. With a historically strong demand base, clear resistance levels, and a favorable reward/risk structure, this chart is worth watching closely in the coming weeks.
#ZRXUSDT #CryptoReversal #AltcoinSetup #TechnicalAnalysis #AccumulationZone #BreakoutTrade #DoubleBottom #SwingTradeSetup #CryptoChart
ZRX Looks Bullish (2D)From the point where we placed the red arrow on the chart, it appears that a triangle is forming.
Now, considering the formation of a double bottom at the low and the break of the bearish trendline, it seems that the price is ready to complete wave E of this triangle.
As long as the new demand zone holds, the bullish move can continue.
The targets are marked on the chart.
A daily candle closing below the invalidation level will invalidate this analysis.
For risk management, please don't forget stop loss and capital management
When we reach the first target, save some profit and then change the stop to entry
Comment if you have any questions
Thank You

ZRXUSDT 1W AnalysisZRX ~ 1W Analysis
#ZRX If you still have faith in this coin. You can consider this support to start buying back from here with a short-term target of at least 20%++
#ZRX/USDT#ZRX
The price is moving within a descending channel on the 1-hour frame, adhering well to it, and is heading towards a strong breakout and retest.
We are experiencing a rebound from the lower boundary of the descending channel. This support is at 0.2175.
We are experiencing a downtrend on the RSI indicator, which is about to break and retest, supporting the upward trend.
We are heading towards stability above the 100 Moving Average.
Entry price: 0.2240
First target: 0.2290
Second target: 0.2357
Third target: 0.2420

0X New Bullish Impulse, New All-Time High Late 2025I see bullish market conditions with a long-term growing base. Each time there is a correction, or bear market, the end price of the move is higher compared to the previous cycle.
The all-time high remains in 2021. This never breaks. There has been some bullish waves but not enough to break the 2021 ath. This time it will be different.
In 2025 we get a new all-time high. Or in early 2026 we get a new all-time high. No, for this one, in 2025.
So late 2025 ZRXUSDT will produce a new all-time high and this will be the highest price ever and it will be something truly awesome.
Right now the chart is great for buyers. If you are a bear (down-red) the chart is no good. The chart isn't good for a bear because it isn't going any lower. In fact, if you were to place a SHORT here, selling with a loan, then you would end up losing everything as prices move up. You would be certain to a receive a nice liquidation, all money gone.
On the other hand, buy spot hold strong or go LONG, and you are in a great place. While the downside is limited at best, there is no limit to how high prices can go in this upcoming bullish wave.
We are seeing the end of the retrace, the higher low after the initial bullish breakout after the end of a major correction.
Here the correction started in March 2024. The first low happened in August 2024 and the lower high December 2024. At the bottom 7-April 2025 the correction ends. The small bounce is the start of the next bullish wave.
So, March 2024 = 0
August 2024 = A
December 2024 = B
April 2025 = C
That's ABC. A classic correction. After a correction we get a bullish impulse and this simply means new heights for this pair. This new high will come in a set of 3 bullish waves with two bearish waves.
1 = bullish up.
2 = bearish down.
3 = bullish up.
4 = bearish down.
5 = bullish up.
1,2,3,4,5. That's the bullish impulse.
Namaste.

ZRXUSDT 1D AnalysisZRX ~ 1D Analysis
#ZRX Buy gradually after successfully breaking through this resistance line with a short-term target of at least 10%++.

#ZRX/USDT#ZRX
The price is moving within a descending channel on the 1-hour frame, adhering well to it, and is heading for a strong breakout and retest.
We are seeing a bounce from the lower boundary of the descending channel, which is support at 0.2586.
We have a downtrend on the RSI indicator that is about to be broken and retested, supporting the upward trend.
We are looking for stability above the 100 Moving Average.
Entry price: 0.2696
First target: 0.2831
Second target: 0.2948
Third target: 0.3123

0x Idea speaks for itself.
We're currently in 'PROVEN BUY ZONE' with past returns well above 6x.
This is not financial advice nor any indicator or promise of future gains, however...
It's undeniable that within last 5.5 years this infrastructure protocol gave plenty of opportunities and there are no fundamentals (known to me) that should negatively impact potential gains of min. 2x from trigger range within next 12M.
At the moment chart has left the trigger range, but it usually takes time before it develops desired structure for a move up. Personally, I'll be looking to make a decision around range top as LTF show confluence area around $0.228-$0.22 and lower, at $0.209.
For those with 'more sophisticated' pallet for a tighter entries, there's a range low to hope for expanding further 30% to the downside.
Worth to come back to this EOY to reconcile.

ZRXUSDT 1WZRX ~ 1W Analysis
#ZRX Buy gradually when re -testing this support with a short -term target of at least 20%+. from here.
