US Stocks Pare Back All Tariff-Fueled Losses. Are We So Back?Remember “Liberation Day”? The one that felt more like Liquidation Day ? When markets tanked, tickers turned red, and you were afraid to check the markets on the next day? Well, turns out the rumors of the market’s demise were — once again — greatly exaggerated.
If the average recession 10 years a
Explore the community

BTC Building Strength – Breakout Ahead?$BTC/USDT Weekly Analysis
Bitcoin continues to respect the 50 EMA on the weekly timeframe — a key dynamic support level that has consistently held throughout this bullish structure.
Each time BTC corrected, it found support near the 50 EMA before bouncing back with strength. The current structure

WC: 27.48 Target: 1800-2400 MOASS: 47k-100K: GAMESTOP DECODEDThis video tells you EXACTLY what's happening with Gamestop and EXACTLY when PRICE will explode
AS FOR ME...I LOVE THE STOCK

GOLD 4H CHART ROUTE MAP UPDATEHey Everyone,
Once again following on from yesterdays update, this 4 chart is also playing out perfectly. After completing both our Bullish 3343 and bearish 3282 targets; we stated price will play tennis between both levels. We also stated that we will look for ema5 cross and lock on either level t

SOL Analysis Deep Dive: Identifying Optimal Entry and Exit ZonesYesterday, SOL gave a sharp downside shakeout, dropping from the weekly open at $147.98 (perfectly retested) down to the 0.5 Fib retracement of the swing at $140.25. Here’s a structured breakdown of the key levels, trade setups, and R:R profiles for both longs and shorts:
🔑 Key Levels & Confluence

ADA/USDT: Is ADA Preparing for Its Next Rally?(READ THE CAPTION)By analyzing the #Cardano (ADA) chart on the 3-day timeframe, we can see that over the past few months, the price surged from $0.33 to $1.32, delivering a gain of over 300%. After reaching its highest level in 3 years, it faced selling pressure and corrected down to $0.50.
Currently, Cardano is tra

Bitcoin - Repeating History: 100k Next Target?Bitcoin is continuing to move with clean structure, driven by demand imbalances and breakout continuation setups. After the initial breakout from the mid-April range, price moved in a highly technical fashion, consolidating, breaking out, forming a fair value gap, and then retesting it before contin

TradingView Live Show: Charting Volatility with TradeStationJoin us for an insightful TradingView live stream with David Russell, Head of Global Market Strategy, as we dive into the impact of tariffs, market volatility, and key macroeconomic developments shaping today's trading environment.
Oh, and don't forget, TradeStation is sharing ideas here: www.tra

Gold-Silver Ratio: Silver’s Lag and Historical DivergencesThe gold-silver ratio - the number of silver ounces equals in value to one ounce of gold – has surged recently as gold prices rally while silver underperforms. Gold, a traditional safe-haven, has climbed to record highs amid economic uncertainty, whereas silver, which is partly an industrial commodi

$SPY Bullish and Bearish TA signals, but leaning BullishShowing multiple time frames with different TA patterns--some harmonizing, while some are conflicting. When I put it all together the sum for me is slightly bullish.

See all editors' picks ideas
Understanding Liquidity: Where Big Players Hunt Stops
Understanding Liquidity: Where Big Players Hunt Stops
Ever wondered why price suddenly spikes through your stop-loss and reverses moments later? That’s not a coincidence—it’s liquidity at play. This article will teach you how liquidity zones work, why stop hunts happen, and how to avoid getting

Mastering Stop Losses: How Not to Trigger Them at the Worst TimeThere are few things more humiliating in trading than setting a stop loss… only to have the market tag it by a hair’s breadth before rocketing in the direction you knew it was going to go.
Oftentimes (hopefully not too often), stop losses are the financial equivalent of slipping on a banana peel

Unlock Trading Success with Multi-Timeframe MasteryIn trading, particularly in the Forex market, a well-defined strategy is crucial for consistent profitability. One of the most effective techniques used by successful traders is multi-timeframe (MTF) analysis. By examining price action across different timeframes (e.g., daily, 4-hour, 1-hour), tra

The Gold-Silver Ratio ExplainedCOMEX: Micro Gold Futures ( COMEX_MINI:MGC1! ), Micro Silver Futures ( COMEX_MINI:SIL1! )
The Gold-Silver Ratio is a financial term that measures the relative value of gold to silver. Specifically, how many ounces of silver it takes to buy one ounce of gold.
The Gold-Silver Ratio is an important

Russia-Ukraine Peace Agreement what could it mean to forex!A peace agreement between Russia and Ukraine could send ripples through the Forex and Commodities markets. Here's how major assets might react:
📊 Key Market Shifts to Watch:
✅ Risk-On Sentiment Returns
Traders may rotate out of safe havens like USD, JPY, CHF, and Gold.
Risk currencies like A

Real Success Rates of the Falling Wedge in TradingReal Success Rates of the Falling Wedge in Trading
The falling wedge is a chart pattern highly valued by traders for its potential for bullish reversals after a bearish or consolidation phase. Its effectiveness has been extensively studied and documented by various technical analysts and leading au

Discipline in Trading: The Indicator That Works 100% of the TimeEvery trader has that one folder — “Winning Indicators,” “Secret Scripts,” or the iconic “Final Strategy v12_REAL_THIS_ONE_WORKS.” It's where we hoard indicators like Pokémon, convinced the next RSI+MACD+SMA combo tweak will finally reveal the holy grail of trading.
Spoiler: it won’t. Because the r

Trend Exhaustion SignalsTrend Exhaustion Signals: How to Know When a Trend is Losing Steam
Every trend eventually runs out of fuel. Knowing when momentum is fading can give you the edge to exit early, avoid late entries, or even prepare for a reversal. This article dives into key signs of trend exhaustion and how to tra

“Does size matter?” when it comes to backtesting?It’s the kind of question that gets a few smirks, sure. But when it comes to backtesting trading strategies, it’s not a joke, it’s the difference between confidence and false hope.
Let’s get real for a minute: the size of your candles absolutely matters.
What you don’t see can hurt you
Most peo

The Charts Wall Street Watches – And Why Crypto Should Too📉 Crisis or Rotation? Understanding Bonds Before the Bitcoin Reveal 🔍
Hi everyone 👋
Before we dive into the next major Bitcoin post (the 'Bitcoin Reveal' is coming up, yes!), let's take a moment to unpack something critical most crypto traders overlook — the world of bonds .
Why does this mat

See all editors' picks ideas
WC: 27.48 Target: 1800-2400 MOASS: 47k-100K: GAMESTOP DECODEDThis video tells you EXACTLY what's happening with Gamestop and EXACTLY when PRICE will explode
AS FOR ME...I LOVE THE STOCK
TradingView Live Show: Charting Volatility with TradeStationJoin us for an insightful TradingView live stream with David Russell, Head of Global Market Strategy, as we dive into the impact of tariffs, market volatility, and key macroeconomic developments shaping today's trading environment.
Oh, and don't forget, TradeStation is sharing ideas here: www.tra
$SPY Bullish and Bearish TA signals, but leaning BullishShowing multiple time frames with different TA patterns--some harmonizing, while some are conflicting. When I put it all together the sum for me is slightly bullish.
EURUSD -Broke and Retested Right ShoulderEU - Is providing a great entry. Its sitting on a 4 hour ob. price has been sitting for 3 years in a consolidation phase. looks like this year we are looking to be in a bullish phase. price is sitting on a nice solid support. I will be looking to enter a buy today and hold to the next resistance are

Signs of a possible topBoth spy and vix reached a possible ending target today. We'll see what it looks like tomorrow but right now my feeling is either we topped or there will be one more final squeeze to 5600 tomorrow.

ASX 200 Stalls at Resistance, Pullback Pending?Here is my 2-minute take on the ASX 200 futures daily chart, where I discuss my hunch that a pullback could be due and how that could set us up for a better long setup further out.
Matt Simpson, Market Analyst and Forex.com and City Index

Where Is Market Going ? Hint Have A Hedge SmallMarkets in no mans land looking 565
Then dump break make new lows
lets see how we do tomorrow .

I am Slightly bullish BUT waiting for more dataFollowing the ideas from earlier in the week, I’m currently waiting on price action to give me more clarity. The market has been pushing higher for the past two days, and while there’s potential for a retracement, it could also be setting up for a continuation to the upside.
I’ll wait until the mar

Oil Short: Ending Diagonal and Rising WedgeI propose that Oil is a good short candidate because of what I am seeing:
1. Rising Wedge
2. Ending Diagonal within the Rising Wedge
I propose 3 entry points for shorting but mention that if you are shorting at the top of the trendline, to cater for false breakout, meaning more allowance in your st

S&P 500 - Key Levels and April 7-11 Weekly Candle StructureApril 7-11 will easily be remembered in 2025 as one of the craziest weeks in modern history.
Intraday swings were face ripping all from a Monday "fake news" becoming Wednesday "real news" with the US pausing tariffs for 90 days
5500 major resistance on S&P
4800 major support on S&P
I believe the

See all editors' picks ideas
Dual-Phase Trend Regime Oscillator (Zeiierman)█ Overview
Trend Regime: Dual-Phase Oscillator (Zeiierman) is a volatility-sensitive trend classification tool that dynamically switches between two oscillators, one optimized for low volatility, the other for high volatility.
By analyzing standard deviation-based volatility states and applying

Nasan Risk Score & Postion Size Estimator** THE RISK SCORE AND POSITION SIZE WILL ONLY BE CALCUTAED ON DIALY TIMEFRAME NOT IN OTHER TIMEFRAMES.
The typically accepted generic rule for risk management is not to risk more than 1% - 2 % of the capital in any given trade. It has its own basis however it does not take into account the stocks

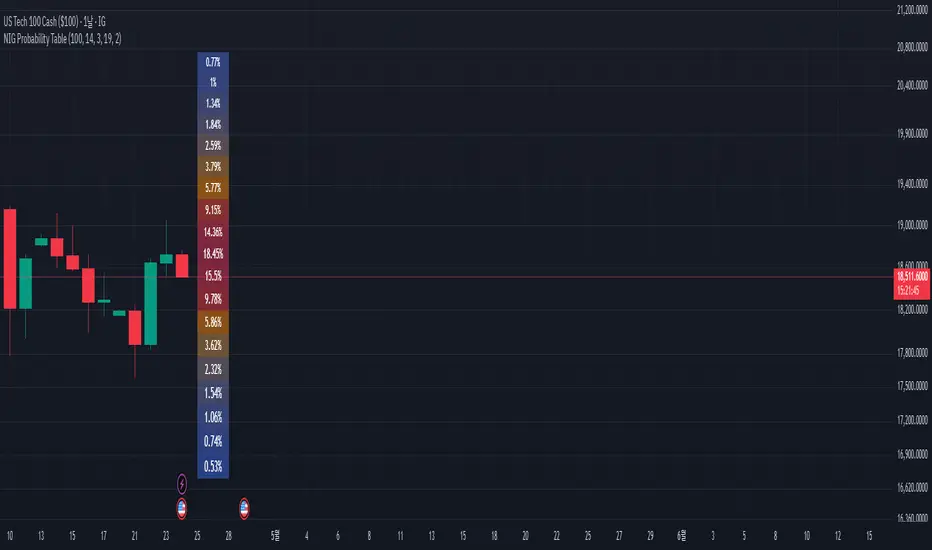
NIG Probability TableNormal-Inverse Gaussian Probability Table
This indicator implements the Normal-Inverse Gaussian (NIG) distribution to estimate the likelihood of future price based on recent market behavior.
📊 Key Features:
- Estimates the parameters (α: tail heaviness, β: skewness, δ: scale, μ: location)
of th
Log-Normal Price ForecastLog-Normal Price Forecast
This Pine Script creates a log-normal forecast model of future price movements on a TradingView chart, based on historical log returns. It plots expected price trajectories and bands representing different levels of statistical deviation.
Parameters
Model Length –

Market Sessions & Viewer Panel [By MUQWISHI]▋ INTRODUCTION :
The “Market Sessions & Viewer Panel” is a clean and intuitive visual indicator tool that highlights up to four trading sessions directly on the chart. Each session is fully customizable with its name, session time, and color. It also generates a panel that provides a quick-glance

Elastic Volume-Weighted Student-T TensionOverview
The Elastic Volume-Weighted Student-T Tension Bands indicator dynamically adapts to market conditions using an advanced statistical model based on the Student-T distribution. Unlike traditional Bollinger Bands or Keltner Channels, this indicator leverages elastic volume-weighted averaging

Dynamic RSI Regression Bands (Zeiierman)█ Overview
The Dynamic RSI Regression Bands (Zeiierman) is a regression channel tool that dynamically resets based on RSI overbought and oversold conditions. It adapts to trend shifts in real time, creating a highly responsive regression framework that visualizes market sentiment and directional

The Mayan CalendarThis indicator displays the current date in the Mayan Calendar, based on real-time UTC time. It calculates and presents:
🌀 Long Count (Baktun.Katun.Tun.Uinal.Kin) – A linear count of days since the Mayan epoch (August 11, 3114 BCE).
🔮 Tzolk'in Date – A 260-day sacred cycle combining a number (1–

Machine Learning RSI ║ BullVisionOverview:
Introducing the Machine Learning RSI with KNN Adaptation – a cutting-edge momentum indicator that blends the classic Relative Strength Index (RSI) with machine learning principles. By leveraging K-Nearest Neighbors (KNN), this indicator aims at identifying historical patterns that resembl

Half Causal EstimatorOverview
The Half Causal Estimator is a specialized filtering method that provides responsive averages of market variables (volume, true range, or price change) with significantly reduced time delay compared to traditional moving averages. It employs a hybrid approach that leverages both historica

See all editors' picks scripts