IMPROVE YOUR TRADING | Simple Flowchart For You to Follow 🧭📍
A short ⚠️disclaimer before we start:
the rules that will be discussed in this post are applicable only for technicians - traders that are relying on price action/structure/etc.
Also, we assume that structure levels do work and for us, key levels are considered to be the safest trading zones/points.
In order to increase the accuracy of your predictions analyzing different financial markets, you must learn to identify the direction of the market.📈
The identification of the market trend must be based on strict & reliable & testable rules.
It can be based on technical indicators or price action
Personally, I prefer to rely on price action.
Here are a couple of examples of how I identify the market trend:
There are three main types of market trends:
Bullish Trend
Bearish Trend
Sideways Market
Depending on the current direction of the market, on the chart, I drew a flow chart✔️ that will help you to act safely.
➡️Sideways market signifies consolidation & indecision. Usually being in such a state the market tends to coil in horizontal ranges.
To trade such a market safely, the best option for you will be to wait for a breakout of the range & wait for the initiation of the trend.
➡️Once you spotted a bullish market, do not rush to buy.
Your task will be to identify the closest strong structure support.
You must be patient enough to let the price reach that support first (and by the way, there is no guarantee that it will happen) and then you must wait for a certain confirmation.
Please, check the article about different types of confirmations:
Only once you get the needed confirmation you can buy the market.
➡️The same strategy will be applicable to a bearish market.
Spotting a short rally it is way early to just sell the asset from a random point.
You must find the closest strong structure resistance and wait for the moment when the price will approach that.
Then your task will be to wait for a confirmation and only when you got the reliable trigger you short the market.
🦉Try to rely on this flow chart and I promise you that you will see a dramatic increase in your trading performance.
And even though it may appear to you that this flow chart is TOO SIMPLE, in practice, even such a set of rules requires iron discipline and patience.
Thank you so much for reading this article,
I hope you enjoy it!
❤️Please, support it with like and comment. Thank you!
Trading Plan

How to use trendline to identify price action structure/patternHi everyone:
Many have asked me about how to properly use trendlines to identify price action structures and patterns. So in today’s educational video, I will go over this topic in more detail.
First, I use the trendline as a “frame” to identify structures and patterns, and NOT use it as a Support/Resistance.
What I do is to put in the trendline for the highs and lows of the price action that can help me to pinpoint what the price is doing, what kind of a correctional structure that it is currently in.
Typically after an impulse phase of the market, then we start to identify a structure/pattern by connecting the swing highs and lows.
Second, as I always point out in my videos/streams, a structure/pattern needs at least 2 swing highs and lows to classify as a structure.
Certainly more swing highs and lows are good, but it's not necessary. Often I get asked about the “third touch” or more. To me it's not necessary, but if price does form the third touch, I would proceed the same as the price has a second touch.
Third, we are identifying the price action correctional structure, and sometimes the market is not perfect, it will not give you a textbook looking bullish flag as an example.
Hence the backtesting and chartwork from each trader is important to get your mind familiarized with the market and its “imperfect” development of the price action.
After identifying the impulse phase, then look to see what the market is doing. Is it falling into a consolidation ?
Not much movement except sideway price action, or ascending/descending like consolidation will give you a clue on whether the price is correcting to continue, or correcting to reverse.
Take a look at the educational videos I have made in the past regarding the type of correctional structures we typically see in the market. All the videos are down below.
Continue to backtest and do chart work to get familiar with drawing in the structures/patterns. The more you do these, the better and easier it is for you to identify them in your trading journey.
Remember, the market is not perfect, so not all the structures/patterns will be “Textbook” like on the real, live market. Learn to deal with the “imperfect” market, so you can better utilize price action analysis to your advantage.
Any questions, comments or feedback welcome to let me know :)
Thank you
Below are all my price action structures/patterns videos on different type of corrections.
Continuation and Reversal Correction
Identify a correction for the next impulse move in price action analysis
Impulse VS Correction
Multi-time frame analysis
Continuation Bull/Bear Flag
Parallel Channel (Horizontal, Ascending, Descending)
Reversal Ascending/Descending Channel
Reversal Rising/Falling Wedge
Reversal Double Top/Bottom
Reversal Head & Shoulder Pattern
Reversal “M” and “W” style pattern
Reversal Impulse Price Action
Continuation/Reversal Expanding Structure/Pattern

What Type Of Forex Trader Are You? Four Types Of Forex Traders:
1) Day Trader- A day trader is one who closes all trade positions at the end of each trading day and makes sure there are no open positions overnight. Day traders function with an extensive knowledge and experience of what the Forex entails. This category of Forex traders makes use of a variety of methods to make proper trading decisions that lead to success. Some trade securities with the use of technical indicators and analysis in the calculation of favorable trade entry and exit time frames while other trade based on instincts.
2) Position Trader- A position trader trades securities in the Forex market by holding a trade position for a long-term, in a period of weeks to months and sometimes, years. These set of traders, unlike day traders, are less concerned with short-term price fluctuations and the economic news release of the day. Position traders are not active traders. They initiate few trade positions in an entire year.
3) Scalper Trader- A scalper trader holds a trade position for a short-term period in an attempt to make profits out of the short hold. These set of traders buy and sell securities many times in a day with the mindset of making a small percentage of consistent profits out of the market. A scalper uses a manual and automated trading system on various platforms thereby developing functional strategies that generate profits from the bid and ask spreads. The manual system of trading involves the trader making trade executions while sitting in front of his computer while the automated trading strategy involves the trader setting rules and guidelines on how to use trade signals.
4) Swing Trader- A swing trader are those who make profits and returns in the Forex market by holding a trade position overnight to several weeks. These set of traders make use of fundamental analysis, the intrinsic value of a security, price trends, patterns, and technical analysis to search for financial instruments with short-term price momentum. Swing traders trade by the identification of securities which has an extraordinary possibility to move in a short time frame. The goal in swing trading is to trade on large price moves on a daily basis by spending longer time (weeks and months) monitoring the security in question.

Different forex trading order types:What we are going to do here is give a refresher on the types of orders in Forex trading so you can begin really taking advantage of what is available and hopefully incorporate additional order types to your trading style and money management approach better.
Please read carefully everything in the picture, I'm sure will be helpful for you!
The list of order types in forex trading:
Market Orders
Limit Orders
Take Profit Orders
Stop Loss Orders
Trailing Stop Orders
P.S. Did you like my article? Share it with your friends, it will be the best “thank you" :)
Ask me questions and comment below. I’ll be glad to answer your questions and give necessary explanations.

Rally Base Rally (Need2Know)Part 2: Rally Base Rally
Rally- Prices go suddenly upwards
Base- Price goes into a range or sideways makes a demand zone
Base areas are always best times to get on trades with right risk management always.
Rally- Price breaks out of demand zone and continues on upwards

Drop Base Drop (DBD) Need2KnowPart 1: Drop-Base-Drop
Drop- market suddenly is bearish
Base- market ranges or goes sideways, then
Drop- market again breaks out of range and goes down
Note: The Base area on 1 hour, 4 hour and daily charts are best times to set up any new trades with right risk management as always.

High or Low Liquidity & Volume (When Is It?)Liquidity and Volume (When Is high and low periods of both?)
Generally per day in Forex trading 24/5 market their is 12 hours of low liquidity and low volume, which is after London ends to Tokyo ends.
Then, the other 12 hrs of high liquidity and high volume, which is easier to scalp or day trade which is at end of Tokyo to end of London.
You would need to know when Tokyo ends to London ends in your time zone (yes that overlaps New York 1st 4 hours too). Best hours to trade.
For your health: keep Forex trading within a certain times of days, so you can live life and maintain balance and enjoy fresh air......

Trading Daily Charts (Might Save Your Trading)If You Master Forex Trading On Daily Charts, You Can Trade For A Lifetime. (Understand the language of candlesticks on daily charts)
1) Quality trades not Quantity of trades- Trade your best trade setups only at swing points on daily charts.
2) Patience- You make money waiting not trading. You do not need to trade 20-30 times on lower time frames per month, when 2-3 times will make same money with less emotions and stress. Also, you will have more time freedom to enjoy life and find balance. Forex trading is not everything you are.
3) Probabilities- Only trade your best set ups at swing points (ex: like support/resistance, fib ret 50% to 61.8% area, swing points, etc..
4) Lower Lot Size- Related to using high stop loss, but like chart example let trade run for one or two weeks. 1:5 to 1:8 Risk Reward on trades will be goal.
5) Turtle Not Rabbit Trading Is Key- Trading Forex is a turtle marathon not a rabbit sprint race. Slow down- have faith in your strategy and edge.
6) Daily Trading Might Be Your Holly Grail- Look for entering only on Engulfing, Harami or Pin-bar setups on daily charts (that is all you need).
If you are part of the majority of Forex traders whom trading is difficult, DO NOT trade lower time frames which are under 1 hour (to much noise).
Only trade daily time frames until the end of this year and master them. Then maybe, next year can go to lower time frames of 4 hours and 1 hours. You tube videos on Forex trading position sizing, risk management and Forex daily charts. Daily charts help develop a more effective and accurate market bias, higher risk and reward (look at example chart) with 50 pip stop risk vs. 5xs to 8xs reward- which is great. Slow ans stead wins the race (Hare vs Turtle).

Spot Trading vs Margin Trading Pros and ConsSpot Trading is the most basic form of trading method and is the most suitable for beginners in trading. It's simply a BUY > HOLD > SELL mechanism.
On the Other Hand
Margin Trading is complicated and should only be done by experienced traders. There are various components to margin trading such as Maintenance margin, margin calls, leverage, and liquidation.
Pros and cons of Spot Trading
👉Spot trading is easy to learn and understand and is a good starting point for beginners in Trading.
👉It's an easy process to manage risk in spot trading not taking all the complications of liquidation or margin calls.
👉You can hold an asset for a much longer time and in the case of cryptocurrency can also transfer to any cold wallet.
👉No Trading happens during downtrends.
👉The potentials gains are not very good on a smaller investment amount.
Pros and cons of Margin Trading
👉Margin Trading needs some advanced knowledge of various things such as margin calls, liquidation, leverage, etc. Hence it's not recommended for new traders.
👉You can make profits on both uptrends(by going LONG) and downtrends(by going SHORT).
👉Gives an ability to trade much larger amounts with a relatively small initial investment by using leverage.
👉Margin Trading is risky, and if not done properly can blow your account in a very short time span.
👉Profits are higher when utilizing margin trading, and so are the losses. Every exchange has its own rules for margin trading, which need to be understood carefully before investing.
Thanks for reading and what kind of trading technique do you use and why? Share in the comments below.
For more similar educational ideas, scripts and trend analysis follow us.
Happy Trading.

Daily Primer: Break your limits 💥In todays daily primer we talk about limitations and cause and effect. This short 5 minute video will give you the necessary guidance as to what you need to focus on to achieve the success you seek in the markets.
Success in trading, just like in any other business, is a
cause and effect relationship:
Poor or average causes = poor or average results
good causes = good results
excellent causes = excellent results
If you want to achieve success, do the work!
(metal: have patience, discipline, resilience)
(work ethic: prepare your charts, know the news, prepare your plan)

Forex Correlations ( Need To Know )Noted chart only has a few highly traded pairs and their either highly correlated negative or positive pairs on daily charts.
If you trade more then one pair at a time, you should know which pairs either mostly go same direction and or go opposite direction.
You might not want to do two trades that have a positive correlation or negative correlation for diversity and so you do not lose two trades at same time.
There are websites which have further information on Forex correlation- you should check out.

Top 5 Most Traded Forex Currencies & Sessions The Top 5 Most Traded Currencies in the World
1. US Dollar (USD)
The official currency of the United States of America, the US Dollar is also the world’s primary reserve currency.
Most traded currency pair: EUR/USD
Most active trading session: New York and London sessions
2. Euro (EUR)
The second widely traded currency is the Euro.
Most traded currency pair: EUR/USD
Most active trading session: London and New York sessions
3. Japanese Yen (JPY)
The Japanese Yen is the official currency of Japan.
Most traded currency pair: USD/JPY
Most active trading session: New York and Tokyo sessions
4. Great British Pound (GBP)
The official currency of the United Kingdom and its territories, the GBP is known colloquially as the Pound Sterling.
Most traded currency pair: GBP/USD
Most active trading session: London and New York sessions
5. Australian Dollar (AUD)
The Australian Dollar is the official currency of the Commonwealth of Australia.
Most traded currency pair: AUD/USD
Most active trading session: Sydney/Tokyo and New York sessions

The Different Types Of Trading StrategiesHello everyone, as we all know the market action discounts everything :)
_________________________________Make sure to Like and Follow if you like the idea_________________________________
In today’s video, we are going to be talking about The Different Types Of Trading Strategies, We are going to compare them to each other and look at their characteristics.
Characteristics include 1) Time Duration, Type of Chart, Trade Targets & Risks, Frequency of Trades, Entry and Exit Time.
There are 4 types of trading styles :
Most people fall in the first 3
1) Scalping
2) Day trading
3) Swing trading
4) Position trading (Refers to holding a certain position over a very long time frame like a number of years, I think this type of trade is more of an investment than trading but technically it's still trading so I had to mention it ).
So Let Us Start...
1) Scalping
Time Duration is between a few seconds and a number of minutes
The Analysis is done on 1,2 and 5 minutes charts
Small targets considering the very short trade duration
High frequency of trades because of the small risk on each trade
Scalpers need to know exactly when to enter and when to exit a trade because a small mistake can have a huge impact on the trade
2) Day trading
Time Duration from 15 min to a number of hours
The analysis is done on 30 min, 1 hour, and 4-hour charts
These trades have a larger target than Scalping
Day Traders have a lower trade frequency than scalpers and its usually between 2-10 trades per week
Day Traders doesn’t have to be so precise with entry and exits like in Scalping because being late for a trade on a daily basis won't have that much of an impact on the trade.
3) Swing trading
Time Duration typically last from a day to a couple of months
The Analysis is done daily, weekly & monthly charts
Because of the time frame, Targets usually are way larger than day trading or scalping
Low frequency in trades, Usually between 2-15 trades per month
Entry and exits here don’t have a big impact because the targets are so big
So now you ask yourself how do I know which type of trader am I?
And it comes down to 2 main factors :
Personality: You could be someone who likes to hold trades and profit big so swing trading is for you, Or you could be someone who doesn’t like to hold trades over a day period so scalping or day trading could be for you.
Lifestyle: So you may not have the time to always watch the market and how it's moving, so scalping and day trading are not for you, but for swing trading, u only have to check the market once a day so it's the better option for you.
Don’t feel like you need to decide what type of trader you are, you should try all of them and see for yourself what are you comfortable with after all there is no right answer.
I hope that I was able to help you understand The Different Types of Traders better and if you have any more questions don't hesitate to ask.
Hit that like if you found this helpful and check out my other video about the Moving Average, Stochastic oscillator, The Dow Jones Theory, How To Trade Breakouts, The RSI, The MACD, and The Bollinger Bands, links will be bellow

🤫 You don't need much to succeed in tradingAll you need is...
> Good habits, both mental and technical
> (relentless) hard work
> Consistency in process
> 100% focus when trading

8 Major Currencies Nickname & Sessions Best Times to Trade 8 Major Currencies is when base currencies session is open. Why? It is time when highest liquidity & volume is trading.
Sydney:
AUD
NZD
Tokyo:
JPY
CHF
Frankfurt/London:
GBP
EUR
New York:
USD
CAD
PLEASE CONVERT SYDNEY-TOKYO-FRANKFURT/LONDON-NEW YORK sessions to your individual time zones: to get exact times of open and closes and overlapping sessions of TOKYO/LONDON and LONDON/NEW YORK sessions. Overlapping are highest liquidity and volume times of the Forex session.

8 Benefits Of Trading Forex8 Benefits Of Trading Forex-
-Low cost
Generally, retail brokers make their profits from the Bid/Ask Spread, which is apparently very transparent to users.
-No middle-people
It allows you to trade directly with the market accountable for the pricing of the currency pair.
-No fixed lot size
Lot sizes differ broker to broker - standard lot, mini lot, micro lot or even nano lots. This enables you to start trading from as low as $50.
-Low transaction costs
The retail transaction cost (bid/ask spread) is usually as low as 0.1% and for bigger dealers, this could be as low as 0.07%.
-No one can control the market
The foreign exchange market is large and has many participants, and no single participant (not even a central bank) can control the market price for a prolonged time period. Therefore, the chances of sudden extreme volatility is very rare.
-24-hour open market
The Forex market starts, from the Monday morning opening of the Sydney session to the afternoon close session of New York session.
- Use of Leverage and Margin
Forex brokers permit traders to use leverage and with low margin, which gives ability to trade with more money than what is available in your account.
-Very High Liquidity
Because the size of Forex market is huge, it is extremely liquid in nature. This allows you to buy or sell currency any time you want under normal market conditions. There is always someone who is willing to accept the other side of your trade.

The Bid-Ask Spread (What Is It?)The spread is the difference between the bid price and the ask price.
The bid price is the rate at which you can sell a currency pair.
The ask price is the rate at which you can buy a currency pair.
Whenever you try to trade any currency pair, you will notice that there are two prices shown, left price is BID and right price is ASK.
The spread is brokerages commission on that trade, that is why all trades start off in negative until that spread is negated before turning profitable.
For Your Information:
The lower price is called the “Bid” and it is the price at your broker (through which you’re trading) is willing to pay for buying the base currency.
The higher price is called the ‘Ask’ price and it is the price at which the broker is willing to sell you the base currency against the counter currency.

What Is The 80/20 Rule? (Forex trading)What is the 80/20 rule? this applies to play, work, trading, business and all parts of your life.
20% (of your trading) equals 80% (of your results).
An 80/20 mindset enables you to take control!
- More Time
- More Focus
- More Money
- More Freedom
- Less Stress
" Time Is A Gift"
"Time Is Money"
Questions To Ask Yourself?
1) Can you trade less and make more money trading?
2) Can you trade only high quality trades with the right pair, at right price, during right session & at right time?
3) Can you focus on only trading only one or few Forex pairs and know everything about them? news, price action etc...?
4) Can you trade with a simple and repeatable trading system and edge to profit in long run? Is trading strategy flexible?
5) Can you always use discipline when trading? using risk management: stop, entry and targets to protect your account?

Risk Management (Your #1 Priority)Risk Management in Price Action Trading
Risk management in price action trading is much like risk management in any other style of trading; the same basic rules apply:
1. Know your maximum risk tolerance, i.e. the loss you are willing to take on each trade, before you place the trade. A common rule is that traders will not put more than 2% of their funds in the market at a time.
2. Understand correlation between assets, and to what extent you would like to be diversified.
3. Know when you will exit before you enter.
4. Know your reward/risk ratio.
5. Identify what you expect to happen and why, and what price point negates that expectation. This is price point at which you should put stop. Of course, with risk management, techniques are important, but, ultimately, it is up to the trader to ensure they are psychologically prepared for all that is involved.
Even if a trader is using a fully automated system, he/she must still have confidence in the system, and must know when any losing streak experienced is just a temporary losing streak versus a more fundamental problem suggesting the system is no longer valid.

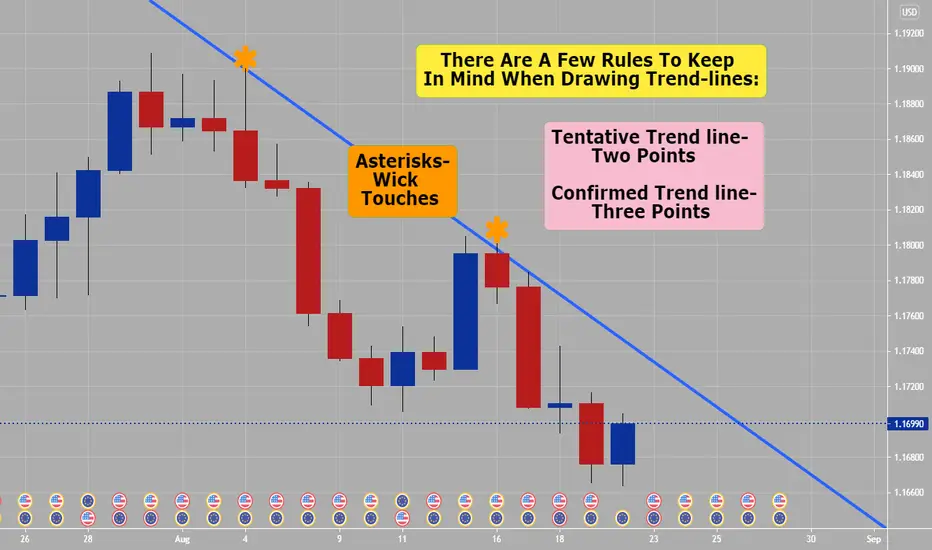
Trend lines (How To Draw & Use)There are a few basic rules to bear in mind when drawing trend lines:
1. Tentative trend line - A diagonal line market bounces off of twice. This trend line is indicative of a potential trend, but is not confirmed & actionable yet.
This is a tentative trend line; two points touch the line. It suggests the possibility of a trend in the making, though conventional analysis will not regarding the trend as established until there are three points on the line.
2. Confirmed trend line - The market has bounced off this trend line three times. Conventional analysis regards this as a sign that the trend line is real, and that the market will react around it.
It is easiest to trade from a trend when its highs or lows trend closely to a recognizable diagonal line, since this line may be used to predict future highs or lows. Opinions vary on whether trend lines should be drawn from the highs and lows of candles or from body of the candle, open & close prices; successful traders can be found employing either approach.
In an up trend, trend lines touched three times, this validates the trend line. Those who wish to trade with the trend may have looked for opportunities to buy based on validated trend. Price pulled back to the trend line that was previously confirmed. Traders can do a trend trade & may be a buying opportunity.
Support and Resistance
The price action trader pays particular attention to pivotal price levels, often “drawing” these lines horizontally as Support and Resistance levels. The theory behind employing these lines is that the market has a sort of memory: price behaves with respect to certain levels that have previously been significant
turning points in the historical narrative of the price’s action, and other market participants are likely
The Hard Truth About Trading 😅
Well, that is just a joke.
Or not a joke?
In every good joke, there's a sliver of truth...
So many people blew their trading accounts in a blink of an idea chasing the profits, so many people went bankrupt practicing leverage trading...
Do not be that guy in a picture.
Be a true trader!
Never forget about risk management and don't be greedy.
Never let your emotions control you.
Stay calm and humble while you trade.
Have a great weekend!
❤️Please, support these drawings with like! It really helps!

How To Trade With The Big Banks (Price Cycle Trade Setup)Elements To The Trade Set Up: Price Cycle Of Institutions.
1) Expansion= Order block/Zone
Is when price moves quickly from a level of equilibrium in other words when price breaks out of consolidation. This will leave an order block or zone behind.
2) Retracement= PA Fills In Any Imbalance
Is when price pulls back inside the recently created price range or close to breakout of expansion area. Look for imbalance to be filled on retracement.
3) Reversal= Seek To Pick UP Liquidity
Is when price moves in the opposite direction from the current market direction was moving in. (from up trend to a downtrend).
4) Consolidation= Equilibrium In PA
Is a period of ranging or sideways price action, before expansion in price action area.
