Five Ways To Use The Multiple Chart LayoutOur multiple chart layout tool gives traders and investors an easy way to study multiple symbols or timeframes at once. In this post, we'll explain five ways to use the multiple chart layout feature to optimize your process.
Chart different timeframes
If you look closely at the charts above, you will notice that there are different timeframes for each chart. One is a daily chart, one is a weekly chart, and another is a 30-minute. The multiple chart layout makes it possible to see these different timeframes all on the same screen. If you search for trades and do research on all time horizons, this is an important feature to master.
Customize the look and feel of your layout
Every trader and investor is different in their approach. That's why it's important to have customization tools available. Each chart in the example above uses a different color gradient as its background. The chart farthest to the right is also a line chart while the other two show candlesticks. When using the multiple chart layout you can create your own custom workspace to match your individual style needs.
Diversify your indicators
The charts above also show different indicators. For example, the yellow line farthest to the left is a Moving Average while chart in the middle shows a Volume Profile and the chart on the far right shows only volume. You can add only the indicators that matter for each specific chart within your layout.
Chart different symbols at once
In the example above, we're looking at three totally different symbols, but all viewable on one screen. This way we can follow price action, study similarities, and look for ideas across different assets. It speeds up our research and is another helpful way to monitor different symbols across the market.
Sync your charts
With the click of a button you can sync the symbol, crosshair, interval, time, and drawings for all charts in your layout. To get started, click the layout button at the top of your chart and then find where it says "SYNC ON ALL CHARTS." From this menu you can select the syncs you need so that they all update instantly.
Thanks for reading and we hope you enjoyed this post! If you have any tips, suggestions or feedback to share about the multiple chart layout please write it in the comments below.
Trading Plan

Statistical approach to risk management - Python scriptThis script can be used to approximate a strategy, and find optimal leverage.
The output will consist of two columns, one for the median account size at end of trading, and one for the share of accounts liquidated.
The script assumes a 100% position size for the account.
This does not take into account size deviations for earnings and losses, so use with a grain of salt if your positions vary greatly in that aspect.
Code preview
cdn.discordapp.com/attachments/592684708551327764/848701541766529034/carbon.png
TradingView does not allow posting external links until you've reached a specific reputation, so i can't use the url feature
Input explanation
WINRATE : chance of winning trade
AVGWIN : average earning per winning trade
AVGLOSS : average loss per losing trade
MAX_LEVERAGE : maximum leverage available to you
TRADES : how many trades per account you want to simulate
ACCOUNTS : how many accounts you want to simulate
the inputs used in the source code are from one of my older strategies, change them to suit your algorithm
Source code
pastebin.com/69EKdVFC
Good luck, Have fun
-Vin

Is there hope for Forex retail traders wanting to make money?The numbers are disastrous. Virtually all Forex retail traders lose money. Most of those that persist lose big.
There is no improvement over time, no matter how many years they keep trying, and no matter how much help they get. There is no hope.
How bad are really the stats? And why are they so bad?
Let's look at the evidence.
Citi 2014 presentation of the Retail FX market
They say there are 4 million traders (implying FX), 1.6 million in Asia, 1.4 million in Europe, and 150,000 in the USA.
Mainly male (shocker) and of an average age of 35.
It does not add up.
An AMF doc from the same period looks at 15,000 traders from intermediaries representing 50% of the market.
So 30k for France and 1.4 million in Europe?
Americans are into stocks so their number is much smaller as expected.
An unsurprising quote from the doc: "FXCM accounts larger than $10,000 have profitability that are double the average.
Part of it is likely due to the natural selection of profitable averaged-sized accounts surviving and becoming large accounts."
And the CEO said in an interview the smallest accounts pushed the winrate down.
This doc says "Strictly Private and Confidential" so I won't share it even though it is accessible on the ECB website.
Conflicting evidence: The elusive profitable FX individual investors
According to the paper linked below, a studied sample of 1,231 accounts were found to be profitable on average (0.2%).
www.researchgate.net
Most people feel bad, demoralized, sick to the stomach, when they hear everyone loses money trading.
Me, I feel bad, disgusted, demoralized, when I hear that noobs have the ability to make money. Almost makes me want to cry.
There is something really rotten about clueless casuals finding success. Yuck I can just picture them being joyful and euphoric.
I don't know, I don't understand, where this data comes from.
I need to wash my eyes with some IG, FXCM, and myfxbook client positions data :)
I need to warm my heart by seing dumb monkeys constantly go against the trend and hold losers for weeks 😊
In this paper we do not know who the guinea pigs studied are, how long have they been in the business?
What we know is how long they subscribed to a service. And the average was 0.27 years, or 3 months.
Those are not your usual daygamblers as:
- The average opening equity is $90,854.03
- Average Holding Time for Trades (in h) 1,508.48 (63 days or 2 months)
- The average total net gain was $190.30 (0.2% of 91k), it might only be from interests
So this paper does not look at average Forex retail traders at all. Stats change completely when you remove the degenerates.
You look at FXCM and IG client stats, you might find 80% short on a big uptrend, then you look at myfxbook - which attracts all the "robot trading" clowns, and 95% are short!
The more daygamblers and "automated expert advisor 🤡" and 800 leveragers you have, the worse the stats.
Remove all these 🤡, and sure then you get a totally different result.
Conflicting evidence: 99% of noobs lose money, now that's what I like to hear
A Forex website with 120,000 subscribers at the time (mostly FX traders) surveyed in 2020 3,127 Forex traders from 32 countries.
97% of respondents trade Forex, 43% Gold, 24% stock indices, and 9% cryptocurrencies.
Half of users surveyed are 25 to 34 years old, mostly men, and 1 in 4 is 35 to 44. Roughly consistent with other stats, a bit younger.
72% of the Forex traders surveyed are fresh noobs, they had no previous experience before FX.
The retail "traders" surveyed are a tad bit delusional, as 50% of Americans, 59% of Asians, 44% of Europeans, 42% of Oceanians and aye aye aye 100% of Africans think they can achieve more than 5% monthly returns. Between 1 in 2 and 1 in 3, and even 88% of Africans, think they can make more than 10% monthly.
Typical stats: 53% have been trading for less than a year, I assume those are the "5% to over 10% monthly" types?
39% have been trading for 1-3 years, 7% for 4-10 years, and 1% for more than 10.
The success rates (I believe this is self-reported):
Conflicting evidence: Run for your lives! Forex is an evil scam!
This may sound like an exaggeration, but I have the video.
A lady from the french regulator, on television, was screaming "YOU HAVE TO FLEEEE FOREX DON'T YOU GET IT. R.U.N. A.W.A.Y!!!"
In the AMF report "Étude des résultats des investisseurs particuliers sur le trading de CFD et de Forex en France" they come up with scary stats.
Close to 90% of traders lost money in the 2009-2012 period, and even the more experienced ones that traded for the entire period (48 months) lost money at 87.56%.
They have a graph "losses by leverage" but nowhere on that graph is indicated leverage...
And of course there is no distinction between day gamblers and the rest, as their goal is to scare people away.
You cannot say I am biased towards defending Forex, you know how much I LOVE watching noobs break their teeth.
Honestly, this doc is pretty bad, and just pointless fearmongering with nothing to learn that we don't already know (90% lose money).
In a BOJ doc I saw that around 90% of individual "investors" were day gamblers. Explains why 90% lose money.
Ok so retail loses money when day trading I get it, but then how do institutional traders make money intraday? What is their secret?
Simple. They don't. That's the big secret.
There are other sets of data, like what FXCM did for us a few years ago, showing that traders with a risk to reward of 1:1 or more were greatly more profitable than bagholders with high winrate (3.12 times as much):
"Of the traders who traded 1:1 or higher risk-reward, 53% turned a profit; of those who didn't, 17% turned a profit."
Also they show 40% of their traders with 5:1 or less leverage make money, compared to 17% of the ones with > 25:1, and the ones that do make profit with this leverage probably only made a small deposit compared to their net worth.
For obvious reason you'll never hear from a broker the correlation between day gambling or not and profitability.
I heard from someone that worked at FXCM that they tried looking for an edge from their biggest losers, all that they found is they overtraded, this is again something you'll rarely hear from brokers for obvious reasons.
In the end all we can take out from all of this, is some win, most lose. There is at least some little improvement with experience.
"Intraday" Gamblers and leverage gamblers are gigantic losers that destroy the stats, as most of us I am sure already knew.
And as Locke and Mann (2000) show in a study "there is evidence that trading success is negatively related to the degree of loss realization aversion."
Might also want to add: Be a one trick! Warren Buffett is one big fat OTP that only value invest in blue chip US stocks in sectors he understands.
1 market. 1 strategy. And he is doing rather well unlike all the loud mouths with zero life medals that say he "misses out".

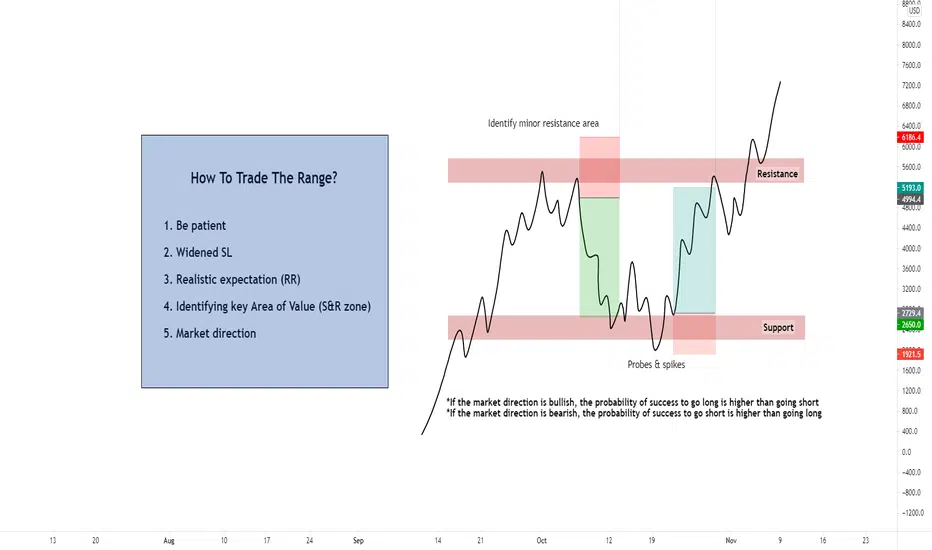
Simplify Your Range Setups - How To Trade It?Hi Traders, today's topic regarding " How to simplify range setups? " If you are someone who's constantly giving back profits during range bound condition, this post is dedicated for you. Majority of traders are able to make money during trending condition, but only to watch huge chunk of their profits peeled off during a choppy/ range bound condition. These are few of the simple steps to improve your ability to trade the range safely.
1. Be patient
Majority find range bound condition difficult to trade due to the lack of patience. There's no way you'll be able to identify a range without giving it time to develop. When the market is experiencing some volatility contraction especially after a strong trend, it is a precursor telling you probably you need to take a step back. Give the market enough time to develop a clear structure, it will improve your decision making process. Avoid having the sense of urgency to get involved.
2. Widened SL
To trade the range safely, you must widen up your Stop Loss to prevent probes & spikes. Unlike any textbook range condition, a range bound condition in the live market contains plenty of fakeout. By widening your SL, it provides some cushion for your range setups to breathe and allow you to have a calm state of mind. Because once you get stopped out with a widened SL, it signals you probably the range condition is coming to an end.
3. Realistic expectation (RR)
Majority tend to ' predict ' the break rather than respect the market. Avoid having some unrealistic expectation if the market itself is presenting a tighter range. If it is a 50 pips range, by having a 100 pips target you are enforcing your personal will & expectation into the market. By doing so, you would always see some of the great range setups turning against you.
4. Identifying key Area of Value (S&R zone)
During a range bound condition, it's vital to spot key S&R zones and ignore the minor ones. The only Area of Value for range setups area is S&R zones, if you're trading a continuation pattern (Eg. flag) within a range, most likely it might fail.
5. Market direction
By identifying the market direction, you are improving the probability of success . Think about this logically, If the market had a prior bullish impulse, the probability of success to go long is higher, because buyers' are in control, the probability of market breaking above the range is greater too, vice versa.
Comment down below what's your worst experience trading the range!
"Trade what you see not what you think." - Warren Buffet
Trade safe as usual.
Do follow my profile for daily fx forecast & educational content.
Who makes money playing the markets directionally?> Retail & Day Gamblers: Absolutely no one day gambling profitably has been found to this day, and we keep looking for them.
There might be a handful of DAX & Dow Jones traders that make some money, I don't think they outperform the indices.
Compare day gambling to regular predation: Ever heard of an apex predator going for tiny prey over and over?
Tiger goes for prey at the bare minimum 10% of its size, up to 10 times its size. Also a tiger has a winrate of 5-10%.
Same for polar bears. High risk reward is universal. The exception would be grizzlys that found a niche with salmon jumping in their mouths.
The hyper massive apex predator going for small prey would be blue whales: They go for lots and lots at once, like a quant fund, not like a day gambler.
Traders at banks that have some liberties and hold some positions have an exposure limit at the end of the day. They can't hold Citibank with 10 billion usd just because they want to for example. Intraday they execute orders for clients and you can't stalk them non stop so they have some liberties during the day. So to go around their limits, because they all think they are the wonderboy who will be the next Jesse Livermoore if only the bank would give them their chance, they day gamble. As long as at the end of the day their exposure is below the limit all good. Wonderboys... One of these legends is Jerôme Kerviel. He didn't even day gamble he wanted to make big money so he cheated the system to hide his exposure. And lost 5 billion. Well that's what the bank said, and the government that sent them a big check of taxpayer money never bothered to audit them.
Needless to say to this day humanity has not found a single institutional day gambling wonderboy that makes money. It's like looking for life on Mars.
In Forex at least 90% of retail "traders" are day gamblers. In stocks a part of retail is made of passive holders, of course hedge fund clients, ETF too, and then there are lots of bagholders chasing the worst possible investment and holding to zero, and lots of day gamblers too. Retail investors in FX have a success rate of close to 0%, and in stocks passive holders underperform the indices at about 99%, retail stock day gamblers either lose money (~95-99%) or underperform the indices.
At any given time ~75% of FX retail loses money but this is taking all the ones lucky in the short term plus doesn't account for turnover (winners stay longer).
Overall in FX at least 95% of retail will lose, but when you know they almost all day gamble, sometimes with "EA and robots", you are not surprised.
The ones that do not day gamble hold losers for ages and get out of winners asap, just check brokers retail positions. At least 80% do this.
No day gambling and not holding losers is not even step 1. I would call it step 0. In nature not a single predator holds losers. Videos of predations show almost only the success, but pay attention they'll say "this tiger hasn't made a kill in 4 days" and also sometimes show them "losing", these top predators give up so quickly I am amazed, they ambush, jump, and if the prey starts running away immediatly the hunter just doesn't even try. It's like a law of the universe: losers insist on holding losers. That simple.
If speculating had an elo then 95% of retail would have 200 elo, being naturally bad and then add all the bs thrown around the internet and the scams... ==> 200 elo.
They're just that bad. Don't even have the nuts and common sense to cut losses which is not even a goal to have it's not even a step. Herbivore prey instinct.
Remove all the extremely bad trolls and then it's just a regular business the ropes of which you have to learn. You just can't fix stupid I guess?
> Hedge funds: They are (very) public, we hear about them most.
Stocks versus Forex: They all go into stocks, in the US there has to be maybe 10 funds dedicated to FX, and their phone never rings. Investors think stocks are magical money machines, they have all sorts of stereotypes about FX the "negative sum game", and also think stocks are better because they can be more diversified with a portfolio of 100 stocks that are all correlated.
You can add quants, arbitrage, and all sorts of strategy denominated funds we hear about in here I guess.
Most hedge funds mainly hold stocks to make their clients happy, and will do a bit of everything.
Even Warren Buffett had a position on USDMXN a few years ago.
1 "different" hedge fund we heard about in 2018 was legend manager James Cordier.
He had a good 100 leverage on volatile commodities.
You can't say "we never hear of these guys", he had a public fund like all hedge funds, and he even posted ideas on an investing website (I think he did so for 15 years).
1 client with a $1MM account with the guy linked his positions:
NatGas, Crude Oil, Gold, Silver, Soybeans, ICE Coffee.
JC had positions on dozens of contracts for each of these, on only a 1MM portfolio.
> Private equity, family office, venture capital, and individuals you never hear about:
Michael Burry started being heard about when 25 or 30 years ago he was posting stock picks on a forum. But he really got famous when he did "the big short". His clients were so mad with him after he made money, I think it is why he decided to leave and start his own thing. I am not sure exactly as I heard his positions were public.
There is a private equity guy that posts about economics & geopolitics on a social network, I forgot the name, he manages the money of a single billionaire.
Recently we heard about Bill Hwang, another legend. We heard about him because he got liquidated and crashed certain stocks he had massive positions in. Prior to that he started working for an institution, left with a few millions, started his own private business, and turned those millions into billions making 60% a year. Too concentrated and leveraged, he got too big, if he was smaller he would have gotten out without problem. Should have thought about it.
You also have some politicians that make record profits... I have an idea on how they make these profits.
Clearly they are the ones generating the highest returns. Note that none of these individuals are doing any day gambling.
> Pension/mutual funds, sovereign funds, etc:
They are running safer, more passive strategies so no one really cares. We care when Norway says they are going to sell 500 million krona, or when China says they're going to dump 1 billion usd on the market.
Other
Corporate for example. They simply buyback shares with their profits.
I think that's it. If you have something to add let me know. We could add funds of funds if we wanted to. What else? That's it pretty much.
60% a year for Bill Hwang is pretty great, too bad he didn't take it easy when he got very big.

Trade: No, Maybe or Yes!!There are 6 (six) boxes of 4 hour (candlesticks) per day- best times to trade our at end of Tokyo to end of London- related to liquidity and volume.
Please look at hourly chart for more details- convert times to your location.

The Golden Rule of TradingOne of the fundamentals that every trader must know is how to evaluate the effectiveness of his trading methodology. In this article, we will explore core trading fundamentals that you must follow in order to survive and thrive in this business.
1. Never open a position without knowing the initial risk that you are willing to take. The initial risk is the point at which you will get out of the position to preserve your capital.
Very few people have the psychological makeup to keep a mental stop loss and respect it 100%, that’s why for the rest of us, there is the stop-loss that will automatically close our trade for us at a certain level.
2. Define your profit and loss in your trades as multiples of your initial risk.
These are the R multiples. If your risk is $1000 and you make $3000, you have a 3R win. If your risk is $1000 and you lose $1200, then you have a 1.2R loss. You must start to think in terms of risk/reward.
3. Limit your losses to 1R or less. If you don’t respect the stop loss that you have set and let a losing trade run then you are in real trouble.
This mechanism produces 4R losses or larger and can turn your great system into a losing system very easily.
4. Make sure that your profits, on average, are larger than 1R. Let’s say you have one 5R profit and four 1R losses.
If you add those up you have 5R in profit and 4R in losses, a net gain of 1R. Even though you lost money 80% of your trades, you still made money overall because your average gain was big. This is the power of having an average gain larger than 1R.
What is typically known as the golden rule of trading is a summary of these 4 rules:
“Cut your losses short and let your profits run.”
Here we are talking about doing your best to make sure your losses are 1R or less and that your profits are much bigger than 1R. In 2002, the Nobel prize for Economics was awarded to Daniel Kahneman, a psychologist and economist Amos Tversky for their development of “prospect theory”. This theory when applied to trading/investing showed that people have a natural bias to cut profit short and let their losses run, exactly opposite to the golden rule.
5. Understand your trading system in terms of mean (the average R) and the standard deviation (variability in the results) of your R multiples.
Your system, when you trade it, will generate a number of trades. The result of those trades can be expressed as a multiple of your initial risk or a set of R-multiples. You should know the properties of that distribution for any system that you plan to trade. And the majority of the people who trade the markets never know this. If you spend some time and calculate the mean and the standard deviation of your R multiples, you’ll know a lot about your system and what can you expect from it in the long run.
Trade with care.
If you like our content, please feel free to support our page with a like, comment & subscribe for future educational ideas and trading setups.

ACCUMULATION WYCKOFF ON EJIt is detailed wyckoff accumulation on EURJPY on 30 min TF. Remember price is fractal so you can find it on multiple TF.

Introducing The Satoshi All Time History IndexStarting today you can chart, follow, and research the price of Satoshis going back to 2010. Our new index is called Satoshi All Time History Index.
Satoshis, or sats, are the smallest unit of bitcoin (BTC). 100,000,000 satoshis make up one Bitcoin.
Satoshis are particularly important to the Bitcoin community because transaction fees are often measured as satoshis per byte or satoshis/byte. This makes the unit important to chart, follow, and analyze in detail. In addition, some people see sats as a useful way of addressing unit bias – where people prefer whole units over a fraction of a unit.
To get started with our new index, type SATSUSD into the search box and select it from the list. You can also bookmark the SATSUSD symbol page or share the link where needed.
We hope everyone enjoys this new addition. Please leave any comments or questions below.
Thanks for reading!

Always trade in the direction of the Momentum !Who goes long for a share when its bearish? Do you sell your shares if trend is bullish? how can one understand the status of a stock?
One of pillars of successful trading is to trade in the direction of the momentum. of course it is not guarantee your success in all trades but it is definitely a must thing to consider and is necessary for a good trade.
There are some indicators which show the momentum of the market among which " STOCHASTIC" and " STOCHASTIC RSI" can be mentioned.
Simply the momentum is bullish if fast line ( Blue in stochastic indicator) crosses slow line( Red in stochastic indicator) upward and Momentum is bearish if fast line crosses slow line downward.
It is OK to go long if Momentum is Bullish and is OK to go short if it is is bearish. 2 bullish reversals are shown in the chart which show a good point to buy shares . One Bearish reversal is also shown which indicates a good time to go short.
Bullish and bearish reversals in oversold and overbought zones are more powerful. when both fast and slow lines are in oversold zone ( below line 20) it tells us that down side should be very limited. if both lines are in overbought zone ( above line 80) we can expect a near bearish reversal.
Combination of this concept with Elliott wave patterns and Fibonacci levels can give you a powerful tool which is beyond the scope of this post . A simple and elementary example is shown in the TSLA chart which a bearish reversal coincides with 0.618 Fibo retracement and descending trend line.
My strong recommendation is just simply put away those ideas which encourage you to go long when momentum is bearish or (bullish but in overbought zone) and vice versa.
Good Luck in your trades

Trading Conviction: Missing Ingredient“How did you hold that winner for so long?” “How did you hold through that big move against your position?” “Why did you take so much size?”
Conviction is what allows you to have big, home-run trades that make your whole trading year. It keeps in winning trades even when things look uncertain. This is what separates amateur traders from pro traders. Learn how to build this in your trading:
What is Trading Conviction?
Conviction is defined as “a firmly held belief or opinion”. In the trading world, you will often hear traders say “that was a conviction trade”. Conviction trades are ones taken with large size, and are often responsible for the bulk of your PNL at the end of the year.
One of the most important characteristics of great traders is sizing big when the odds are in their favor. Not sizing big on your high probability setups is like betting small when you have pocket Aces in Texas Hold’em. You won’t be able to win in the long run if you don’t maximize profits on your high-probability setups. Capitalizing on winning trades is just as important as keeping losing trades small.
Knowing the Probabilities
To have a conviction on a trade, you need to have an accurate estimate of the probability of the trade becoming a winner. So where does conviction come from? Having a defined trading strategy. This means you have defined what type of Forex you trade, when you trade them, what constitutes buy and sell signals, and you have rules to protect yourself from your weaknesses.
You cannot have conviction if you don’t have a proven system you know has an edge. A lot of traders assume the effectiveness of a strategy by just what happened on the last few trades. You need to have a large sample of trades to determine a system’s effectiveness. If you don’t know how the trade SHOULD pan out, you won’t be able to ride the bumps on the road to your target (s) with big size.
“Competence breeds confidence”. Conviction is derived from confidence, and confidence comes from having a DEFINED strategy with an edge. Psychology does play a role as well of course, but the base of all successful trading comes from knowing what you should be doing during the trading day, and more importantly, what you shouldn’t be doing. And the only way to know this is to have a system and rules.
Differentiating Between Conviction and Stubbornness
This is where many traders go astray. They let their convictions prevent them from cutting a losing trade before it gets out of hand. Even on high probability trades, there is always a chance of them turning into a loser. “A conviction trade” results from trader completely accepting possibility trade could be a loser, thus eliminating fear.
Trading losses are just business expenses: Change the perspective of your trading." Trading is a business. Just like any business owner or entrepreneur, traders have expenses, frequently these expenses come in the form of losses." View losing trades as price you pay to find out if trade would be a winner.
Study Your Best Trades EVERY Day
Your brain needs to see the same setup play out over and over again to build conviction. Just like an athlete trains every day, you as a trader need to train your brain every day. Study best trades over and over again, and remind yourself how they usually play out so you can take big size on them. What you can do is after you run morning scans and build watch list, go back and study past names with similar setups, and remind yourself how they typically play out.
Summary
There are many factors that cause a trader to have or not have a conviction. Experience is a big one that I didn’t mention. But I think it all comes back to having a system with an edge, and taking the time to study past charts and scenarios on a daily basis. Starting sound like a broken record: Study 1000 charts a day. Seeing the same patterns play out over and over again is how you build conviction in your trades.
Can you hold Forex trades for several months for your profit pip reward, like example weekly chart of USDCAD from 1.30000 to 1.20000 (1000 pips)?
Still going lower at this time... maybe for rest of the month of May? With right risk management and plan you can- and increase lot size as trade profits.

Direction Easy✔️ Timing Hard ❌Hi Traders,
I think the analysis part of trading is the easy bit. By that I mean most traders usually have the correct direction in mind but timing is difficult. AUDJPY is a classic example. The analysis was simple. Price broke about daily resistance, retested it and I was looking for continuation. I entered the trade but price came back and took me out for a breakeven. Then, it continued it same direction I expected it to. Personally, I prefer to preserve my capital by going breakeven once in good profit and I do not even confident re-entering a trade if price retraces so sharp and took me out the trade.
1. How soon do you place your trade at breakeven once it is in profit?
2. Do you re-enter a trade is it took you out at breakeven and show signs of following your original trade idea?
Comment below.

2% Max LossMoney Man has not seen the need to adjust his levels as he still stands with his original idea that ETH needs to break a pattern, clear as day on the chart, to get buyers over the fatigue. The short term trendlines are telling us this and has proven themselves as guiding pattern formation. Logic thus would change the top of Decision 1 and bottom of Decision 2 to keep these lines inside it as we go.
So, he is taking this time to expand more on his ideas around risk. We all have heard about the Kelly Criterion, but also about the 2% rule (cap your losses at 2% of total allocation – the total you have allocated to trade in a particular instrument like ETH).
He would classify the Kelly Criterion as an advanced risk management tool, hard to pin down within so much variance that a market has. Advanced, you say? Then that must be what a new trader should use! Not so fast. New and even older hands typically calculate their acceptable risk before admitting defeat on a trade, via back testing. Here lies the rub as more important than; the “past results do not guarantee future results” understanding – there is the lack of experience in relation to their own emotional tolerance to red. You know: the old “close winners fast and let loser run” outcome.
Money Man has written about the well-known break-even parabolic horizon a long time ago and link that below. He mused then that that parabola is what sinks even brick and mortar businesses. Now he wants to give his thoughts on the 2% (used in this explanation – but could be more or less) risk to total allocation. There is another parabola hidden here (in red) and finding your sweet spot is the goal. So, your sweet spot would depend on your tolerance to loss (percentage) and its relationship to the chart / price action (distance on chart in percentage).
Many traders simply trade with their whole allocation and thus sit at the far left grey bar (100% of allocation in) and far left of the parabola, forced into a 2% below entry price stop loss placement. The other extreme is a trader who only uses 2% of their allocation on any trade to trade with and have no need for a stop loss if they believe in the 2% rule. There is the option to adhere to the 2% rule and adjust your position size according to where you would like to put your stop loss. The graph above tries to give a quick reference rule of thumb and illustrates how the distance of your stop loss parabolically grows the smaller your position size. Back of an envelope math but soothing to the adrenal glands if you can find your own sweet spot.
Where does the whole 2% rule come from? Money Man does not know for sure but knows that it has been around for a long time and has thus been discussed and “peer reviewed” extensively. Also, and more importantly, it speaks to another reality in the antifragility of staking your options in your favour while keeping your risks in check – an advantage you can still reap even if the percentage is too low for your liking. The reason for including it is that it could be a bridge between “betting 100% on every trade” and having a very well-developed dynamic trade size to stop loss placement distance dependent on market conditions.
Please double check the math that went into the above graph before use. Remember there are no guarantees, only probabilities. Very Important to me: Please like if you appreciate the effort, Please comment and develop this further and Please follow if you see this analysis thread going somewhere you would like to know about.

11 Rules for the Ordinary Trader
Through your trading carrier, you will learn to develop your own paths and ways to become successful in your own way, but there are many things that will give you a boost of knowledge in your trading carrier. Down bellow lists 11 different rules I have gathered from many sources.
Rule 1: Price has memory.
What happened the last time a stock hit a certain level? Chances are it will happen
again. Watch trades closely when price returns to a battleground. The prior action can
predict the future.
Rule 2: Profit and discomfort stand side by side.
Find the setup that scares you the most. That’s the one you need to trade. Don’t
expect it to feel good until you take your profit. If it did, everyone else would be
trading it. Wisdom from the East: What at first brings pleasure in the end gives only
pain, but what at first causes pain ends up in great pleasure.
Rule 3: Stand apart from the crowd at all times.
Trade ahead, behind or contrary to the crowd. Be the first in and out of the profit
door. Your job is to take their money before they take yours. Be ready to pounce on
ill-advised decisions, poor judgment and bad timing. Your success depends on the
misfortune of others.
Rule 4: Buy at support. Sell at resistance.
Trend has only two choices upon reaching a barrier: Continue forward or reverse. Get
it right and start counting your money.
Rule 5: Manage time as efficiently as price.
Time is money in the markets. Profit relates to the amount of time set aside for
analysis. Know your holding period for every trade. And watch the clock to become a
market survivor.
Rule 6: Don’t confuse execution with opportunity.
Save Donkey Kong for the weekend. Pretty colors and fast fingers don’t make
successful careers. Understanding price behavior and market mechanics does. Learn
what a good trade looks like before falling in love with the software.
Rule 7: Control risk before seeking reward.
Wear your market chastity belt at all times. Attention to profit is a sign of immaturity,
while attention to loss is a sign of experience. The markets have no intention of
offering money to those who do not earn it.
Rule 8: Big losses rarely come without warning.
You have no one to blame but yourself. The chart told you to leave, the news told you
to leave and your mother told you to leave. Learn to visualize trouble and head for
safety with only a few bars of information.
Rule 9 : Enter in mild times, exit in wild times.
The big move hides beyond the extremes of price congestion. Don’t count on the
agitated crowd for your trading signals. It’s usually way too late by the time they act.
Rule 10: Perfect patterns carry the greatest risk for failure.
Demand bruises on your trade setups. Market mechanics work to defeat the
majority when everyone sees the same thing at the same time. When perfection
appears, look for the failure signal.
Rule 11: See the exit door before the trade.
Assume the market will reverse the minute you get filled. You’re in very big trouble
when it’s a long way to the door. Never toss a coin in the fountain and hope your
dreams will come true.
Yours truly,
Jacob Schildcrout
**Note, I dont take credit for these rules, these have been gathered from sources for your convenience***

3x ETF SOXL vs other 1x semi ETFs over various time horizonsI compare SOXL returns with SOXX, SMH, and PSI, all ETFs in the semiconductor space.
CONCLUSIONS AND FINDINGS:
YTD 2021 SOXL has not provided any net benefit over it's peers. And if you use stop loss orders you've probably lost money on it due to its extreme volatility. Smaller quant ETF fund PSI is the better performer on most/all time horizons YTD or more recent, especially from a risk/reward perspective. Only when comparing SOXL against the others on a time horizon of 1 yr or longer does SOXL outperform it's peers.
Importantly however, charts mimic real life only to the extent we make the purchase the entire position at once and don't touch it over the entire time frame. But this is not what most traders do. Thus, I recommend holding SOXL only if you're going to buy it and not set any stop loss orders, touch it, trade it, or even look at it for a year or more. But you probably can't handle that. I can't either. Thus the better, more realistic strategy for most traders is to get PSI or one of the other primary ETFs covering this space.

How to Trade Price Action Daily!Hello Fellow Traders, Here is a Educational Video (How to Trade Impulse/Correction/Impulse) .
Key things to Remember:
When Trading This Type Of method - You Should Always have an Open mind when it comes to "Where the Market will Finish The correction"
The Strongest Levels of Fibonacci is the 61.8 & 38.2 (These Are Generally the levels that the Market Loves to Finish its correction)
The Best way to follow This Method is if the following conditions apply.
Conditions -
1. Look & Find a Big Impulse On bigger Timeframes (Weekly, Daily or 4Hours)
2. Wait for The Market to Finish its Impulse (You will notice the market starts to move the opposite direction to the original Impulse)
3. Pull Your Fibonacci From The Start Of the Impulse to the End of the Impulse Aka ( From high to low = Sell OR Low to High= Buy)
4. Be Patient and wait for the Market to Reach the Aka Strong Levels (61.8 Or 32.8) OR Which Ever is Better Align With Good Structure!
5. Once you Have a smaller Timeframe break of structure or Momentum Change (You will look for an Entry Based on Market Environment + Structure)
6. Enter Your Trade Preferably of 1hOur Or 4hour Timeframe (whichever has given confirmation mentioned in point 4)
7. Always Use Risk Management / 1% Risk to Trade Entries using this Method
8. Patience is the Key to Success!
Let Me know if you have any Questions or Comments Below!
Your Support Is Appreciated!
Happy Trading & Goodluck!
See You in the Next Educational Video!
Global Fx Education
