Is Bitcoin Still a Hedge? What the Iran Israel Conflict RevealsAs geopolitical tension between Iran and Israel escalates, markets are once again gripped by fear. Oil prices have surged, gold has rallied, and investors are rebalancing portfolios in anticipation of further instability. Amidst this backdrop, Bitcoin's behavior is raising fresh questions about its role as a geopolitical hedge.
Bitcoin’s Initial Reaction: A Spike and a Slip
When the first reports of conflict broke, Bitcoin spiked alongside gold. Many hailed this as proof that BTC was becoming a reliable safe haven. However, just days later, prices retraced by roughly 6 to 7 percent as volatility intensified.
As usual, Bitcoin is still highly sentiment driven. While gold held its gains, BTC mirrored risk on assets with intraday volatility, undermining its hedge narrative.
BTC vs. Traditional Safe Havens
Let’s compare Bitcoin’s performance to:
• Gold: Continued upward trend, record ETF inflows
• Oil: Strong rally due to supply shock fears
• USD: Moderate gains as a traditional reserve asset
Bitcoin’s pullback during peak uncertainty suggests that in times of extreme stress, traditional assets still dominate flight to safety behavior.
What the On Chain Data Shows
Interestingly, on chain activity also hints at caution. Exchange inflows increased slightly after the conflict news, suggesting profit taking or reduced conviction among holders.
Moreover, stablecoin volume spiked in Middle Eastern regions — a signal that users may prefer capital preservation over speculation during geopolitical risk.
The Takeaway: Not There Yet
Bitcoin is maturing, and its response to global events is evolving. But this conflict reveals it is not yet a full fledged hedge like gold or the dollar.
For investors, the lesson is clear: BTC can act as a partial hedge in medium term macro trends, but during sharp geopolitical escalations, traditional assets still lead.
What Do You Think?
Is Bitcoin still on track to become a true safe haven asset? Or will it remain a risk sensitive speculative instrument?
Trading Psychology

How to Trade the Forex Market on Memorial & Independence days?Trading the foreign exchange (Forex) market on major U.S. holidays like Memorial Day (May 29th) and Independence Day (July 4th) presents a unique set of challenges and requires a strategic shift from typical trading days. While the global Forex market remains technically open 24/5, the closure of U.S. banks and financial institutions leads to significantly reduced liquidity and trading volume, altering the market landscape.
Here’s a comprehensive guide on how to approach Forex trading on these holidays:
Understanding the Market Conditions: The "Quiet" Danger
The primary characteristic of Forex trading on U.S. holidays is a sharp drop in liquidity, especially in currency pairs involving the U.S. dollar (USD). With American traders and institutions away from their desks, the volume of transactions plummets. This "quiet" market environment can be deceptive and carries specific risks:
Wider Spreads: With fewer market participants, the difference between the bid and ask prices for currency pairs tends to increase. This makes it more expensive to enter and exit trades, eating into potential profits.
Increased Volatility and Spikes: Don't mistake low volume for a flat market. With a thin order book, even moderately sized orders can cause sharp, sudden price movements or "spikes." These moves can be unpredictable and may not follow typical technical patterns.
Price Gaps and Slippage: The reduced liquidity can lead to price gaps, where the market jumps from one price to another without trading at the levels in between. This increases the risk of slippage, where your order is executed at a less favorable price than intended.
Ineffectiveness of Some Strategies: Strategies that rely on high volume and momentum, such as breakout trading, are more likely to fail. A perceived breakout may lack the follow-through to become a sustained trend.
Strategic Approaches for Trading on Memorial Day and July 4th
Given the unique market conditions, traders should adopt a cautious and well-considered approach. Here are several strategies to consider:
1. The Prudent Approach: Step Aside
For many traders, particularly novices, the most sensible strategy is to avoid trading altogether on these holidays. The increased risks and unpredictable market behavior can easily lead to unnecessary losses. Consider these days as an opportunity to study the markets, refine your overall trading plan, or simply take a break.
2. Trade with Reduced Size and Realistic Expectations
If you do choose to trade, it is crucial to adjust your risk management:
Lower Your Position Sizes: This is the most critical adjustment. Trading with smaller lots will mitigate the potential impact of sudden price spikes and wider spreads.
Adjust Profit Targets and Stop-Losses: Be realistic about potential gains. The market may not have the momentum for large moves. Consider setting smaller profit targets. At the same time, be mindful that tighter stop-losses can be easily triggered by short-term volatility.
3. Focus on Non-USD Currency Pairs
Since the holidays are U.S.-based, currency pairs that do not involve the U.S. dollar may be less affected, although a general decrease in global liquidity is still expected. Cross-currency pairs such as EUR/JPY, GBP/JPY, or AUD/NZD might exhibit more "normal" behavior than majors like EUR/USD or USD/JPY. However, remain vigilant for lower-than-usual volume across the board.
4. Employ Range-Bound Strategies
In low-liquidity environments, currencies often trade within a defined range. Strategies that capitalize on this behavior can be more effective than trend-following approaches. Look for well-established support and resistance levels and consider trading the bounces off these levels.
5. Be Wary of News from Other Regions
While the U.S. market is quiet, significant economic data or geopolitical news from other regions (Europe, Asia) can still impact the market. With low liquidity, the reaction to such news can be exaggerated. Stay informed about the global economic calendar.
A Day-by-Day Look
Memorial Day (Last Monday of May): This is a major U.S. holiday, and its impact will be felt throughout the 24-hour trading period. Expect very thin liquidity during the Asian and European sessions, which will worsen significantly during what would typically be the busy New York session.
Independence Day (July 4th): The impact of July 4th can sometimes extend beyond the day itself. Often, the trading day before (July 3rd) will also see reduced volume as traders close positions ahead of the holiday. On July 4th, expect market conditions similar to Memorial Day, with a significant drop in activity and the associated risks.
In conclusion, while the allure of a 24-hour market is a key feature of Forex, wisdom lies in recognizing when not to trade with your usual strategy and size. Approaching U.S. holidays like Memorial Day and Independence Day with caution, a revised strategy, and a keen awareness of the risks is paramount for preserving your trading capital. For most, these are days best spent on the sidelines.
Navid Jafarian

From Congestion to Collapse: Understanding Distribution and H&S A Simple Lesson: How to Identify Congestion Zones in the Market — Schabacker’s Approach and the Head and Shoulders Pattern
⸻
👤 Who Was Schabacker?
🔹 Richard Schabacker was one of the pioneers who authored seminal works on technical analysis.
🔹 He lived over 90 years ago and served as Editor-in-Chief of Financial World magazine.
🔹 His most notable book is:
Technical Analysis and Stock Market Profits
🔹 Published around 1932 in the United States.
🔹 Schabacker is often considered the “grandfather” of technical analysis, and much of the methodology traders use today can be traced back to his insights.
⸻
🟢 What Did He Teach?
🔹 Schabacker introduced a critical concept:
✅ The Congestion Zone
🌟 What Does It Mean?
When the market makes a strong move—either a sharp rally or a steep decline—price often becomes trapped in a range:
• Buyers at higher levels wait for further gains.
• Sellers at lower levels expect more downside.
But in reality, retail traders aren’t moving the market. Large institutions and funds—the so-called smart money—are in control.
👈 When these big players want to exit positions, they avoid selling everything at once to prevent a sudden collapse in price and to avoid revealing their hand.
✅ Their Playbook:
• Keep price contained within a narrow band between support and resistance.
• Gradually increase volume over time.
• Attract new buyers who believe the trend is still intact.
• Quietly distribute their holdings without alarming the market.
🌟 Why Do They Do This?
If they were to dump all at once:
• Price would drop rapidly.
• Everyone would realize a large seller was active.
• Institutions would get stuck, unable to exit at favorable prices.
🔻 So They Create Congestion and Distribution:
1️⃣ Sell discreetly over time.
2️⃣ Maintain the illusion that the trend is healthy.
3️⃣ Trap latecomers who buy into the range.
⸻
🟢 How Do You Recognize This on a Chart?
🎯 A Simple Example:
• Price climbs steadily from 3,000 to 3,300.
• Suddenly, it surges to 3,450.
✅ Most traders think the rally will continue.
🌟 What happens next:
• Price stalls between 3,380 and 3,450.
• Numerous candles form in this area.
• Volume remains elevated.
🔥 Inside this range:
1️⃣ Institutions sell into every upward move.
2️⃣ Early buyers remain committed, hoping for new highs.
3️⃣ New participants enter, unaware of the distribution.
🔻 What Do You See?
• Repeated candles oscillating within the same band.
• Failed breakouts above resistance.
• Sustained high volume.
✅ This is the classic Congestion Zone.
⸻
💡 How Can You Tell If It’s Distribution, Not Accumulation?
• Persistent high volume indicates steady selling.
• Price struggles to make fresh highs.
• Long upper wicks signal selling pressure.
• A Head and Shoulders pattern may start forming.
⸻
🎯 What Happens After Congestion?
• Institutions complete their distribution.
✅ Price breaks sharply below the range.
✅ The market drops quickly.
✅ Late buyers are forced to sell at losses.
⸻
🟢 Practical Illustration:
Visualize the range like this:
| |
| The Range |
| |
3380 ————> Resistance
| Multiple Candles |
| Multiple Candles |
| Multiple Candles |
3300 ————> Support and Neckline
✅ If price breaks below 3,300 on heavy volume:
• The distribution is complete.
• Price declines rapidly.
⸻
📌 Key Takeaway:
After any strong move, expect congestion as large players exit. Once they’re done, the trend often reverses.
⸻
🎯 Quick Tips:
✅ Never rush to buy inside congestion after a big rally.
✅ Watch volume—if it’s high, it’s likely distribution.
✅ Wait for a clear breakdown before shorting.
✅ Your target should at least match the size of the preceding move.
⸻
🔥 Let’s Cover the Head and Shoulders Pattern:
✅ What Is It?
A reversal pattern appearing after a strong uptrend, signaling the end of bullish momentum.
⸻
✅ Pattern Components:
1️⃣ Left Shoulder:
• Price makes a high.
• Pulls back.
2️⃣ Head:
• Rallies to a higher high.
• Declines again.
3️⃣ Right Shoulder:
• Attempts to rise but fails to exceed the head’s high.
4️⃣ Neckline:
• Connects the lows between the shoulders and the head.
🔻 When the Neckline Breaks Down:
It’s a strong sell signal. The market often drops decisively.
⸻
💡 Example in Numbers:
• Price moves from 3,200:
1️⃣ Up to 3,350 (Left Shoulder)
2️⃣ Down to 3,300
3️⃣ Up to 3,400 (Head)
4️⃣ Down to 3,300
5️⃣ Up to 3,350 (Right Shoulder)
6️⃣ Down to 3,300
✅ If price closes below 3,300 on strong volume, the pattern is confirmed.
🎯 Target Calculation:
• Head = 3,400
• Neckline = 3,300
• Distance = 100 points
• Target = 3,200
⸻
🟢 How To Trade It:
1️⃣ Don’t preemptively sell during the right shoulder.
2️⃣ Wait for a confirmed breakdown.
3️⃣ Enter a short position targeting 3,200.
4️⃣ Set your stop loss above the right shoulder.
⸻
🟢 Final Advice:
✅ The Head and Shoulders is powerful if confirmed by volume.
✅ Always wait for the neckline break—otherwise, it could be a false signal.
✅ Keep monitoring volume for confirmation.
⸻
🔥 Be disciplined in your analysis and decisive in your execution.
🔥 As Warren Buffett said:
“The stock market is a device for transferring money from the impatient to the patient.”
⸻
If you found this valuable, let me know—I’d be glad to prepare more lessons. 🌟

Wait for your EDGE...
Discipline is what separates professionals from amateurs.
Stay patient. Wait for your edge. Let the probabilities work in your favor.
👉 “Agree with this? Hit Boost to spread the message.”
#TradingPsychology #Discipline #BTC #Bitcoin #Forex
#TradingMindset #AlBrooks #TradingDiscipline #PriceAction #ForexTrading #CryptoTrading #StockMarket #MJTrading #TradingQuotes #TraderLife #MindOverMarkets

XAUUSD Traders – The ONLY Timeframes That Matter🎓 XAUUSD Traders – The ONLY Timeframes That Matter
If you want to stop being a liquidity snack for the big players, you must know which timeframes actually reveal what the market makers are doing.
Here’s your complete educational guide for XAUUSD:
⸻
🔍 1️⃣ The 4-Hour (4H) – The Market Maker Blueprint
✅ Why Watch It?
This is where the real accumulation and distribution happens.
Market makers build and unwind positions over multiple sessions—London and New York.
If you want to see the big plan, this is your chart.
✅ What to Look For:
• Strong rejection candles near key resistance (3330–3350).
• Fake breakouts with no follow-through.
• EMA21 and SMA50 acting as dynamic resistance.
• High-volume candles marking where the big boys stepped in.
🎯 Tip: If the 4H chart is bearish, every bounce on smaller timeframes is suspect.
⸻
⏰ 2️⃣ The 1-Hour (1H) – Timing the Trap
✅ Why Watch It?
1H is perfect for seeing the moment the trap is set.
This is when price pumps into resistance or dumps below support—just enough to trigger stops.
✅ What to Look For:
• Quick rallies on low volume (pump phase).
• Reversal candles forming right after a breakout.
• Delta flipping negative as price pushes higher (hidden selling).
🎯 Tip: Combine 4H structure with 1H confirmation—this is where precision timing happens.
⸻
🎯 3️⃣ The 15-Minute (15M) – Entry Execution
✅ Why Watch It?
15M shows micro-structure and liquidity hunts.
This is where you confirm whether that big 1H candle was real—or just a head fake.
✅ What to Look For:
• Sharp wicks that stop out traders (liquidity flush).
• Tight consolidation after a failed breakout.
• Rejection patterns before price reverses.
🎯 Tip: Use the 15M to pull the trigger—not to overthink.
⸻
📅 4️⃣ The Daily – Bias Confirmation
✅ Why Watch It?
Daily sets the macro tone.
You must know whether you’re fighting the bigger wave.
✅ What to Look For:
• Where price closed relative to EMA21 and SMA50.
• Big bearish engulfing candles.
• Volatility expanding or contracting.
🎯 Tip: If daily is bearish, you have extra confirmation to fade pumps.
⸻
⚔️ How to Combine These Timeframes
Here’s the professional workflow:
1️⃣ Daily – Define bullish or bearish bias.
2️⃣ 4H – Spot the setup zone (accumulation or distribution).
3️⃣ 1H – Watch the trap unfold.
4️⃣ 15M – Execute your entry with surgical precision.
✅ This is how you stop chasing noise and start trading structure.
⸻
💡 Pro Wisdom:
“Retail traders react to price. Professionals react to price and context.”
— Technical Analysis and Stock Market Profits
⸻
🚀 Trade smart. Study structure. Outsmart the herd.
#XAUUSD #ForexEducation #PriceActionTrading #MarketMakerSecrets #LearnToTrade

XAUUSD Market Maker Playbook – Learn How the Game Is Rigged🎓 XAUUSD Market Maker Playbook – Learn How the Game Is Rigged
Traders—if you think this market is some pure, fair supply/demand mechanism, you’re getting played.
Market makers run sophisticated pump and dump cycles designed to trap you.
Today, I’m going to break down exactly how they do it, so you can start trading like a sniper, not a sheep.
🔍 Understanding the 3 Manipulation Zones
🟢 GREEN ZONE: Accumulation Range (3286–3300)
Purpose:
Market makers quietly build positions.
They create an illusion of neutrality—small candles, tight ranges.
Signs:
Repeated tests of the same level.
Volume stays steady (not exploding).
Wicks in both directions (so nobody knows who’s in control).
🟡 YELLOW ZONE: The Pump Phase (3300–3330)
Purpose:
Trigger breakout traders.
Induce FOMO buying.
Clear out short stops above the range.
Signs:
Quick impulsive candles with LOW RELATIVE VOLUME.
Price blows through resistance but struggles to hold.
Social media and news start calling “Bull Run.”
🔴 RED ZONE: Distribution & Dump (3330–3350)
Purpose:
Offload large positions into retail buying.
Leave traders trapped at the highs.
Signs:
Spikes of huge volume as price stalls.
Rejection candles (long upper wicks).
Big delta shifts negative (sellers hitting bids hard).
⚔️ How the Market Maker Sequence Works
Here’s how the trap gets set:
1️⃣ Accumulate in Green Zone
Build inventory while convincing everyone “nothing is happening.”
2️⃣ Pump into Yellow Zone
Push price up just enough to trigger momentum traders.
Keep volume deceptively low—so it looks sustainable.
3️⃣ Sell in the Red Zone
Dump big positions into the buying frenzy.
Flip the tape bearish—fast.
Watch as the herd gets stopped out or bag-held.
🎯 Tomorrow’s Possible Plays
✅ Scenario 1 – Classic Pump & Dump
Phase 1: Grind in 3286–3300.
Phase 2: Spike to 3335.
Phase 3: Dump back to 3260.
✅ Scenario 2 – Fake Breakdown Reversal
Phase 1: Slam price to 3250, triggering panic selling.
Phase 2: Accumulate aggressively.
Phase 3: Rip price back to 3320, trapping shorts.
✅ Scenario 3 – Slow Grind Liquidation
Phase 1: Drift up in low volume toward 3330.
Phase 2: Distribute over several hours.
Phase 3: Liquidate longs into NY close.
📚 How YOU Can Spot This Manipulation
Here’s your checklist—save this:
✅ Volume vs. Price Analysis
Big price moves WITHOUT proportionate volume = FAKEOUT.
Big volume at tops/bottoms = Institutional distribution or accumulation.
✅ Delta Confirmation
Positive delta = buyers aggressive.
Negative delta = sellers slamming bids.
Watch for divergence (price up but delta down = hidden selling).
✅ Candlestick Clues
Rejection wicks.
Engulfing candles at key zones.
Multiple failures to break past a level.
✅ Timing
London open and NY open are prime manipulation hours.
Thin liquidity in Asia can exaggerate moves.
💡 Pro Tip:
“The crowd chases price. The professionals track volume, delta, and timing.”
— Technical Analysis and Stock Market Profits
🚀 Stay sharp. Think like a market maker. Trade like a predator.
#XAUUSD #MarketMakerEducation #ForexTrading #PriceAction #LearnT
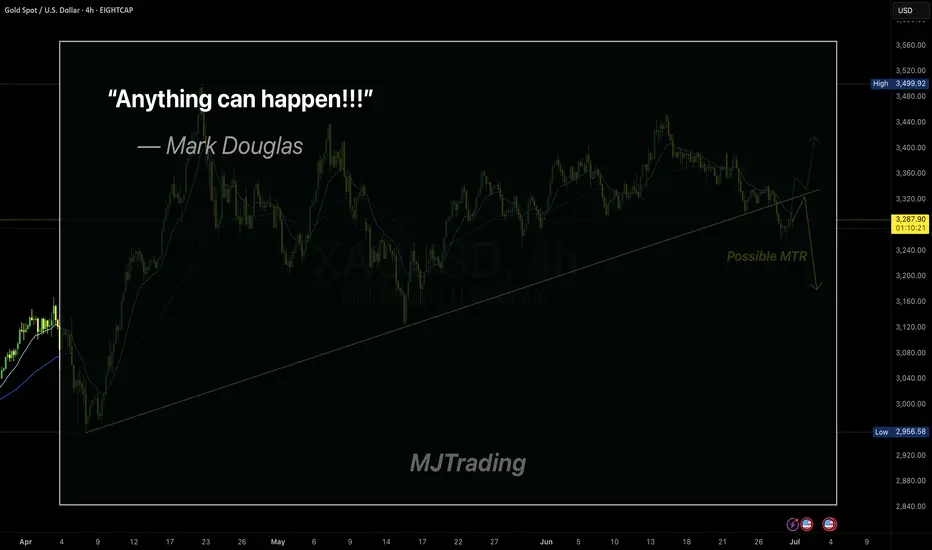
Embracing Uncertainty
In trading, the illusion of certainty is often our biggest enemy.
Even the cleanest setups—like a MTR (Major Trend Reversal)—can fail.
Mark Douglas said it best:
“Anything can happen.”
This simple truth is what keeps professional traders humble and disciplined.
Respect the market, manage your risk, and never assume you know what comes next.
Stay sharp.
#MJTrading
#GoldTrading #XAUUSD #TradingPsychology #AnythingCanHappen #MarkDouglas #ForexMindset #TradingQuotes #PriceAction #RiskManagement #MindOverMarkets #ChartOfTheDay #MJTrading
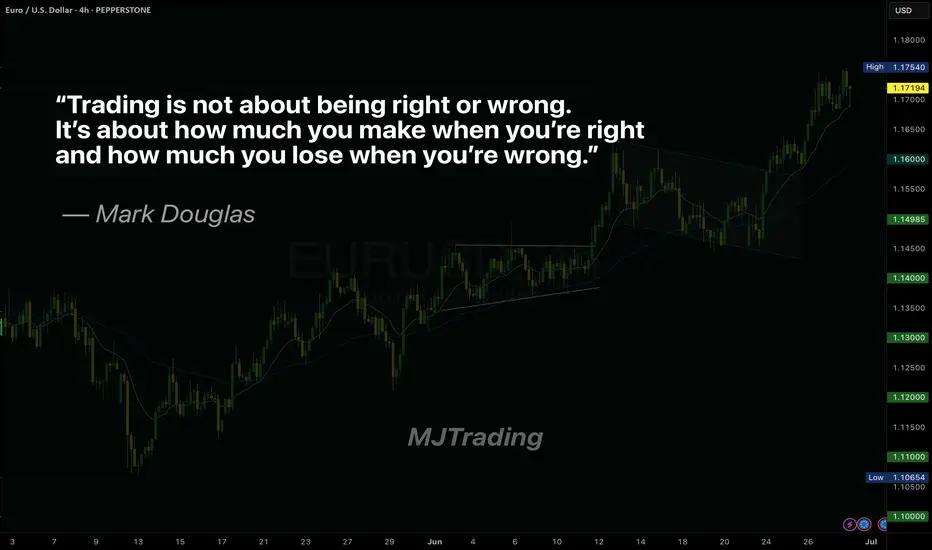
Master Your Edge: It’s Not About Just Being Right
Most traders obsess over being right on every trade. But the truth is, consistent profitability doesn’t come from perfect predictions—it comes from disciplined risk management.
Mark Douglas reminds us:
“Trading is not about being right or wrong. It’s about how much you make when you’re right and how much you lose when you’re wrong.”
Focus less on proving yourself right, and more on protecting your capital when you’re wrong. That’s how professionals thrive in uncertain markets.
#MJTrading
#TradingPsychology #MarkDouglas #ForexMindset #TraderMindset #EURUSD #TradingQuotes #ForexLife #RiskManagement #TradingDiscipline #ForexEducation #ChartOfTheDay #PriceAction #MindOverMarkets
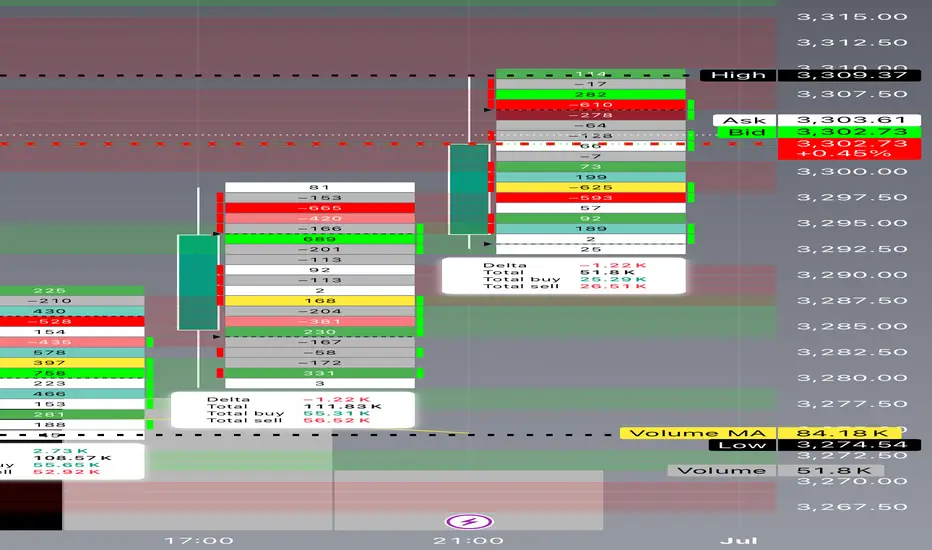
Mastering Delta–Volume Divergence
🎓 Mastering Delta–Volume Divergence: How to Read Institutional Absorption and Trap Setups
⸻
1️⃣ What Is Delta?
Delta measures the net aggression between buyers and sellers:
• Market Buys: traders lifting the ask
• minus
• Market Sells: traders hitting the bid
✅ Positive Delta indicates stronger buying pressure.
✅ Negative Delta indicates stronger selling pressure.
Delta shows who is initiating trades, not just that trading is occurring.
⸻
2️⃣ What Is Volume?
Volume measures the total number of contracts traded, regardless of who initiated them.
Every matched buy and sell contributes equally to volume.
Volume reveals activity, but not who controls the move.
⸻
3️⃣ What Is Delta–Volume Divergence?
Delta–Volume Divergence occurs when:
✅ Volume is high (lots of trades happening),
✅ But Delta is near zero (neither side dominates).
This signals:
• Intense two-sided activity between buyers and sellers,
• Strong participation on both sides,
• Passive absorption—institutions quietly filling large orders without moving price significantly.
⸻
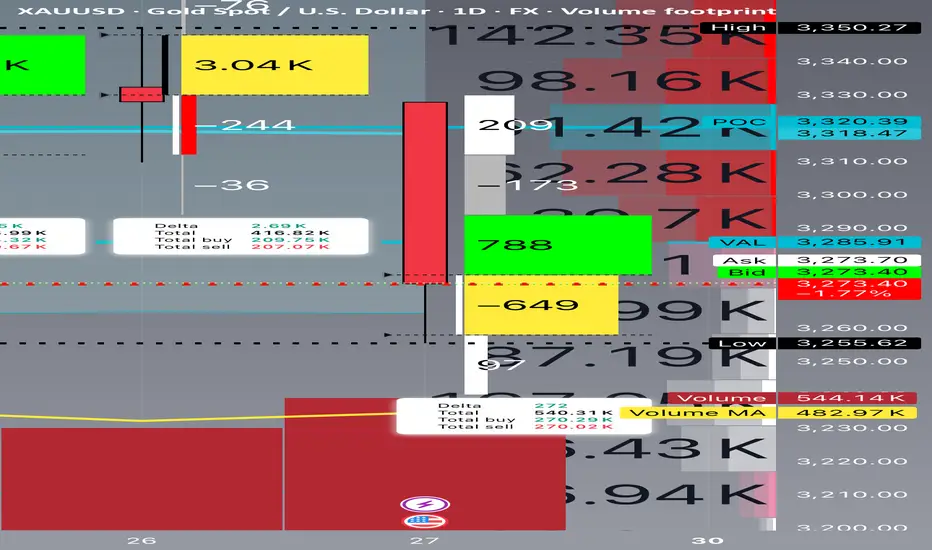
4️⃣ Chart Breakdown – Bar by Bar
Below is a clear example of this concept in practice, reviewing each daily bar from your footprint chart:
⸻
🔴 June 24
• Delta: -8,240 (strong net selling)
• Volume: 575,720 (very high)
• Interpretation:
• Heavy, aggressive selling.
• Clear trend-confirming action.
• No divergence.
⸻
🟢 June 25
• Delta: +4,650 (net buying)
• Volume: 343,990 (moderate)
• Interpretation:
• Counter-trend buying or short covering.
• Less volume and less conviction.
⸻
🟢 June 26
• Delta: +2,690 (mild net buying)
• Volume: 416,820 (higher)
• Interpretation:
• Rising volume but weaker delta.
• Early sign of balance developing.
• Possible absorption beginning.
⸻
🟨 June 27 (Critical Bar)
• Delta: +272 (near zero)
• Volume: 540,310 (very high)
• Interpretation:
• Huge volume churn.
• Neither buyers nor sellers in control.
• Likely institutional absorption of aggressive orders.
✅ This is a textbook example of Delta–Volume Divergence.
⸻
5️⃣ Why This Matters
Professional Insight:
• Sellers had been aggressive for several sessions.
• Suddenly, volume remained elevated, but delta flatlined.
• This suggests:
• Exhaustion of selling aggression, or
• Institutional accumulation and passive positioning.
This often sets the stage for:
• A trap reversal (short squeeze), or
• A continuation flush if sellers regroup and push lower.
⸻
6️⃣ Confirmation Scenarios
Scenario A: Bearish Continuation
• Watch for renewed strong negative delta (e.g., -5,000 or worse).
• Price remains below the last support (~3,250).
• Confirms absorption failed and sellers remain dominant.
Scenario B: Short Squeeze Reversal
• Price reclaims the VAL (~3,285–3,300).
• Delta flips strongly positive (+5,000 or more).
• Trapped shorts begin covering, driving price back toward supply.
⸻
7️⃣ Common Misinterpretation
⚠️ High volume alone does NOT mean momentum.
Key Point:
If delta is flat, high volume simply means churn, not directional energy.
This is why inexperienced traders often get caught:
• They see heavy volume and assume a breakout is underway.
• In reality, the market is absorbing liquidity to trap both sides.
⸻
8️⃣ Professional Tips for Trading Divergence
✅ Wait for confirmation before entering:
• Clear delta shifts, and
• Price reclaiming or rejecting key levels.
✅ Be aware of stop zones:
• Under recent lows if buyers fail,
• Above recent range if sellers get exhausted.
✅ Avoid trading during pure churn without clear follow-through.
⸻
9️⃣ Quick Recap
✅ Delta–Volume Divergence: High volume, flat delta, no clear directional control.
✅ Typically signals absorption and position buildup.
✅ Requires confirmation before committing to trades.
✅ Recognizing it helps you avoid traps and false breakouts.
⸻
🔟 Final Thought
Learning to read divergence is what separates professional traders from retail:
“Volume tells you how hard the market is working. Delta tells you who’s winning.”
Combine both to see the hidden game behind every price bar.
⸻
⚠️ Disclaimer: This lesson is for educational purposes only. Nothing here constitutes financial advice.
4 Powerful, Daily Affirmations for Faith-Based TradersAffirmations make a huge difference.
But why?
It's because they shape our beliefs.
Whatever we think, affects what we say.
Whatever we say, affects what we do.
Whatever we do, is who we become and what our life actual looks like.
Repeat these affirmations daily and watch your life change before your eyes.
Wealth flows to me with ease as I walk in purpose.
I reject scarcity and embrace Kingdom abundance.
I am open to divine provision in expected and unexpected ways.
I have more than enough to thrive and to give.
Happy trading!
For those of you who are trading to make a bigger impact in the world, I am praying for you!

Subtle Trading Challenges: Under-Discussed Psychological and OpsWhile traders often focus on well-known pitfalls like fear, greed, or overtrading , there are other subtle issues that can quietly undermine trading consistency and mindset. Below are a few under-discussed problems – touching on both psychology and day-to-day operations that many traders face.
Self-Worth Tied to Trading Performance
Some traders unknowingly tie their self-esteem or sense of self-worth to their trading results. When they have a losing day, they don’t just lose money – they feel personally defeated. This can trigger intense negative self-talk and emotional reactions to losses, sometimes causing traders to abandon their strategy or second-guess decisions in the heat of the moment. Because admitting such vulnerability is often seen as a weakness in trading circles, this issue rarely gets openly discussed, even though it can greatly sabotage a trader’s confidence and long-term consistency.
Analysis Paralysis and Decision Fatigue
In the age of overflowing data, traders can fall into “analysis paralysis” – overanalyzing market information to the point where they can’t make a clear decision. With countless indicators, news feeds, and opinions, it’s easy to get bogged down comparing options until no clear choice emerges, and this inaction can lead to missed profitable opportunities. Moreover, the mental strain of constantly dissecting information can cause decision fatigue, quietly diminishing the quality of any trades that are made. Unlike impulsive errors, this problem often masquerades as diligence, so it doesn’t get much attention in public discussions – yet it can erode a trader’s decisiveness and stress levels over time.
Constant Strategy Switching (System Hopping)
Another subtle pitfall is the tendency to jump between trading strategies too frequently, known as “system hopping.” Eager for a perfect method, traders might abandon a system after just a couple of losing trades and immediately switch to a new approach, never giving any strategy enough time to prove its worth. This habit – often fueled by impatience or get-rich-quick expectations – means the trader is always restarting the learning curve and never capitalizing on a method’s long-term edge. It’s an operational inconsistency that traders seldom admit openly, but it quietly undermines confidence and prevents the development of a stable, repeatable trading process.
Each of these problems tends to fly under the radar in trading forums or education, yet they subtly impact consistency and mindset. By recognizing these lesser-discussed challenges, traders can begin to address them and strengthen their overall discipline and performance.

Learn The Difference Between Beginner and Expert in Trading
In the today's post, we will discuss the evolution of a mindset of a trader as he matures in trading.
✔️Beginner
For some unknown reasons, beginners assume that a couple of educational videos and books about trading is more than enough to start trading successfully.
They believe that they got a comprehensive knowledge and that very few things remain to learn.
They start trading, but quickly realize that their knowledge is not enough to make even small gains.
✔️COMPETENT
After practicing a couple of years, traders come to the conclusion
that they know everything in that field. That they learned, tested and tried all concepts and techniques that are available.
They consider themselves to be the experts in the field BUT
for some unknown reasons, these traders still are not able to trade profitably.
✔️EXPERT
After many years of learning, training and practicing, eyes finally open.
Traders realize how limited is their knowledge and how much more there is to learn .
While they already have the skills to trade in profits, they understand now that even the entire life is not enough to learn all the subtleties of trading.
And here is a little lifehack for you:
if you are a beginner, embrace a mindset of an expert.
Start from realizing how little you actually know and how much more there is to know, that will help you a lot in your trading journey.
❤️Please, support my work with like, thank you!❤️
I am part of Trade Nation's Influencer program and receive a monthly fee for using their TradingView charts in my analysis.

Turn Your Chart – Turn Your ViewCurious about tricking your trading mind?
A lot of traders are constantly searching for new indicators or secret setups. But what if your biggest breakthrough is just a perspective shift away—literally?
This article is about a unique but effective experiment: Rotate your candlestick chart by 90 degrees (horizontal instead of vertical) and see how your perception and analysis change.
Example: ibb.co
No, this isn’t a volume profile – this is the real NAS100 chart, just rotated by 90°!
What do you see now? New patterns? Different price action? Sometimes a fresh angle reveals details you normally overlook and helps break your trading habits.
---
What changes?
1. Patterns suddenly look different
Trends, consolidations, and breakouts appear in a new light:
– Uptrends and downtrends lose their emotional “up feels hard, down feels easy” effect.
– Sideways markets become vertical clusters—your eye spots new structures.
2. Support & resistance become less dominant
Your classic support and resistance zones disappear.
You’re forced to rethink important levels—maybe you’ll notice supply/demand zones you always missed.
3. Emotional neutrality
With a rotated chart, the usually existing “Long is better” bias fades.
You view price action more objectively—and may discover signals you’d otherwise miss.
---
Try it out!
What did you discover by rotating your chart? Comment below or share your thoughts!

Learn 6 Common Beginner Trading Mistakes (FOREX, GOLD)
In the today's post, we will discuss very common beginner's mistakes in trading that you should avoid.
1. No trading plan 📝
That is certainly the TOP 1 mistake. I don't know why it happens but 99% of newbies assume that they don't need a trading plan.
It is more than enough for them to watch a couple of educational videos, read some books about trading and Voilà when a good setup appears they can easily recognize and trade it without a plan.
Guys, I guarantee you that you will blow your trading account in maximum 2 months if you keep thinking like that. Trading plan is the essential part of every trading approach, so build one and follow that strictly.
2. Overtrading 💱
That mistake comes from a common newbies' misconception: they think that in order to make money in trading, they should trade a lot. The more they trade, the higher are the potential gains.
The same reasoning appears when they choose a signal service: the more trades a signal provider shares, the better his signals are supposed to be.
However, the truth is that good trades are very rare and your goal as a trader is to recognize and trade only the best setups. While the majority of the trading opportunities are risky and not profitable.
3. Emotional trading 😤
There are 2 ways to make a trading decision: to make it objectively following the rules of your trading plan or to follow the emotions.
The second option is the main pick of the newbies.
The intuition, fear, desire are their main drivers. And such an approach is of course doomed to a failure.
And we will discuss the emotional trading in details in the next 2 sections.
4. Having no patience ⏳
Patience always pays. That is the trader's anthem.
However, in practice, it is extremely hard to keep holding the trade that refuses to reach the target, that comes closer and closer to a stop loss level, that stuck around the entry level.
Once we are in a trade, we want the price to go directly to our goal without any delay. And the more we wait, the harder it is to keep waiting. The impatience makes traders close their trades preliminary, missing good profits .
5. Greed 🤑
Greed is your main and worst enemy in this game.
It will pursue you no matter how experienced you are.
The desire to get maximum from every move, to not miss any pip of profit, will be your permanent obstacle.
Greed will also pursue you after you close the profitable trades. No matter how much you win, how many good winning trades you catch in a row, you always want more. And that sense main lead you to making irrational, bad trading decision.
6. Big Risks 🛑
Why to calculate lot size for the trade?
Why even bother about risk management?
These are the typical thoughts of the newbies.
Newbie traders completely underestimate the risks involved in trading and for that reason they are risking big.
I heard so many times these stories, when a trading deposit of a trader is wiped out with a one single bad trade.
Never ever risk big, especially if you just started.
Start with a very conservative approach and risk a tiny little portion of your trading account per trade.
Of course there are a lot more mistakes to discuss.
However, the ones that I listed above at the most common
and I am kindly recommending you to fix them before you start trading with a substantial amount of money.
❤️Please, support my work with like, thank you!❤️
I am part of Trade Nation's Influencer program and receive a monthly fee for using their TradingView charts in my analysis.

NO TRADE? THAT IS THE TRADEToday, I took no trades and I’ll be honest, it was really tempting to break that discipline.
I stared at the chart longer than I needed to. My cursor hovered around the Buy and Sell buttons. My brain tried to convince me that “maybe” this candle meant something. Even though there was no valid sweep, no BOS, and no clean entry into an FVG , the desire to just “be in a trade” was strong.
But I reminded myself:
📌 No Setup = No Trade
📌 Your edge is your lifeline
📌 Discipline is what pays you, not activity
What I felt today is something every trader battles, setup hoping . It’s that mental trap where silence feels wrong, and boredom feels dangerous. But the truth is, boredom is part of being a consistently profitable trader. There are days where your best trade is the one you don’t take.
And I’m proud to say I did nothing.
No revenge trade.
No gambling.
No deviation from plan.
Instead, I observed. I journaled my emotions. I stayed in control. That’s the work behind the scenes: the mental reps that build longevity in this business .
So if you had a quiet session today too, and you resisted the urge to jump in without reason, celebrate that. You're training your mind to trust your system, not your feelings.
Sometimes, the most powerful trade you’ll ever take… is the one you never place.

Intro to my python-tradingview strategyAfter three years working on multiple trading strategies, I decided to share my experience and my trades. But before going live, I think I need to explain the roadmap I’ve followed so far.
I initially started coding my strategy in PineScript, which is a powerful tool. It allowed me to simply code my ideas and turn them into trading signals using alerts and conditions. I’m sure you’ve already watched dozens of YouTube videos on how to use webhooks and TradingView to send signals to your trading platform. Anyway, I began developing my strategy in Pine and used webhooks to connect to Tradovate. I went live after a few months of testing—which, of course, was my first mistake. In January 2022, my algo went live. I traded on a strategy that was just tuned on seen data, manually flipping parameters to maximize PnL—a purely overfit model—and I went live with real money. Anyway, the first month was positive and I thought I was the best trader in the world. I even told my wife we were going to be rich, like nothing could stop us. But after three months of trading, I lost—obviously. It was a bummer, but I knew where the problem was: lack of proper backtesting.
So that was the moment I moved my code to Python. It took me a couple of weeks to build an end-to-end backtesting framework in Python. I used Backtrader as a backtesting tool, which is awesome. I’ll have some videos soon to explain more about that. Anyway, moving my code to Python gave me the luxury of backtesting and creating rolling walk-forward optimizations, allowing me not only to refine my strategies but also to test them on 5–6 years of historical data.
Long story short, working with Python enabled me to come up with five different strategies for NQ and ES. I plan to share those trades, but before that, I thought I should share my journey first.
Please leave comments and follow my channel. More to come.

Not Every Candle Needs a Reaction — I Know I’ve GrownThere was a time I thought I needed to react to every move.
A clean candle? I’d enter.
A minor imbalance? I’d take the risk.
A zone that “looked okay”? I’d justify it.
Why? Because I was chasing something.
Chasing certainty .
Chasing profit .
Chasing control .
But here’s the thing I didn’t understand back then:
Not every candle needs a reaction. And not every move is my move.
🧠 Overtrading Wasn’t a Strategy. It Was a Symptom.
It was a symptom of fear — fear of missing out (FOMO).
It was a symptom of insecurity — not trusting my own process.
It was a symptom of impatience — not letting the market come to me.
I confused activity with progress. I thought being busy on the charts meant I was becoming better. But most of the time, I was just bleeding my edge.
💡 The Turning Point
Growth didn’t happen because I learned a new indicator. It happened the moment I started asking myself:
Is this my setup? Or am I just bored, hopeful, or triggered?
When you define a clear trading plan, with criteria you believe in, the real test isn’t finding setups...it’s waiting for the right ones. Today, I can watch the market move beautifully without me and feel absolutely nothing.
That’s freedom.
That’s growth.
That’s power.
🧘🏽♂️ From Reactive to Intentional
Now, I focus on:
Waiting for my specific SMC criteria to line up
Sticking to my CRT model (PDL/PWH sweep → BOS → FVG)
Trusting that missing one trade means nothing if I stay consistent
Letting the market come to me
I’m no longer in the game to prove something. I’m here to play my edge , manage my risk , and protect my mind.
📌 Final Words
Growth in trading isn't loud. It doesn’t scream from a winning streak. It shows up quietly:
in the trades you didn’t take.
in the silence between setups.
in the patience to do nothing until it’s time.
So if you’re not constantly in a trade, that’s not weakness that’s wisdom.

Trading Without an Edge Is Like Gambling Without the FunAt least in Vegas, you get free drinks.
Let’s cut the fluff.
You want to make money trading.
But here’s the problem no one wants to admit:
Most traders don’t have an edge. And they trade anyway.
Which means they’re not traders.
They’re just expensive gamblers in denial.
🎰 W elcome to the Casino Called “Charts”
In Vegas, the odds are clearly displayed.
You know the house has the advantage.
But in trading? You convince yourself you are the house.
You say things like:
-“This setup worked for someone on YouTube.”
- “Price is oversold, so it has to bounce.”
- “I just have a feeling it’ll go up.”
That’s not a strategy. That’s astrology.
If you can’t define your edge in one sentence, you don’t have one.
And if your edge isn’t tested over at least 100 trades — it’s fantasy.
🧠 What Is an Edge, Anyway?
An edge is not a pattern. It’s not always your gut.
It’s a repeatable, testable advantage in the market.
It could be:
- A statistical tendency in price behavior
- A setup with positive risk-to-reward over time
- A timing structure that aligns with volume or volatility
- Even psychological edge (you stay calm when others panic)
But here’s the key:
An edge is something that works often enough, with controlled risk, and consistent execution.
☠️ What Happens When You Don’t Have One
Let’s break it down.
Trading without an edge leads to:
- Random outcomes that feel emotional
- Overtrading because you’re chasing the next “feel good” moment
- Misplaced confidence after a few lucky wins
- Explosive losses when luck runs out
And worst of all?
You think you’re improving…
But in reality, you’re just getting better at losing slower.
🍹 At Least Vegas Gives You Something Back
Here’s the irony:
In Vegas, the drinks are free.
You get a show. You laugh. You know it’s a gamble.
In trading?
- You pay for your losses
- You pay for your education
- You pay for your psychology coach
- And nobody even gives you a free mojito.
If you're going to lose money without an edge, you might as well enjoy the music.
🎯 So How Do You Actually Get an Edge?
1. Backtest.
Find a setup that repeats. Track it. Chart it. Obsess over it.
2. Track your stats.
Your win rate, average R, time in trade. Know thyself.
3. Simplify.
An edge isn’t 12 indicators. It’s one thing done well.
4. Survive first, thrive later.
If you’re not around after 100 trades, your edge won’t matter anyway.
5. Learn from pain, not just profit.
Your losers have more to teach than your winners.
🧘 Final Thought – Stop Playing Pretend
If you wouldn’t go to a casino and bet $1000 on 25 without knowing the odds…
Why are you doing that in the markets?
Don’t call it trading if it’s actually coping.
Don’t call it strategy if it’s actually guessing.

Gut Feeling Vs. Technical Analysis- How I Take TradesTrading Is Both Art and Science
Every trader, no matter how data-driven, eventually encounters moments when they just know something about the market.
That quiet internal signal:
“Don’t touch this today.”
Or: “Get ready. Something’s coming.”
That’s not random emotion. That’s your gut feeling – and in trading, it's worth paying attention to. But here's the catch:
👉 Gut feeling alone isn’t enough.
👉 Technical analysis alone isn’t either.
The real edge comes when both align.
________________________________________
What Is Gut Feeling in Trading?
“Gut feeling” is a term used to describe intuitive decisions that seem to arise without conscious reasoning. In trading, it often presents as a subtle inner nudge – a warning, a hesitation, or a surge of clarity.
Contrary to popular belief, it’s not just emotion. It’s often the result of:
• Unconscious pattern recognition from years (or decades) of chart-watching
• Internalized market behavior that doesn’t show up on an indicator
• Emotional awareness, sensing when the environment isn’t right to trade
Experienced traders know this isn’t “woo.” It’s pattern memory speaking quietly.
________________________________________
On the Other Hand: What We Call Technical Analysis?
We all know the tools: support/resistance, price action, indicators like RSI, MACD, Bollinger Bands, maybe Smart Money Concepts or just clean trendlines, etc.
Technical analysis gives us structure — measurable, repeatable setups. But let’s not pretend it captures everything:
• News can spike irrationally
• Liquidity can vanish when you least expect it
• And sometimes, the chart says 'yes' but the market mood says 'don’t trust it'
That’s where gut feeling becomes the final filter.
________________________________________
✅ Why I Wait for Alignment
Let’s be honest: most bad trades happen when you force action despite internal hesitation.
Here’s how I frame decisions:
✅ Full alignment
• Gut: Yes
• Technicals: Yes
• 👉 Take the trade
⚠️ Gut says no, but technicals agree
• Gut: No
• Technicals: Yes
• 🚫 Wait – something’s off
⚠️ Gut says yes, but technicals are unclear
• Gut: Yes
• Technicals: No
• 👁 Watch only – do not act
❌ No alignment
• Gut: No
• Technicals: No
• ✅ Stay out – smart decision
You’re not supposed to be in every trade. You’re supposed to be in the right trades.
________________________________________
🔍 Real-Life Example: Gold (XAUUSD)
Yesterday, Gold surged due to geopolitical escalation and renewed tariff tension.
Is looking bullish now: descending trendline broken, above 3350 which acts as confluence support.
📈 The chart said: “Buy.”
🧠 But my gut said: “ No. This is an emotional move. It’s not done correcting .”
So I stayed out.
Why?
Because if I trade while my gut says “no”, I second-guess every tick.
Even if the chart is right, I start hoping it fails — just to prove my feeling was right.
That’s emotional sabotage.
But when gut and chart say the same thing, I don’t hesitate.
Even if the trade loses, I’m at peace. I executed from clarity, not conflict.
That’s not just technical skill. That’s mental edge.
🧠 How to Develop Trustworthy Intuition
If you’re new or inconsistent, your “gut feeling” might just be fear, greed, or FOMO. But over time, real intuition can be trained like a muscle.
1. Screen Time
The more markets you watch, the more silent patterns your brain absorbs. Eventually, you’ll “feel” momentum shifts before indicators print them.
2. Journaling
Write down what you felt before each trade. Did it align with your plan? Over time, you’ll spot which feelings were intuition and which were impulse.
3. Meditation & Clarity
The more you control your emotional noise, the easier it becomes to hear real signals.
________________________________________
⚠️ Common Pitfalls: When Gut Feeling Betrays You
Let’s be clear – not every gut feeling is wise. Here are some red flags:
• Revenge trading disguised as confidence
• FOMO masked as intuition
• Fear of missing out during high volatility sessions
• Fatigue or stress, which distort perception
🧠 Tip: A real gut feeling comes with calm clarity, not urgency or adrenaline.
________________________________________
🎯 Final Thought
Gut Feeling + Technical Analysis = Peace of Mind
The best trades aren’t just technically correct — they’re internally clean. No doubt. No hesitation. No self-conflict.
Wait for alignment. Then execute with full presence.
Disclosure: I am part of TradeNation's Influencer program and receive a monthly fee for using their TradingView charts in my analyses and educational articles.

In Theory, You’re a Great Trader — In Practice, You’re Human🧠 10 Ways Trading Theory Falls Apart in Real Practice
Because in theory, you're rich. In practice, you panic-sold at support.
“In theory, there is no difference between theory and practice. In practice, there is.”
— Yogi Berra
Welcome to trading — where you read about patience and discipline, and then blow up your account chasing a breakout at 3AM.
Let’s explore the top 10 ways trading theory gets wrecked by real-world execution, complete with painful honesty and maybe a laugh or two (because crying is for after market close).
________________________________________
1. 🎯 In theory: You always follow your trading plan.
In practice:
You make a new plan after every trade.
That loss wasn’t part of “the plan,” so obviously the plan was wrong. Let’s fix it — during the trade — in real-time — while it bleeds. Genius.
________________________________________
2. 🧘♂️ In theory: You manage risk carefully.
In practice:
"Let me just move the stop... just this once... just 10 more pips..."
Before you know it, your stop loss is in the next timezone, and your trade is now a long-term investment.
________________________________________
3. 📊 In theory: Backtesting proves the strategy works.
I n practice:
Backtest = you, alone, with no emotions, clicking replay in TradingView.
Live trading = markets screaming, Twitter panicking, and you entering on the 1-minute chart because “it felt right.”
________________________________________
4. 💻 In theory: You’ll be objective.
In practice:
You saw one green candle and whispered:
“This is it. The reversal. I feel it.”
You weren’t objective. You were in a situationship with your trade.
________________________________________
5. 💰 In theory: R:R 2:1 minimum.
In practice:
You close at +0.3R “just to be safe” — and then it hits target 10 minutes later while you re-enter worse, and get stopped.
________________________________________
6. 🕒 In theory: You wait for confirmation.
In practice:
You anticipate confirmation. You hope for confirmation.
Spoiler: hope is not a strategy. But hey, at least you learned… again.
________________________________________
7. 🤖 In theory: You’re a rules-based, emotionless trader.
In practice:
You meditate, breathe deeply, journal, and then buy Gold after CPI with no stop loss and max leverage.
So much for being the Terminator.
________________________________________
8. 📚 In theory: More knowledge = better performance.
I n practice:
You read five books, memorized all candlestick names, and still entered long into resistance because it “looked bullish.”
Trading isn’t trivia night. It’s controlled decision-making under fire.
________________________________________
9. 😤 In theory: You’ll accept losses calmly.
In practice:
First you rage-quit. Then you revenge trade. Then you open ChatGPT and ask:
“Should I hedge this 80% drawdown?”
________________________________________
10. 📆 In theory: You’ll be consistent.
In practice:
You traded London Open on Monday, Asian Session on Tuesday, and New York close on Friday.
Consistency? You don’t even use the same time frame twice in a row.
________________________________________
🚧 So… how do you bridge the gap?
1. Journal your trades — honestly. Especially the emotional mess-ups.
2. Create rules you can actually follow — not Instagram-quote rules.
3. Simulate real conditions — including drawdowns, boredom, and fakeouts.
4. Accept that mistakes are part of the job — and build for resilience, not perfection.
5. Trade small enough that you don’t care much — so you can learn while surviving.
________________________________________
🎯 Final word:
Trading theory is like a clean whiteboard.
But the market? It’s a chaotic toddler with crayons and no rules.
If you can operate inside that chaos — with clarity and emotional control — that’s when the theory starts working.

Structure Over Sentiment: Multi-Asset View into Month-End📊 Structure Over Sentiment: Multi-Asset View into Month-End | May 30, 2025
This isn’t a crash. This isn’t a rally. This is digestion.
The multi-asset view tells the real story — and it's not as chaotic as it looks.
🔍 What the Chart Shows:
This correlation lens plots key macro and market drivers YTD:
🟣 Gold (XAUUSD): Leading with +24.71% — this is the quiet macro bid no one’s talking about
🟢 Bitcoin (BTCUSD): Holding +8.47% — volatile, but still showing risk appetite
🔴 10Y Yield (US10Y): Up +5.31% — signalling rates peaking
🟠 Nasdaq (NDX): Nearly flat, -0.36% — NVDA strength masking internal rotation
🔵 S&P 500 (SPX): -2.32% — structurally fine, just not euphoric
🔵 Dow (DJA): -5.91% — lagging, cyclical drag
🔵 Russell 2000 (RTY): -13.60% — small caps under pressure, risk-on caution flag
🟣 Dollar Index (DXY): -6.44% — fading after a strong Q1
🟢 Oil (WTIUSD): -10.26% — no inflation panic here
🧠 Key Insight:
Despite the tariff headlines, sticky PCE, and conflicting narratives — the market remains internally consistent.
Gold is leading
Yields are rising but not sharply
Bitcoin is positive
Equities are flat-to-negative
Oil is weak
Dollar is fading
This is classic late-cycle digestion, not a crisis.
🛡️ Titan Mindset Check-In:
Don’t get lost in single headlines
Follow structure, not speculation
Let leaders lead (NVDA, Gold, BTC)
Protect equity when breath narrows
Zoom out, reduce noise, trade the curve — not the chaos
📍“Volatility isn’t risk. Misinterpretation is.”
Take Profits, Not Chances.
#MultiAssetView #StructureOverShock #TitanProtect #SPX #NDX #BTC #Gold #DXY #WTI #US10Y #MacroFlow #MarketMindset #LateCycleSignals #DigestDontPanic

How Forex Brokers Manipulate Your Trading. Real Examples
Your Forex broker could be manipulating your trades right now - and you would not even know it.
They can rig your charts, trap you in losing trades and steal your money.
In this article, I will expose how they do it, I will show you a real example how broker's manipulations can lead to bad trading decisions and significant losses.
What I’m about to show you will change the way you trade forever, and you’ll never look at your trading charts the same way again.
The story started with a trading live stream in my academy with my students.
We spotted a nice setup to trade.
We found a strong 4H support on Silver with a confirmed liquidity grab after its test.
As a confirmation, we identified a cup & handle pattern on an hourly time frame and a breakout of its neckline with a bullish imbalance.
When I got my entry signal, I opened my trading terminal to execute the trade.
And the way I trade is very specific: I use TradingView for chart analysis BUT I have a separate trading terminal for trade execution.
When I opened the same setup in my trading terminal, I saw a completely different picture and a strong bearish signal.
The broker that I use for technical chart analysis is OANDA , while my trading terminal uses ICMarkets quotes.
On the right is the price chart of SILVER with IC.
There we can see a valid breakout and a candle close below the support with its consequent retest.
From a price action perspective, it is a strong signal to sell .
I got a strong feeling that some kind of manipulation is going on here, so I decided to check Silver charts of other brokers.
Only the broker that I used for market analysis on TradingView provided a bullish signal, while other brokers had very bearish charts on Silver.
It looked very suspicious and felt like OANDA broker was inducing me to buy, knowing that the price is going to drop. So I made a decision not to take a trade.
Look what happened then.
After a retest of a broken support, Silver dropped sharply.
Checking the same trading setup on different brokers' charts can help you to avoid the manipulation.
My simple decision to examine more charts helped to avoid a losing trade.
I strictly recommend you doing the same thing before you place a trade.
IF you see a strong deviation of your charts from other brokers, stay alert and vigilant. Probably it is not a good idea to open the trade.
❤️Please, support my work with like, thank you!❤️
I am part of Trade Nation's Influencer program and receive a monthly fee for using their TradingView charts in my analysis.

If You’re Bored, You’re Probably Doing It RightYou think trading should be exciting?
That every day should feel like a high-stakes chess match?
That if it doesn’t feel intense, something’s wrong?
Nope.
Good trading is boring.
Systematic.
Repetitive.
Unemotional.
You take your setup. You size properly. You respect your stops. You move on.
Same rules. Same routine. Same process.
It’s not sexy. But it’s stable.
The truth?
The more exciting your trading feels, the more likely you’re slipping.
Overleveraging. Overtrading. Overreacting.
Boredom isn’t a bug. It’s a feature.
It means you’re not chasing.
You’re not forcing.
You’re following your edge — and letting the numbers do the heavy lifting.
You don’t need adrenaline.
You need consistency.
Get comfortable with boredom. That’s where the money is.
Boredom is not your enemy — it’s your ally.
Stay patient, stay consistent.
Charts & Grit
