Leverage 50:1 (maximum Reward Risk)Should you use 50:1 leverage or maximum Reward Risk on any one trade? Is that using proper risk management?
Per chart example:
1) You could either lose on chart one trade 10% of your account or
2) You could win on chart one trade 25% of your account
Using Leverage is a double edged sword, which can be used or abused in the context of risk management, lot size, margin and leverage.
Bad risk management is number #1 reason why traders blow accounts.
Use 2% of account on one single trade, adjust lot size accordingly, stop losses and targets- this is a marathon not a sprint.
Trading Psychology

Leverage Trading (Example)What is leverage in Forex?
Leverage is a facility that enables you to get a much larger exposure to the market you’re trading than the amount you deposited to open the trade. Leveraged products, such as Forex trading, magnify your potential profit - but also increase your potential loss.
Leverage works by using a deposit, known as margin, to provide you with increased exposure to an underlying asset. Essentially, you’re putting down a fraction of the full value of your trade – and your provider is loaning you the rest.
Leverage and risk management
Leveraged trading can be risky as losses may exceed your initial outlay, but there are risk-management tools that you can use to reduce your potential loss. Using stop-losses is a popular way to reduce the risk of leverage. Attaching a stop-loss to your position can restrict your losses if a price moves against you. However, markets move quickly and certain conditions may result in your stop not being triggered at the price you’ve set.

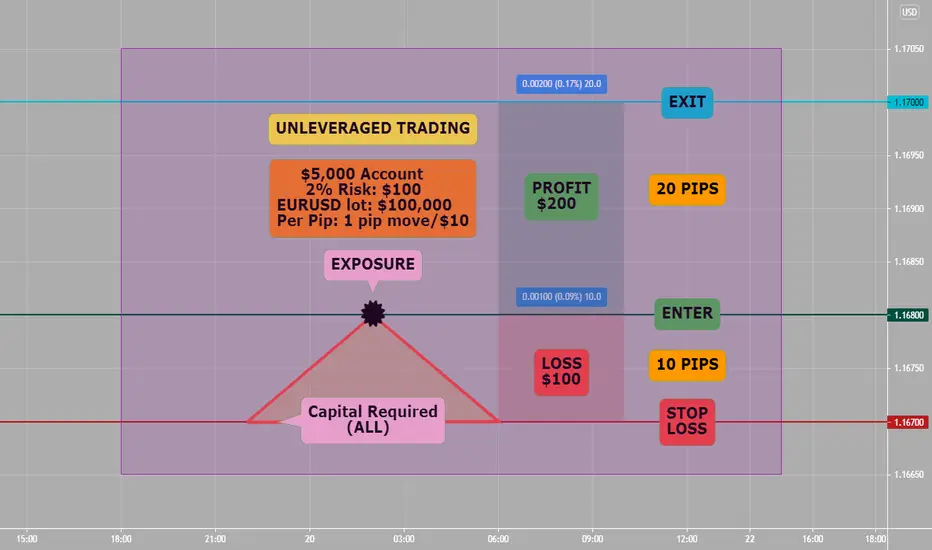
Unleveraged Trade (Example)Pure Forex trading without using leverage. Either loss $100 or win $200 on chart example of EURUSD.
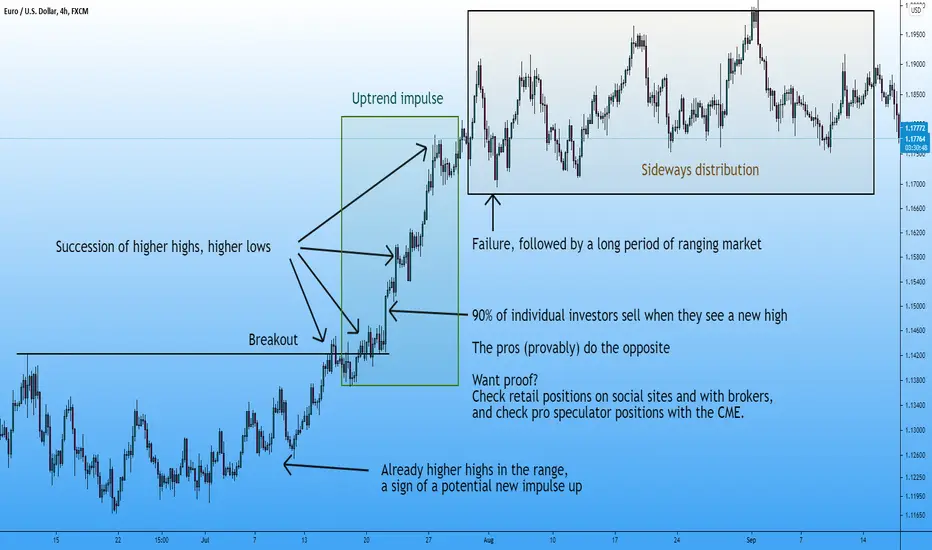
The basics: Higher Highs and Higher LowsMarkets trend. There are impulses, and in those the price consistantly makes several higher highs and lows, or lower highs and lows in the case of a downtrend impulse, or leg. The majority that try to compete in this activity fail, and from what I have seen they either don't know the basics, or have loss phobia. Or are dense, that's also a possibility.
It is basic. Do not go against the trend. Especially when it is diagonal. The market goes up in impulses. Forget elliott or dow waves, there can be any number of impulses within the impulse. 5 higher highs and lows, 6, 7, 8. Of course I am not used to seing something like 25 in a row. People would become instant billionaires if that happened. I wish...
I can't prove the market behaves in that way but I can use some empirical evidence. In here I will present a couple of examples. 2, 3 or 4 examples can be a coincidence. But when something repeats itself over and over it is unlikely it is a coincidence. It's basic and easy to play around the fact that currency pairs make successive higher highs and lows. For example it might be pointless to hold a long once the price has reached a lower low (but it's a bad idea to have a stop at the very low or just below it).
Eurodollar downtrend from the 20 April to the 10 May:
Put into context:
And then the new low:
Another example:
Forex charts look noisy and random, but they are obviously not random. The price does not randomly make a higher high in a downtrend then continues down. It keeps making lower highs without fail, and once there is a higher high well, most of the time it does not go just slighlty higher then drop.
How embarassing is it that PHD economists can't see this?
Sometimes a higher high in a downtrend is a trap
Here is what individual investors can be seen doing:
Retail positions have no predictive abilities that I know of.
Their entries are basically random. And don't matter.
I am not contrarian to retail positions when I enter, sometimes I buy with 80% of them.
I see 0 correlation with my entries.
But where is there a difference? Each time I have a big winners going past 5R I look at retail positions, and what I see is 80-90% are in the opposite direction (and have been for a while).
Them sucking and being on the wrong side could either be due to entering at stupid moments, or closing winners quickly and holding losers which leads to an aggregate of "80% long" at the bottom of long downtrends.
Are they dumb or afraid? By afraid I mean loss aversion.
I do not think personally they are all idiots that just go against the trend, but I do think there are a lot of individual investors that do just that. I can imagine them being all nervous while I'm just chilling.
I would say at least 90% got to be afraid, let's simply call it what it is: weak.
There are plenty of idiots. Who gets into this? People that have money and went to school right?
Engineers and doctors? There has to be some gamblers too.
In investing in general I know the vast majority is "educated" as well as IQ > 100 but short term like this might not have the same distribution.
How basic is it? Price makes lower lows and highs it is going down, and once there is a higher high the trend takes a break or reverses.
Trade like a pro, not another statistic.
COT Report (How To Find Information & USDJPY Bullish)Commodity Futures Trading Commission (Commission or CFTC) publishes Commitments of Traders (COT) reports to help public understand market dynamics.
------------------- I used website called: Tradingster to get COT Report but you can see information directly from CFTC.gov too.
How To Find Official Information:
1) Google or DuckDuck go: cftc.gov 2) Left side under Market Data & Economic Analysis
3) Click On Commitments Of Traders 4) Scroll down to section called Current Legacy Reports
5) See 2nd one, which says Chicago Mercantile Exchange----> under Futures Only----> see Long Format or Short Format 6) Click on Short Format
7) You now see a lot of both commodity and/or Currency Futures (Forex) information---> scroll down to like Example Japanese Yen (chart example)
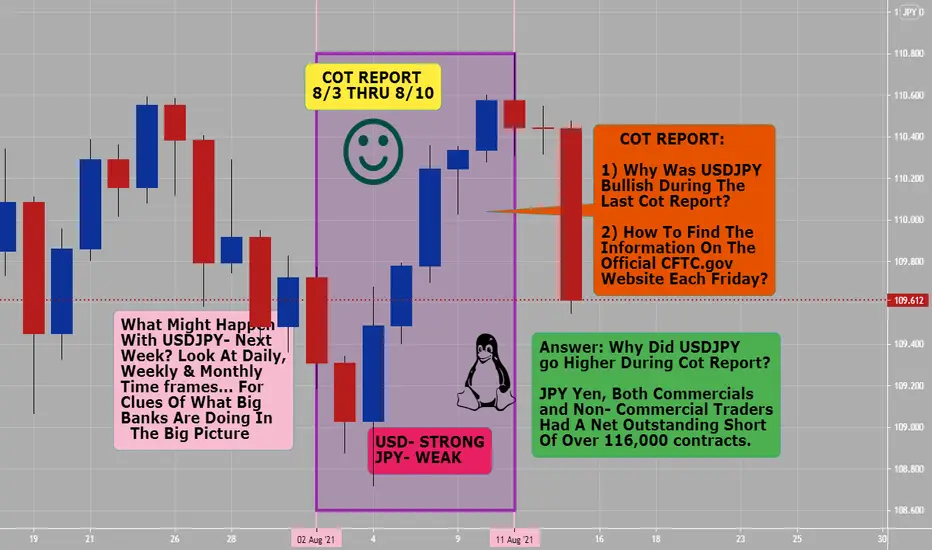
Why Was USDJPY Bullish During Last Cot Report Of Date 08/10/2021 (Tuesday)? (BELOW IS CUT/PASTE of Japanese Yen Information)
JAPANESE YEN - CHICAGO MERCANTILE EXCHANGE Code-097741
FUTURES ONLY POSITIONS AS OF 08/10/21 |
--------------------------------------------------------------| NONREPORTABLE
NON-COMMERCIAL | COMMERCIAL | TOTAL | POSITIONS
--------------------------|-----------------|-----------------|-----------------
LONG | SHORT |SPREADS | LONG | SHORT | LONG | SHORT | LONG | SHORT
--------------------------------------------------------------------------------
(CONTRACTS OF JPY 12,500,000) OPEN INTEREST: 206,131
COMMITMENTS
36,684 97,341 461 151,720 68,459 188,865 166,261 17,266 39,870<------ THIS IS INFORMATION YOU NEED TO KNOW!!!
FYI: From above information we can see total contracts of JPY of 12,500,000. Open Interest is 206,131. Non Commercial Traders have 33,000 more short contracts and Commercials have 83,000 more short contracts outstanding. What does that mean? JPY is Weak & USD is Strong- verified on chart.
The Art of Swing TradingHey, family, we are wishing you all a pleasant weekend and coming at you with another educational post. The topic of our article for today is the following: The Art of Swing Trading. As you all may know, Swing Trading refers to the practice of trying to profit from market swings of a minimum of one day and as long as several weeks. But what is it that makes this type of market trading so unique? Let’s follow through and find out!
To start with, Swing Trading is safer than other types of trading such as day trading and scalping. This is due to the fact that with Swing Trading, you are less likely to overtrade, there is less stress and there is a reduced chance of making mistakes. Secondly, with Swing Trading, you are likely to spend much less time on the charts in front of monitors. You don’t have to open many positions within a day as opposed to intraday trading and scalping, which gives you plenty of free time in your hands. You can simply open your positions and then forget about those positions for days or weeks to come. You can go for a walk with your partner, grab a cup of coffee with your best friend, spend a quality time with your family, and do it all without being anxious about your trades. As the golden rule states: “Set (Your TP and SL) and forget”. Last but not least, financial news do not have a huge impact on your positions, as your SL is relatively higher than the Stops of day traders and scalpers. Therefore, you do not need to worry about some random spikes taking you out of the trades.
However, as the famous proverb cites, every advantage has its disadvantage. When it comes to Swing Trading, he or she needs to have patience, patience and some more patience. Swing trades are meant to be held open for a few days of even few weeks (Well, at least till the price hits your Target Profit). And while the trade is running open, you should know how to remain calm, control your emotions, and not to stress out. Once again, set and forget. Do not monitor your positions every 10-15 minutes. Further to that, this type of trading generally requires a huge trading capital, or otherwise, the profits are gonna be minuscule.
When it comes to the timeframes that need to be used, the Weekly and the Monthly are the best for identifying the direction of the trend, the Daily is the best for drawing the key zones and identifying the needed patterns, and lastly, H4 should be utilised for entering and exiting the market.
As for the recommendations part, the utilised risk fully depends on the trading capital. The 1-1.5% risk would be the standard normal. As for the risk-to-reward ratio, 1:3 would be an appropriate one to go with. But remember not to be greedy in the markets. Take your profits and enjoy the fruits of your labor.

The COT Report (How To Use/Strategies) BonusHow To Use The COT Report In Your Forex Trading
Before we discuss how to trade the Forex market using the COT Report, you should know why the COT Report is important for Forex traders.
Forex trades are executed over-the-counter (OTC). There is no central body, like NYSE, where all trades are recorded. It is difficult to accurately track volumes behind all Forex trades. It is also harder to know what big banks, large speculators, and other market drivers, are doing. But with the COT report, Forex traders can have an insight into these pieces of info. Which brings us to first use of the COT report in FX.
Trading Strategy 1: COT Report as a Forex volume indicator
The COT report can serve as a powerful Forex volume indicator when you use it rightly. Since CFTC releases the weekly report every Friday for all trades recorded before Tuesday, you can only use it for long-term trades. To use the COT Report as a volume indicator, keep your eyes on the open interest numbers of an asset. When there is a rise in the open interest of an asset, it means more people are trading the futures contract of the asset.
Trading Strategy 2: Using the COT Report to predict reversals
There are two ways to use the COT report to spot potential reversals in the Forex market. The first method is the use of the spreads data on the report. A reversal may occur when the spread between commercial and non-commercial traders is wide. If the commercial traders are going heavily bullish while the non-commercials are heavily bearish, the market could experience a reversal to the uptrend. And if commercials are going short while non-commercials are going long, a reversal to the downtrend may occur. The other method involves noting where the non-commercial traders are accumulating their positions. Remember that non-commercial traders are the big money guys that are interested in making more money. They are the ones you want to mimic.
So, when you find that their positions on a certain futures contract are reversing, and a reversal might be imminent on the underlying asset. This use of the COT report is similar to how you might use a sentiment indicator, such as the Current Ratio FXSSI indicator, in a Forex sentiment analysis. To get better results, you can use the data from the COT report to complement your technical analysis from other Forex trading tools. good luck.

The COT Report (Why Did EurUSD Fall?) Part 3 of 3C.O.T. is an acronym for Commitment of Traders. It is a report that contains a weekly overview of how participants of the futures markets in the U.S. have traded. The report contains all the positions of the main market factors in the United States. Why Did EurUSD fall during the latest COT Report from 8/3/21 to 8/10/21 (date period)- came out Friday on 8/13/21. Yes, data is historical in nature, but has great future value in trading FX for long and short term traders.
EURO FX - CHICAGO MERCANTILE EXCHANGE Code-099741
FUTURES ONLY POSITIONS AS OF 08/10/21 |
--------------------------------------------------------------| NONREPORTABLE
NON-COMMERCIAL | COMMERCIAL | TOTAL | POSITIONS
--------------------------|-----------------|-----------------|-----------------
LONG | SHORT |SPREADS | LONG | SHORT | LONG | SHORT | LONG | SHORT
--------------------------------------------------------------------------------
(CONTRACTS OF EUR 125,000) OPEN INTEREST: 702,098
COMMITMENTS
212,809 178,952 8,072 388,866 458,925 609,747 645,949 92,351 56,149
Above is part of 8/13/21 cftc.gov latest COT report.. The Difference in total longs and shorts (of both non commercial/commercials) equals 36,202 more short contacts. Contracts of EUR 125,000 (total) divided by 36,000 (more shorts) equals around 29% more of short contracts outstanding. This is why I believe that EURUSD dropped during the last COT report period of around 180 pips. Note: The COT keeps you on right side of trading with smart money.
Yes, using both commercial and non commercials are way to go for looking to where a particular market might go related to the COT report.

The COT Report (Trade Like Banks) Part 2 of 3C.O.T. is an acronym for Commitment of Traders. It is a report that contains a weekly overview of how participants of the futures markets in the U.S. have traded. The report contains all the positions of the main market factors in the United States.
These major market drivers include institutional traders, hedge funds, big banks, and more. And the weight these traders pull on the markets can sometimes be staggering enough to drive trends. As retail Forex traders, our best bet is to trade like big financial institutions or Big Banks, Central Banks, Hedge Funds.
They are the non-commerical traders. Non-commercial traders are large speculators who already have a lot of money in the bank, but want to make some more by trading the futures market. Examples of these non-commercial traders include hedge funds, trading advisors, and other huge financial institutions. These institutions follow the trend religiously. They buy in an uptrend and sell in a downtrend.
The majority of Forex traders are you and I; retail traders. We make up over 90% of all traders. The remaining 10% (or less) are smart money traders, such as banks. Smart money traders make the largest and most consistent profits between these two categories of traders. They are profitable 90% of the time. But retail traders lose money over 90% of the time.You may then wonder how banks make so much money and many retail traders lose so much money. The answer lies in how the banks trade Forex. FYI: There phases are: Accumulation then Manipulation then Distribution, then rinse and repeat over and over.
Now that you know who the smart money traders are, you want to know how they are different from you.
Firstly, smart monies have much more money to trade than you. I'm not talking about thousands or hundreds of thousands. Smart monies have tens and hundreds of millions to trade. And the sheer volume of their trades gives them the power to drive the market.
Secondly, they don’t trade on small time frames. Smart monies trade daily, weekly, or even monthly time frames. Traders that trade on small time frames are usually looking to get in and out of the market in a short time. But the smart money is usually in the market for a long time.

The COT Report (Trade With Smart Money) Part 1 of 3C.O.T. is an acronym for Commitment of Traders. It is a report that contains a weekly overview of how participants of the futures markets in the U.S. have traded. The report contains all the positions of the main market factors in the United States.
The Commodity Futures Trading Commission (CFTC) provides this report every Friday at 3:30 P.M. EST for all positions recorded from the Tuesday of the same week to Tuesday in the previous week. As the name suggests, the COT report exposes their commitments.
And these market participants are divided into three trading groups:
commercial- Commercial traders are big institutions who are in the futures market to hedge against risks due to unfavorable price movements that could affect their investments. They only trade for the sake of reducing risk, not for profit.
non-commercial- Non-commercial traders are large speculators who already have a lot of money in the bank, but want to make some more by trading the futures market. Examples of these non-commercial traders include hedge funds, trading advisors, and other huge financial institutions. These institutions follow the major trends religiously. They buy in an uptrend and sell in a downtrend.
non-reportable traders- Non-reportable traders don’t have the heavy bank accounts of commercial and non-commercial traders. They are speculators with smaller accounts who are also looking to make money from the futures market. Retail traders fall into this category.
These major market drivers include institutional traders, hedge funds, big banks, and more. And the weight these traders pull on the markets can sometimes be staggering enough to drive trends. As retail Forex traders, our best bet is to trade like big financial institutions or Non-Commercials.

Emotional Mastery (Controlling Your Emotions)The power of mind discipline... Is really about sticking to your choices. That as a discipline, it is expected to be difficult for shaping oneself to be good if not great doesn't happen overnight neither that it provides an outcome on the onset.
To go through this process needs determination, hard work, patience and time, hence, all these shall allow you to whether to continue to be or to be not.
“The key here is to establish emotional mastery first, getting a control of yourself. Being able to respond in a moment rather than react. And you can do that, you can win”. This is so powerful! Forex trading is 99% mental and only 1% strategy.
In trading you want to always respond not react to what price action is doing. Faced with a set back you are either in emotional control or out of emotional control.
Emotional control:
*How you use your body during a set back? breathing, etc..
*How you use your language during a set back? describe experience
*What we chose to label the set back? positive or negative. What we chose to focus on during that moment.
Trading with leverage increasing emotional control... so less is more in Forex trading until you 100% understand. If you have emotional mastery prior to trading this will give you a foundation of calmness and balance from which to fall back on, during losing or set back in trading.

Trading Psychology Is Worth 95% To Overall Failure or SuccessThe Cold Hard Truth
"You Are You're Own Worst Enemy"
You will probably develop technical skills required in placing trades and learning money management. But you constantly end up sabotaging yourself.
What Is Trading Psychology?
Knowing when to quit and when to push
Using a stop losses
Hitting targets
Controlling greed, fear and hope
*Discipline, Discipline, Discipline!
If you want to be 10% successful FX traders then do the following: Have a trading plan and view, have money management rules, have emotional control, each trade is unique and has nothing to do with last trade, you do not revenge trade, you only trade during certain times not 24/7 & review trade results.
Do opposite of above if you are part of the FOMO traders whom do not treat Forex trading as a probability based business but as gambling.
Note: If a Forex trade is not doing what and when you want it too, then FIRE it ( get out of it), you are the BOSS.
Have a detailed trading plan. More specifically have a detailed set of money management rules within a trading plan to take control over EMOTIONS.

Using Correlations to Predict Markets: Review & DiscussionSeveral months ago, I posted the original idea (see related) when I thought that markets were preparing for major asset rotation. Instead, it seems that we only got a preview of the real thing. Meaning, that Bitcoin had a major selloff right around the time of the first post, but it wasn't severe enough to drastically shift the major asset classes.
Right now, I feel a similar type of paradigm shift is coming, so I wanted to review some key points that I've gathered since monitoring this correlation study. The major takeaways are listed in the top part of the chart and the updates to what the correlations with Gold could mean for each asset class are shown in the bottom sections, respectively.
In my opinion, not much has changed regarding the future direction of the various asset types, with the exception of USD. I think that as of today, inflation will get its recognition as a potential destroyer of wealth and will lead to mass exodus from risk assets. The reasons for this are too many to include and are beyond the scope of this post. The main point of this is that I believe that due to the bizarre and artificial economic landscape painted by the Fed, that inflation will be viewed as a harbinger for risk assets, before it is considered an "invisible tax" on the USD, which would lead to broader questions concerning its purchasing power.
The reason for mentioning this inflation belief is that we find ourselves in a unique situation whereby there are only two main asset types that are "undervalued": 1) USD, 2) Gold. Ironically, these two things should be polar opposites; yet it is now undeniably true (based on recent correlation studies), that the two move in tandem when correlated, and have been such more often than not over the past several years.
Lastly, I would strongly recommend keeping tabs on USD/Gold corr going forward, since it can really help to find true direction when financial markets unravel.
-Pig/USD
TVC:GOLD
TVC:SPX
TVC:DXY
CURRENCYCOM:OIL_CRUDE
BITSTAMP:BTCUSD

Forex Word Find (Enjoy)18 Words Related To Forex (Enjoy). These are Forex related words which you need to understand to profit and survive trading Forex for life.

The Safest Way to Short The Stock MarketIn this video we explain Inverse ETFs as a tool to gain short exposure to the stock market. These can be used as a tool to profit directly from market or as a hedge to protect your stock portfolio in times of market volatility.
Let us know your thoughts in the comments below! Have you ever invested using one of these ETFs?

Comparing Traders: the FOMO effectFOMO Trading vs Disciplined Trading: THE CYCLE (chart)
The process of placing a trade can be very different depending on the situation in hand and the factors that are driving a trader’s decisions. (On Chart example) Here is the journey of a FOMO trader vs a disciplined trader – as you will see, there are some fundamental differences that can lead to very different outcomes.
DAILYFX ANALYSTS SHARE THEIR FOMO EXPERIENCES
Traders of all levels of experience have dealt with FOMO, including our DailyFX analysts:
“Trade according to your strategy, not your feelings” – Peter Hanks, Junior Analyst
“Strategize. Execute. Stick to the plan and don’t be greedy. All types of traders make money; pigs get slaughtered” – Christopher Vecchio, Senior Strategist
“Trade decisions are not binary, long vs. short. Sometimes doing nothing is the best trade you can make” - IIya Spivak, Senior Currency Strategist
“If you don’t deal with and temper FOMO in trading – it will deal with you” – James Stanley, Technical Strategist
If you do not have a trading plan, trading strategy, trading edge in Forex trading- you are leaving trading to happenstance instead of controlling your probables and treating Forex trading like a business. This is not a sprint race but a marathon race. Forex trading outcome is up to you alone.
