ADA: The Setup Is HerePrice just rallied 5.89% to $0.3814, which looks bullish on the surface. But here's the conflict: we've got a confirmed CHoCH Bearish signal—structure just flipped downward despite the swing trend still reading bullish. When structure and trend disagree, I'm paying attention to structure. It's telling us what's happening right now, not what happened 20 bars ago.
1. THE TECHNICAL REALITY 📉
• Stochastic hit 96.8—deep overbought territory
• Price kissing upper Bollinger Band at $0.3822
• 6.8% upper wick on current candle = sellers showed up at these highs
• Volume 174% above average confirms participation, but the wick formation suggests distribution, not accumulation
• Trading in discount zone below equilibrium ($0.4271), but that doesn't make this bullish—it just means we're in the lower half of a range that could become the upper half of a new, lower range
2. THE INDICATORS ⚖️
Bearish Signals:
• CHoCH Bearish confirmed—market structure flipped downward
• Stochastic 96.8 (extreme overbought)
• Price rejected at upper Bollinger Band with 6.8% wick
• Bearish order block overhead at $0.3915-$0.3780 (supply zone)
Bullish Signals:
• RSI 57.6 (neutral, not oversold)
• MACD showing bullish momentum (weak but present)
• Price above both EMA20 and EMA50
• Swing trend still technically bullish
The Conflict:
Structure says down, momentum says up. This is why my confidence is 68%, not 85%. The setup has edge, but it requires confirmation—don't front-run the rejection.
3. THE TRADE SETUP 🎯
🔴 Scenario A: Rejection & Continuation Lower
• Trigger: Bearish rejection at $0.3915 bearish OB (watch for engulfing candles or strong wicks)
• Entry: Confirmation of rejection in supply zone $0.3915-$0.3780
• Target: $0.3463 (swing low support)
• Stop: 4H close above $0.3915 (thesis invalidated)
• Secondary Support: Ascending trendline at $0.3500 if $0.3463 breaks
🟢 Scenario B: Bullish Reclaim
• Trigger: 4H close above $0.4554
• Result: CHoCH Bullish confirmed—bearish setup off the table
• Invalidation: Entire bearish thesis breaks above $0.3915
MY VERDICT
The probability favors a rejection and move lower. We're trading the lower boundary of a descending channel with supply overhead and overbought readings at resistance. But this isn't a slam dunk—wait for price to show its hand at that bearish OB. Risk management is critical: your invalidation is crystal clear at $0.3915.
Market insights

Cardano: Final Retest of Demand Before Parabolic Leg?This weekly BINANCE:ADAUSDT idea maps out a possible end‑of‑cycle accumulation inside the large red demand box that has held price since 2023. I work with this fib levels since top in 2021.
Price is retesting this zone while still trading under the long‑term descending trendline, (line chart) creating conditions for a potential macro breakout once that line is reclaimed and flipped to support. The dashed path outlines an impulsive leg toward the mid‑range around 1.30–1.95, (to 0.5 of fib Weekly) followed by higher Fibonacci extensions up to the 1.618 at roughly 4.55, with invalidation below the lower boundary of the demand box

ADA going to break channel resistance and hit 0.85$ soonAs observed on the chart, ADA is approaching the upper boundary of its current channel structure. A decisive breakout above this level—preferably accompanied by rising trading volume could signal a shift in momentum and potentially trigger a significant upward impulse.
In such a scenario, the next key technical target would be projected near the $0.85 level, based on measured move calculations from the breakout point. Traders should monitor price action closely for confirmation of sustained buying interest before anticipating extended follow-through.

Cardano ($ADA) – Weekly Accumulation Box Setup📊
ADA is forming a familiar accumulation box near key support at $0.29–$0.37, similar to the breakout seen in 2024.
If the pattern repeats, potential bullish targets are:
🎯 T1: $0.7881
🚀 T2: $1.1418

ADAUSDT LONG SIGNAL
---
📢 **Trade Idea – ADA/USDT**
📈 **Position Type:** LONG
💰 **Entry Price:** **0.3557**
🛑 **Stop-Loss:** **0.3481**
---
🎯 **Take-Profit Targets (Partial Exits):**
• **TP1:** 0.3608
• **TP2:** 0.3674
• **TP3:** 0.3740
• **TP4:** 0.3805
• **TP5:** 0.3909
---
📊 **Timeframe:** 15m
⚙️ **Suggested Leverage:** 3×5 ,10
---
🧠 **Technical Analysis**
Price is breaking above a descending trendline after a prolonged consolidation.
The structure shows higher lows forming, indicating bullish momentum building up.
Targets are aligned with key resistance and liquidity zones above the range.
---
⚙️ **Trade Management Plan**
✔️ Take partial profit at TP1
✔️ Move Stop-Loss to Break-Even after TP1
✔️ Secure profits gradually at higher targets
✔️ If a 15m candle closes below **0.3481**, the setup is invalid
---
⚠️ **Risk Disclaimer**
This is not financial advice.
Always manage your own risk.
Capital protection comes first.
---
— **mastercrypto2020*

Cardano road map (6h) !After the drop, the price can slightly bounce back up if buyers support it and we have a price correction. If the red trendline is broken, the price can move to the ranges we have specified.

#ADA//USDT Spot LONG #ADA
The price is moving in a descending channel on the 1-hour timeframe. It has reached the lower boundary and is heading towards breaking above it, with a retest of the upper boundary expected.
We have a downtrend on the RSI indicator, which has reached near the lower boundary, and an upward rebound is expected.
There is a key support zone in green at 0.3558. The price has bounced from this zone multiple times and is expected to bounce again.
We have a trend towards stability above the 100-period moving average, as we are moving close to it, which supports the upward movement.
Entry price: 0.3690
First target: 0.3741
Second target: 0.3842
Third target: 0.3976
Don't forget a simple principle: money management.
Place your stop-loss order below the green support zone.
For any questions, please leave a comment.
Thank you.

Alts are in one of the great places to buy Absolutely not a financial advice, but all coins are really in a great position to have an eye on a good ones. Cardano also on a weekly timeframe looking good sarcastic RSi Is in the crate position to bring the momentum to the market in next coming weeks similar things happen with a bitcoin for me. It’s a great time to buy.

$ADA 1H CHART UPDATE
📌 CRYPTOCAP:ADA USDT is falling rapidly. If the price is rejected again from the Resistance zone above, the price will fall further ✅
📌There is a good strong support zone below. I have marked it in green. From that level, CRYPTOCAP:ADA can turn bullish again. Be careful about that level 💣🔥
#ADA #Cardano #CryptoTrading #TechnicalAnalysis #Altcoins #TradingView #1H #CryptoCharts #ChartAnalysis

ADAUSDT: Bullish Push to 0.45?BINANCE:ADAUSDT is eyeing a bullish rebound on the 4-hour chart , with price forming higher lows after touching the downward trendline and cumulative long liquidation zone, converging with a potential entry area that could ignite upside momentum if buyers defend against short-term dips. This setup suggests a reversal opportunity amid recent downtrend, targeting higher resistance levels with strong risk-reward .🔥
Entry between 0.3780–0.3880 for a long position. Targets at 0.43 (first), 0.45 (second). Set a stop loss at a daily close below 0.37 , yielding a risk-reward ratio of approximately 1:2.5 to first target and up to 1:3.5 overall . Monitor for confirmation via a bullish candle close above entry with rising volume, leveraging the pair's momentum post-rebound.🌟
📝 Trade Setup
🎯 Entry (Long):
0.3780 – 0.3880
(Entries within this zone are valid with proper risk & capital management.)
🎯 Targets:
• 0.43 (first)
• 0.45 (second)
❌ Stop Loss:
• Daily close below 0.37
⚖️ Risk-to-Reward:
• Up to 1:3.5 overall
💡 Your view?
Does ADA hold this demand zone and push toward 0.45 — or is this rebound just a dead-cat bounce before another leg lower? 👇

Cardano Reversal Incoming?Hey traders,
After a tough 2025 (-70% YTD), Cardano is flashing one of the strongest setup I've seen for a reversal.
Why I'm buying ADA now:
Weekly Fibonacci Perfection: Price is hugging the 1.0 retracement level (~$0.37) from the recent swing high – this has acted as major support multiple times. Holding here = classic bottom formation. (Check the weekly chart – we're right on it!)
Undervalued AF: At ~$0.37–$0.38, we're at levels not seen since early cycle lows. Heavy realized losses in December ($900M+ capitulated) means sellers are exhausted – prime time for accumulation.
Friday Price Action = Strong Buyers Showed Up: Last Friday's candle defended the lows hard, closing with conviction. Volume picked up on the bounce, and we're seeing exchange outflows + whale adds. Reversal signals like TD Sequential buys and oversold RSI divergence are aligning.
Short-term: Watching for a break above $0.42–$0.45 resistance for confirmation. If we hold $0.36–$0.37 support, targeting $0.50–$0.54 next (prior highs), then $0.70+ if momentum kicks in.
Long-term still bullish with upgrades - Key Catalysts for 2026
Ouroboros Leios (Q1 rollout): Major consensus upgrade for 1,000+ TPS scalability while maintaining decentralization.
Midnight mainnet (early 2026): Privacy sidechain with selective disclosure, potentially boosting cross-chain adoption and NIGHT token synergy.
Bitcoin DeFi integration and tier-1 stablecoins (USDT/USDC): Aimed at deepening liquidity and TVL growth.
Systemic resilience focus, governance maturity, and treasury-funded initiatives (e.g., Venture Hub, DeFi liquidity injections).
Not financial advice , manage risk! What's your take on ADA here?

Cardano (ADA): Smaller Timeframes Are Giving Us a Long SetupADA looks decent where we are seeing a good R:R setup forming on the daily timeframe, yet on smaller timeframes we are also seeing a smaller 10% upside movement to form here so that's what we are looking for.
More in-depth info is in the video—enjoy!
Swallow Academy

ADA to lift off for Wave 3 soon?ADA CARDANO's treasury-backed push into stable coins is a core part of Cardano's 2025–2026 strategy to boost adoption.
The trade setup looks like a broad wave (1), with the 2nd EW corrective phase.
It looks like a Wave (3) Push is coming to hopefully smash through the last ATH of $3.09 US.
ADA / BTC is also showing signs of a potential reversal soon.

ADA/USDT | Cardano Pulls Back After the Rally! What's Next?CRYPTOCAP:ADA pushed all the way to $0.485 before getting hit with a sharp correction and right now price is trading near $0.40 which is roughly a sixteen percent drop from the recent high. Nothing major has changed in the broader structure because the key zone has always been the $0.32 to $0.36 demand range. If ADA drops into that area again I expect a fresh wave of buyers to step in just like the previous reactions.
For now I want to see if momentum cools down a bit more and whether ADA will revisit the deeper demand levels. That is still the zone where the next strong bullish leg can start building again.
Please support me with your likes and comments to motivate me to share more analysis with you and share your opinion about the possible trend of this chart with me !
Best Regards , Arman Shaban

$ADAUSDT — Buyers Step In,Upside Targets $0.42 & $0.46 in Sight!BINANCE:ADAUSDT has pulled back into a key demand and entry zone at $0.3850 – $0.3750 on the 4H timeframe, where price is reacting after a strong sell-off. This area aligns with previous structure support and is acting as a potential base for buyers.
As long as price holds above this zone, upside continuation is favored with targets at $0.4200 (TP1) and $0.4600 (TP2).
A clean break below $0.3600 would invalidate the setup and signal further downside risk. Risk is clearly defined, making this a well-structured long opportunity.
#ADAUSDT #ADA #Cardano #CryptoTrading #Altcoins #PriceAction

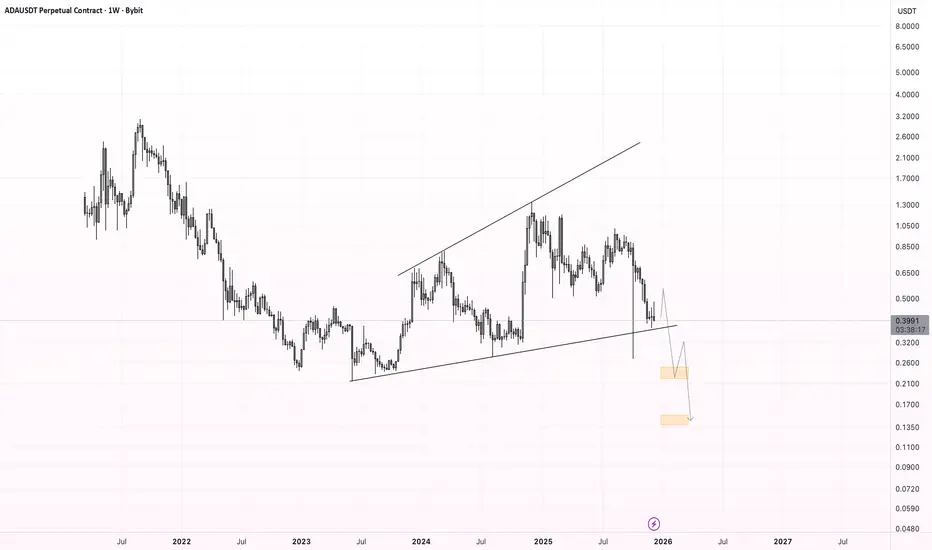
ADA - Bearish Expanding TrianglePrice is trading within a broadening (expanding) triangle , with higher highs and lower lows indicating increasing volatility and distribution. The structure favors a bearish resolution , and I’m expecting a breakdown below the lower trendline to confirm continuation to the downside.
Expectations:
Breakdown from the expanding triangle → acceleration lower.
Downside Targets:
🎯 $0.25
🎯 $0.15
As long as price stays below the upper boundary, the bearish scenario remains dominant.
CARDANO (ADA) STRATEGY: TRADING THE ORDER BLOCK RANGECardano (ADA) is currently trapped in a clearly defined trading range, bouncing between institutional supply and demand zones. As shown on the chart, price action is respecting the "Order Block" (OB) levels perfectly, giving us a clear roadmap for the next few days.
We are currently analyzing three critical areas of interest:
THE BULLISH ORDER BLOCK (DEMAND ZONE) Zone.
We are currently testing this zone. This represents the "Demand Floor" where buyers have historically stepped in aggressively.
The Setup: Price has retraced fully into this block. We are looking for a reaction or a lower timeframe reversal pattern (like a break of structure on the 15m chart) to confirm that bulls are defending this level.
The Trade: Long positions taken here offer a high Risk-to-Reward ratio because your invalidation point is very close (just below the box).
THE FAIR VALUE GAP (FVG) - FIRST TARGET Zone
Fair Value Gaps often act as magnets for price. If the Bullish OB holds, the first logical target is this imbalance.
Expectation: Price is likely to be drawn up to fill this gap. This is a perfect area to take partial profits or move Stop Losses to breakeven.
THE BEARISH ORDER BLOCK (SUPPLY ZONE) Zone: (The Red Box)
This is the major resistance ceiling.
The Strategy: This is the ultimate Take Profit zone for longs. Conversely, if price reaches this red box and shows rejection wicks, it becomes a high-probability SHORT entry to play the range back down.
TRADING PLAN
Scenario A: The Bounce (Bullish)
Condition: Price holds above $0.3845 and creates a bullish candle close on the 4H.
Action: Enter Long.
Target 1: (FVG Fill).
Target 2: (Bearish OB Test).
Stop Loss: A daily close below $0.3638 invalidates the demand zone.
Scenario B: The Breakdown (Bearish)
Condition: If the Bullish OB fails and we get a confirmed close below $0.3630
Action: The setup is invalidated. We would then look for a retest of the broken level to go Short, targeting lower liquidity levels.
SUMMARY
The market is simple right now: We are at Support (Bullish OB). Until this level breaks, the bias at this specific price point is to look for Longs targeting the liquidity voids above (FVG).
Are you buying the dip at this OB, or waiting for a breakdown? Let me know in the comments!
Disclaimer: This analysis is for educational purposes only. Cryptocurrency trading involves high risk. Always manage your risk properly.


#ADAUSDT 4H ChartPrice also tested the extreme demand zone where we are currently seeing a small bullish reaction. Price is expected to continue its bullish movements from that area aiming to liquidate the previous swing high.


Cardano (ADA): Trendline Breakout vs. The "Golden" Buy Zone 🚀 Cardano (ADA): Trendline Breakout vs. The "Golden" Buy Zone
Cardano ( CRYPTOCAP:ADA ) is currently compressing under a **major descending trendline**, squeezing price action into a pivotal decision point. As we approach the end of 2025, the market structure is revealing two distinct scenarios for traders.
We are watching two key areas of interest on the chart:
**1. The "Red Box" (Immediate Resistance & Breakout)**
Price is currently testing this descending resistance. A clean Daily Candle close above this trendline—and specifically clearing the "Red Box" supply zone—would confirm a structural Break of Structure (BOS).
**Strategy:** Aggressive traders can look for a "pilot buy" (small position) on the breakout, or wait for a retest of the trendline as support to add size.
**2. The "Yellow Zone" (Main Accumulation Area)**
If the breakout fails or we see a broader market correction, this lower zone represents the **high-probability institutional entry**. This area aligns with historical liquidity where smart money has previously defended the price.
**Strategy:** This is our **"Main Buy Zone."** If price wicks down here, we are looking to deploy larger capital for swing trades targeting the 2026 recovery.
**💡 Fundamental Catalysts (Why Now?)**
**Midnight Sidechain Launch:** The recent integration of the Midnight privacy chain (Dec 8, 2025) provides a fundamental tailwind that could fuel the breakout scenario.
**Treasury Growth:** The 70M ADA allocation for ecosystem infrastructure is a long-term bullish driver.
**🎯 Trade Setup Summary**
**Scenario A (Bullish Breakout):** Break trendline + Red Box → Buy small → Target $0.60+.
**Scenario B (Bearish Rejection):** Rejection at Red Box → Wait for Yellow Zone ($0.32-0.35 region) → **HEAVY BUY**.
**⚠️ Disclaimer:**
*This analysis is for educational purposes only. I am not a financial advisor. Trading cryptocurrencies involves high risk. Please do your own research (DYOR) before making any investment decisions.*
*Agree with this analysis? Drop a like and let me know in the comments if you are waiting for the Yellow Zone or buying the Breakout!* 🚀

CARDANZODear Traders
here you ada clear down trend but be careful of fake outs
lets see if this can play out on daily i see it can move up little bit before going to the target

ADAUSDT – Move Down Before FOMC?Alright traders, today is FOMC day,
which means the market is going to do its usual thing:
act weird, confuse everyone, and ignore all technicals. 😂
But before the chaos at 20:00?
We’ll probably see a slight move down —
a little dip, a little liquidity grab,
just the usual pre-FOMC warm-up routine.
Nothing guaranteed (it’s ADA, after all),
but the idea is simple:
👉 small push down
👉 then wait for FOMC fireworks
👉 try not to get rekt in between 😅
Let’s see how it plays out — stay safe, legends! 🚀📉🔥
