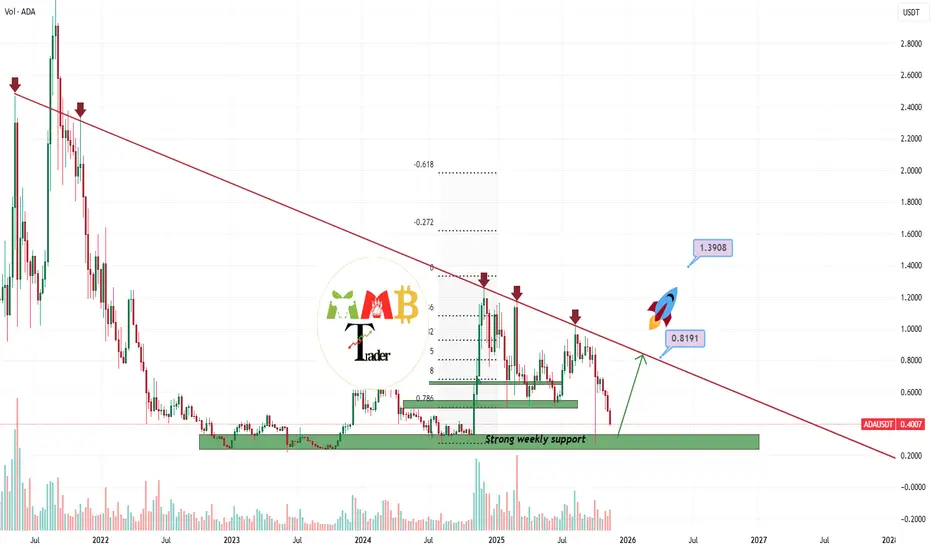
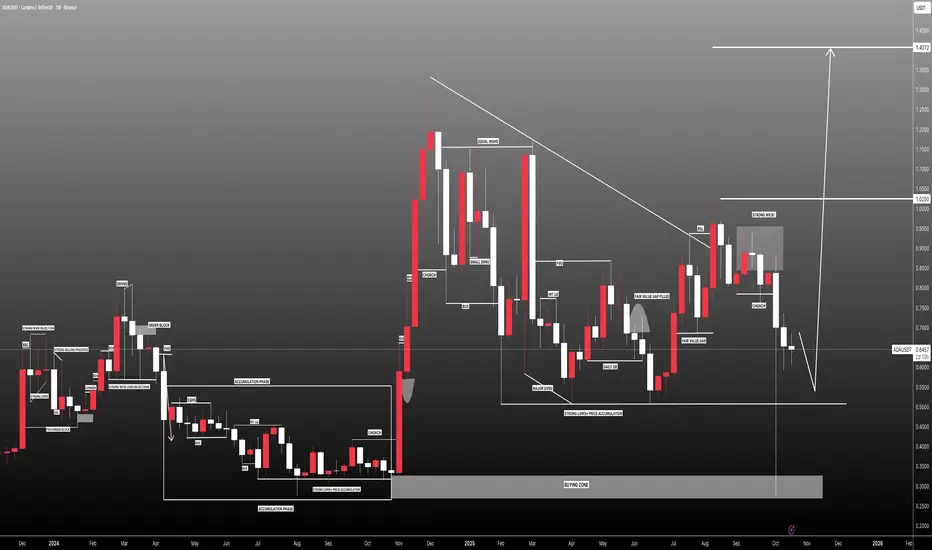
ADAUSDT first target to hit is now +100% (0.80$)ADAUSDT is currently trading within a bearish market structure, experiencing significant downward pressure. However, it's crucial to note that the asset is approaching a major weekly support level. From a technical perspective, the current price zone around $0.40 could present a potential accumulation opportunity with favorable risk-reward characteristics.
The primary scenario envisions a technical rebound toward the $0.80 level, which coincides with a key descending trendline resistance. A decisive breakout above this resistance zone with confirmed volume would be necessary to validate any sustained bullish reversal and potentially initiate further upward momentum.
DISCLAIMER: ((trade based on your own decision))
<<press like👍 if you enjoy💚
Trade ideas
ADA/USDT | Cardano Slides to 0.38 and Bears Keep Pushing!By analyzing the CRYPTOCAP:ADA chart on the 3 day timeframe, we can see that price finally dropped to 0.38, which confirms the bearish pressure we talked about earlier. ADA is now trading near 0.40 and the chart still looks weak. Buyers are not showing real strength and momentum is clearly on the sellers’ side.
If the drop continues, the next downside target I am watching is 0.36. Make sure you monitor price reaction at this level.
From my perspective, the 0.32 to 0.36 zone is a possible long term accumulation area for investors who use proper risk management and do their own research (DYOR).
For now the bias stays bearish until ADA reclaims strong levels with real demand.
Please support me with your likes and comments to motivate me to share more analysis with you and share your opinion about the possible trend of this chart with me !
Best Regards , Arman Shaban


ADA - BUY SETUP (NOV 2025)ADA - BUY SETUP (NOV 2025)
ADA is currently at strong support, making it a solid long-term investment. Hold onto it as it has the potential to reach $3.

LongAccording to the analysis of the waves and the help of the Gann method, it can be expected that the price will return to the green zone again.
This is my personal opinion. Please don't use it as your trading criteria. Good luck

Cardano (ADA) – Weekly Technical Analysis
ADA has been moving inside a large Symmetrical Triangle since the 2021 peak — a long-term consolidation pattern that typically leads to a strong breakout once price compression reaches its end.
When observing the major support line of the triangle, the price has shown a clear repetitive behavior:
- First touch of support: Price bounced strongly and reached the red point.
- Second touch of support: A similar reaction occurred, sending the price up to the yellow point.
- Third touch (current position): ADA has returned to the same support level, placing it in the exact zone where previous major rallies began.
So far, the full bullish reaction hasn’t happened yet. Based on the pattern structure and historical behavior, the next logical move is:
📌 A potential rally toward the green point — the previous ATH zone.
With the triangle nearing its apex and the altcoin cycle approaching, the probability of a strong upward breakout increases significantly.

ADA USDT LONG SIGNAL---
📢 Official Trade Signal – ADA/USDT
📈 Position Type: LONG
💰 Entry Price: 0.4134
---
🎯 Take-Profit Targets (Partial Exits):
TP1 = 0.4230
TP2 = 0.4305
TP3 = 0.4370
TP4 = 0.4445
TP5 = —
---
🛑 Stop-Loss: 0.4045
📊 Timeframe: 15m
⚖️ Risk/Reward Ratio: 3.55
💥 Suggested Leverage: 5× – 10×
---
⚙️ Trade Management Rules
✔️ Take partial profit at TP1
✔️ Move SL to Break-Even once TP1 is hit
✔️ Trail Stop-Loss as price approaches each next target
✔️ Avoid re-entry if SL is hit
✔️ Always confirm market structure before entering
---
⚠️ Risk-Management Note
Moving SL to Break-Even after TP1 is standard professional practice.
If price returns and stops you out at BE, this is not a loss — it is controlled risk protection.
---
📌 TradingView Hashtags
#ADAUSDT #ADA #CryptoSignal #LongSetup #TradingView
#TechnicalAnalysis #FuturesTrading #Altcoins

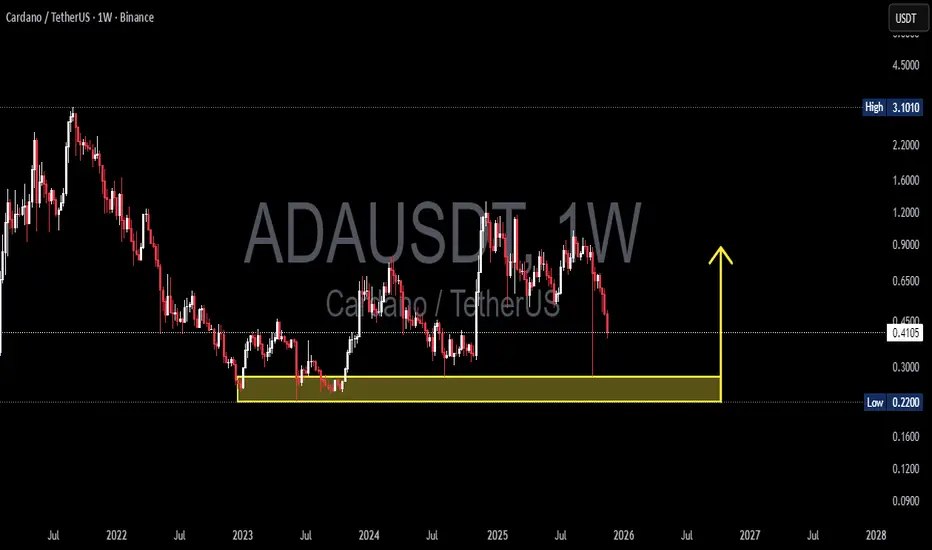
ADA/USDT — Major Reversal or Deep Breakdown?ADA/USDT on the weekly timeframe has returned to one of the most decisive zones since 2022.
The 0.275–0.22 region is not just another support — it is a historical demand and accumulation block where major reversals have repeatedly formed.
This week, ADA once again tapped this zone with a long downside wick, signaling a massive liquidity sweep. This is a clear indication that larger players are active here, collecting liquidity before choosing the next major direction.
This chart doesn’t reflect a simple pullback — it reflects the early stages of a major battle between long-term buyers and the dominant sellers who have controlled the trend since 2021.
---
🔥 Key Pattern & Market Dynamics
1. Long-term downtrend structure
Since the macro top, ADA has continued forming lower highs, maintaining bearish pressure in the weekly structure.
2. Strong accumulation demand (0.275–0.22)
This area has produced three major reversals in the past.
The latest reaction suggests either:
A liquidity hunt before a potential rebound, or
The beginning of a deeper breakdown if buyers fail to defend it.
3. Increased volatility
A wick of this size is rarely random.
It often precedes large directional moves, especially on the weekly chart.
---
📈 Bullish Scenario (If the Zone Holds)
A bullish continuation requires clear conditions:
✔ Strong rejection from 0.275–0.22
✔ Weekly close above the pivot zone at 0.40–0.45
✔ Formation of a higher-low structure
If confirmed, ADA may begin a structural trend reversal with:
Target 1: 0.65
Target 2: 1.00 – 1.20 (if volume expansion supports the breakout)
This would mark a shift from long-term weakness to medium-term recovery.
---
📉 Bearish Scenario (If the Zone Breaks)
A weekly close below 0.22 would be a significant bearish signal:
Historical demand fails
Market structure breaks down
A deeper markdown phase begins
Downside targets:
0.16 — next major psychological support
0.09 — historical accumulation zone
A loss of 0.22 would be one of ADA’s strongest bearish confirmations in years.
---
🧠 Core Message for Traders
This is not an ordinary support level —
this is a macro decision point that will define ADA’s direction for months ahead.
ADA now stands exactly where it stood in 2022–2023, and from this zone the market has only two paths:
➡ Hold the historical accumulation zone and reverse upward
or
➡ Break below it and enter a deeper long-term downtrend
Professional traders do not guess —
they wait for the weekly close, analyze volume, and watch how the market reacts to this key zone.
---
#ADA #ADAUSDT #Cardano #CryptoAnalysis #PriceAction #MarketStructure #WeeklyChart #SupportZone #CryptoTrading #CryptoOutlook

ADA USDT LONG SIGNAL---
📢 Trade Signal: ADA/USDT
📈 Position Type: Long
💰 Entry Price: 0.4630
---
🎯 Take-Profit Targets (Partial Exits)
TP1: 0.4710
TP2: 0.4765
TP3: 0.4835
TP4: —
TP5: —
TP6: —
---
0.4550
🛑 Stop-Loss: 0.4625
⚖️ Risk/Reward Ratio: 3.91
💥 Suggested Leverage: 5× – 10×
⏱ Timeframe: —
---
🧠 Technical Analysis Summary
ADA is showing bullish momentum after rebounding from a local support zone around 0.4620–0.4640.
Market structure indicates higher lows forming, suggesting buyers are stepping in.
A push above 0.4710 (TP1) can trigger further momentum toward 0.4765 and 0.4835.
Momentum indicators support continuation as long as price holds above 0.4625.
---
⚙️ Trade Management
Take partial profit at TP1
Move SL to Break Even once TP1 is reached
Trail stop for higher targets
Avoid re-entry if price closes below stop-loss
---
⚠️ Disclaimer:
Educational purpose only — not financial advice. Always manage risk.
---
📌 Hashtags for TradingView
#ADAUSDT #Cardano #CryptoSignal #TradingViewIdeas #Altcoins #TechnicalAnalysis #CryptoTrading #FuturesTrading
---

DeGRAM | ADAUSD seeks to the $0.5 level📊 Technical Analysis
● ADA/USD remains locked within a descending channel, with the price recently rebounding from support near $0.50 but facing strong resistance around $0.60. The structure shows repeated bearish continuations through flag and triangle formations, reflecting sustained selling momentum.
● A rejection from the resistance line could confirm another leg down toward $0.50, the key demand level defining medium-term support.
💡 Fundamental Analysis
● Cardano sentiment remains muted amid declining DeFi inflows and network activity, while broader crypto risk aversion caps upside momentum.
✨ Summary
● Resistance: $0.60. Support: $0.50. Bias remains bearish with potential continuation toward $0.50 after another failed breakout attempt.
-------------------
Share your opinion in the comments and support the idea with a like. Thanks for your support!

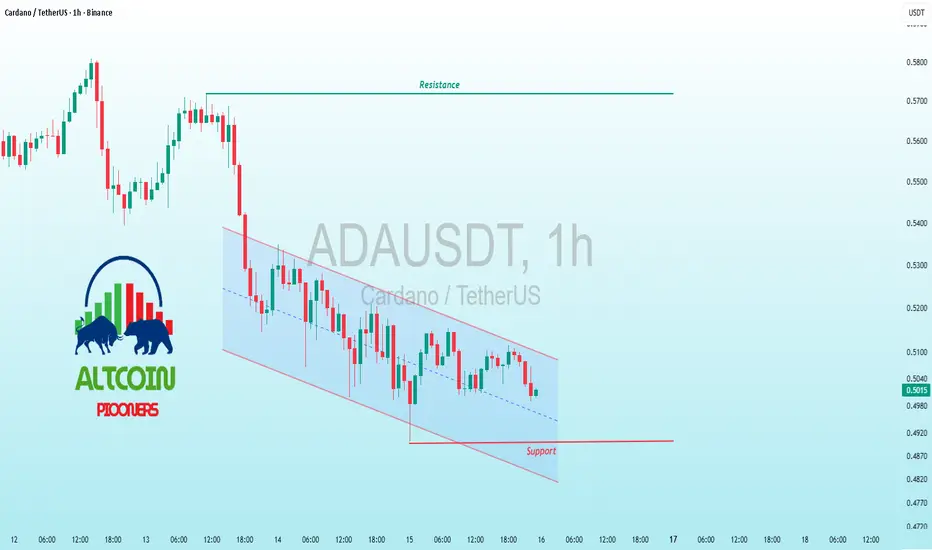
$ADA Cardano Channel Crunch – Stake or Break?BINANCE:ADAUSDT CRYPTOCAP:ADA Cardano Channel Crunch – Stake or Break?
Altcoin Pioneers! 🏔️ ADA/USDT 1H is wedged in this blue descending channel, price slamming into support ~0.487 after a fierce rejection at the upper trendline near 0.52. Cardano's PoS resilience on display, but BTC correlation keeps the pressure cooker boiling – that cyan consolidation box hints at a potential fakeout.
Hold support? Bullish if volume surges on the hammer; RSI at 29 screaming oversold bounce. Breakout above resistance? Epic on Voltaire upgrade vibes, targeting 0.55. Deeper dip risk? Sharp – snap below eyes 0.47 (Fib 0.786), alt purge mode.
Target: Rebound to 0.505 if holds, drop to 0.475 on fail. Tracking: EMA cloud pierce, Williams %R for reversal, and ADA/BTC for independence. Stake smart! 🔒📉
#ADA #Cardano #CryptoAnalysis
$ADA Channel Squeeze – Hold Support for Upside Push?BINANCE:ADAUSDT CRYPTOCAP:ADA Channel Squeeze – Hold Support for Upside Push?
ADA's hugging the lower channel support at 0.50 after a volatile pullback, with volume spiking on the rebound—bullish divergence hinting at reversal.
If it defends here, breakout above 0.60 resistance eyes 0.68 target; failure risks dip to 0.45.
Tracking RSI climbing from 40 (neutral), MACD crossover brewing, and OBV uptick.
Momentum building? 📊🚀
#Cardano #AltcoinAnalysis #TradingView

$ADA Channel Descent – Support Defense Incoming?BINANCE:ADAUSDT CRYPTOCAP:ADA Channel Descent – Support Defense Incoming?
Current trend: ADA's sliding in a clear descending channel from 0.68 peaks, now coiling near 0.535 support—sellers fading with low-volume probes, classic setup for alt rebound vibes 🛡️.
Hold support? Bullish yes; EMA confluence and prior bounces scream strong defense potential.
Breakout above resistance? Watch 0.62 flip—could unleash 6-8% surge to channel top 🚀.
Dip risk? Mild to 0.52 on crack, but oversold caps the pain.
Target: Short-term 0.58 bounce; stretch 0.65 on momentum.
Indicators tracking: RSI (33, oversold snapback), Channel lower bound, and MACD histogram lift 📊.
#ADATrading #CryptoChannel #AltcoinPioneers

$ADA Cardano's Support Stand – Reversal in Play?BINANCE:ADAUSDT CRYPTOCAP:ADA Cardano's Support Stand – Reversal in Play?
Current trend: ADA's testing the 0.534 support floor after a sharp dip from 0.60 resistance—bullish hammers emerging, signaling potential exhaustion in the downside pressure 🛡️.
Hold support? Promising yes; volume drying on reds and price pinning at the zone point to buyers gearing up.
Breakout above resistance? Bullish if 0.60 cracks—unleashing 5-8% rally toward alts recovery 🚀.
Dip risk? Possible to 0.52 on weak close, but divergence limits deeper bleed.
Target: Short-term 0.62 on confirm; aim 0.65 with strength.
Indicators tracking: RSI (38, oversold rebound), MACD zero-line test, and 100 EMA defense 📊.
#ADATrading #CardanoBounce #AltcoinPioneers

$ADA Support Test Passed, Breakout Lurking?BINANCE:ADAUSDT CRYPTOCAP:ADA Support Test Passed, Breakout Lurking? 📊🔮
ADA's 1H trend stays bullish, rebounding sharply from core support ~0.550 with solid volume—buyers locking in!
High likelihood of hold, targeting breakout above 0.615 resistance to 0.65.
Deeper dip risk minimal (watch 0.54), but trail stops.
Eyeing RSI ~54 (upward shift), 50 EMA bounce, and MACD turning green.
Cardano climbing! 🚀
#ADA #CryptoTrading #AltcoinSurge

#ADAUSDT: Two Targets Both Possible, Let's See How Price MoveADAUSDT collapsed following the announcement of new tariffs on China, which caused fear in the cryptocurrency market and affected minor currency pairs. This led to a significant drop in the price of ADAUSDT. A minor decline may occur before the price reverses. There are two potential targets for the price to reach.
Entry area:
- We have identified the key area where a price reversal is likely to occur.
We wish you the best of luck and trade safely.
Team Setupsfx
ADA/USDT | Cardano Climbs 20% – Can Bulls Push It Above $0.70?By analyzing the Cardano chart on the 3-day timeframe, we can see that after dropping to $0.49, the price found strong demand and rallied up to $0.60.
Currently, ADA is trading around $0.58, and we need to see if it can hold above $0.55. If it does, we can expect a bullish continuation toward the $0.70+ levels. This analysis will be updated soon!
Please support me with your likes and comments to motivate me to share more analysis with you and share your opinion about the possible trend of this chart with me !
Best Regards , Arman Shaban

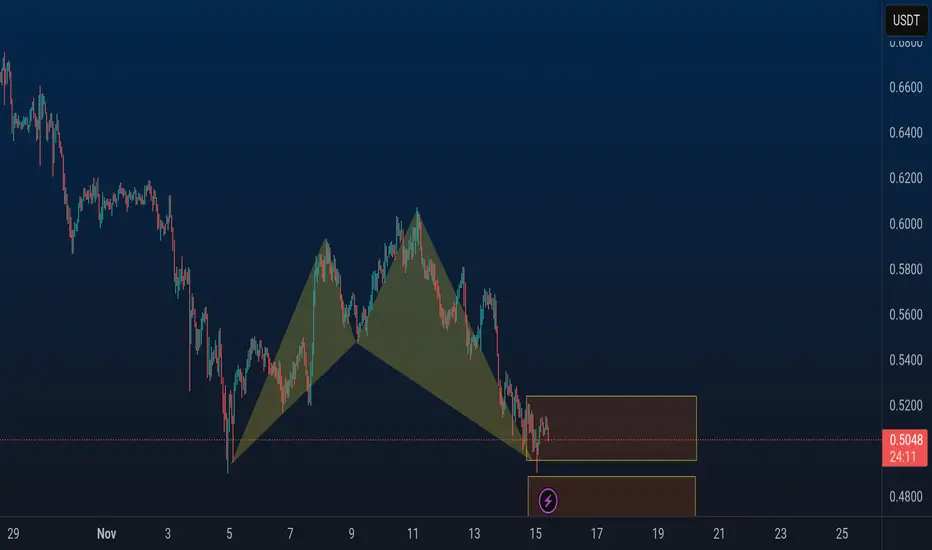
Rising Wedge Forms — Potential Rejection on ADAPrice action is currently trading within a rising wedge pattern, a structure that is typically bearish and often precedes corrective moves.
The market is now testing key resistance, which aligns with both the 0.618 Fibonacci retracement and a lower-high structural barrier, forming a strong confluence zone where rejection is likely.
- Bearish Formation: The rising wedge suggests weakening bullish momentum.
- Resistance Confluence: The 0.618 Fibonacci and lower-high structure align at current resistance.
- Downside Target: A rejection from this zone opens the probability of a rotation toward $0.51 daily support.
From a technical standpoint, this setup indicates that upward momentum is losing strength, with limited space for continuation unless resistance breaks decisively.
If rejection confirms, traders should anticipate a pullback toward $0.51, completing the wedge breakdown and resetting the next major support test.

$ADA Resistance Clash – Breakout or Pullback?BINANCE:ADAUSDT CRYPTOCAP:ADA Resistance Clash – Breakout or Pullback?
ADA's 1H chart pushing bullish, rebounding from support ~0.54 to test resistance at 0.60—successful break targets 0.62 fast, but rejection could see dip back to 0.56 on weak volume.
Uptrend resilient.
Key indicators: RSI climbing to 55 (momentum building), 50MA support, MACD bullish signal. 🌿📈
#ADA #Cardano #AltcoinPioneers


ADA Retraces to Key Support | Long Spot OpportunityCardano (ADA) has retraced into a major support zone between $0.50 – $0.52, a level that previously acted as a strong base for bullish moves. This pullback could offer a high-probability long setup, especially if buying volume confirms price stabilization.
🟢 Trade Setup – Long Spot
Entry Zone: $0.50 – $0.52
Take Profit Targets:
• TP1: $0.59
• TP2: $0.67
• TP3: $0.85
Stop Loss: Just below $0.485
