Algorand ALGO USDT Upcoming TAKE PROFIT POINTSHi Traders, Investors and Speculators of Charts📈📉
New Year 2026 loading....🥂🥳
Algorand is a decentralized network built to solve the Blockchain Trilemma of achieving speed, security, and decentralization simultaneously.
Algorand is designed to be a payments-focused network with rapid transactions and a strong focus on achieving near-instant finality which aims to be processing over 1,000 transactions per second (TPS) and achieving transaction finality in less than five seconds.
As a public smart contract blockchain that relies on staking, Algorand is also capable of hosting decentralized application (dApp) development and providing scalability. Rising gas fees on Ethereum have led many dApp developers and decentralized finance (DeFi) traders to look for alternative blockchain solutions. Algorand is capable of managing the high-throughput requirements of widespread global usage and a variety of use cases.
Technical Chart Analysis:
Algorand is still "in prison", but holding the 50d Moving Averages is the first step towards a new bullish cycle. Look at all of this upside potential!
Technical indicator Analysis:
If ALGO can get back ABOVE the 50d moving averages (0,18), that is when we can expect to see some serious bullish/parabolic price action.
You don't have to wait until then to trade algo. In the daily timeframe, there are some great setups for those who have a bit of patience, with low buy and high sells from 15% - 30% over a few weeks (in both shorts and longs).
Tis market is still moving, even though it doesn't neccesarily seem like it from a macro outlook.
Trade ideas

$algo sub 1550 invalidation targeting all time highs
well if you look at it that way its a nice risk reward
realistically 65-75c zone is where this should head up to from here have not checked domi but this pirce is too good to ignore
all the best

CRYPTO IN REVERSAL TERRITORY!The market is dumping, sentiment is bearish, and everyone thinks we’re heading into a full breakdown — which is EXACTLY why I’m getting more bullish. STOP LISTENING TO CRYPTO INFLUENCERS!
The charts are telling a story…
And it’s the opposite of what the crowd believes.
In today’s video I break down:
-Why the current narrative is the biggest signal of a reversal
-ETH’s structure and what a bounce would look like
-BTC downside targets
-TOTAL market cap showing hidden bullish strength
-My Top 2 Coins to Buy Right Now
⚠️ Disclaimer:
I am not a financial advisor. The content shared on this channel is for educational and informational purposes only and should not be considered financial advice.
Trading and investing in cryptocurrency involve high risk — you could lose some, or all, of your money. Always do your own research and make sure you understand the risks before making any financial decisions.

$2 BILLION Liquidated in 24 Hours - Whats happening!?We have just seen 2 BILLION liquidated over the last 24 hours and that’s 1 BILLION on BTC alone.
Headlines scream bear market, retail panics, and social media is flooded with fear… but this is exactly the type of environment we want to see.I been saying it over and over again, you guys must be getting sick of it now but I haven’t been more bullish. We have been waiting for these types of moves.
In this video I go over:
- Why this drop is creating maximum fear and confusion and why that’s bullish for us
- Are we ready to reverse?
- Why this panic could set the stage for a major reversal
- Where is the downside LQ?
⚠️ Disclaimer:
I am not a financial advisor. The content shared on this channel is for educational and informational purposes only and should not be considered financial advice.
Trading and investing in cryptocurrency involve high risk — you could lose some, or all, of your money. Always do your own research and make sure you understand the risks before making any financial decisions.

ALGO USDT LONG SIGNAL---
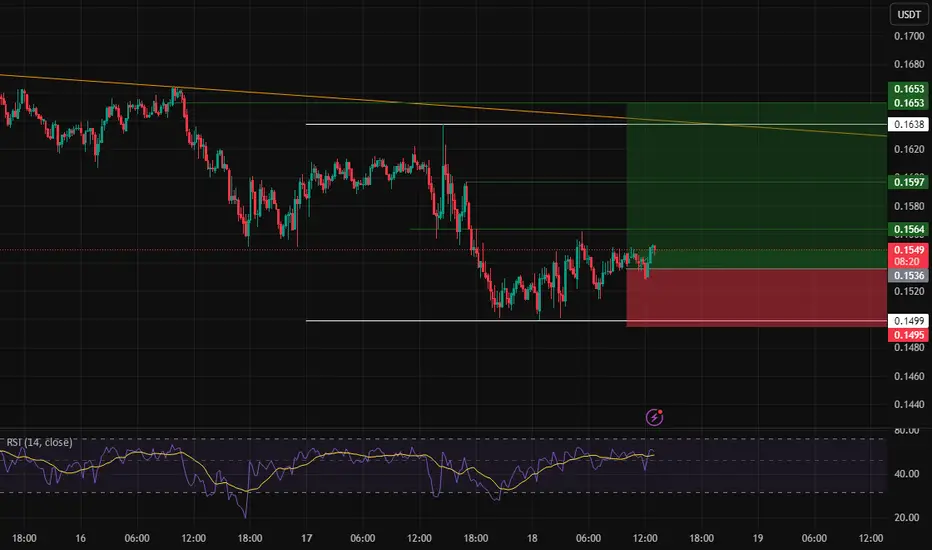
📢 Trade Signal: ALGO/USDT
📈 Position Type: Long
🎯 Entry Price: 0.1536
---
🎯 Take-Profit Targets (Partial Exits)
TP1 = 0.1564
TP2 = 0.1597
TP3 = 0.1650
TP4 = —
TP5 = —
TP6 = —
---
🛑 Stop-Loss: 0.1494
⏱ Timeframe: —
⚖️ Risk/Reward Ratio: 2.85
💥 Suggested Leverage: 5× – 10×
---
🧠 Technical Analysis Summary
ALGO is bouncing from a strong intraday support zone at 0.149–0.151, forming a bullish structure with improving momentum.
The price is trading above short-term liquidity and showing signs of reclaiming the local trendline.
A clean push above 0.1564 (TP1) can accelerate momentum into 0.1597–0.1650.
RSI is building upward strength, suggesting buyers are gaining control.
---
⚙️ Trade Management
Take partial profit at TP1
Move SL to Break Even after TP1 hits
Consider trailing stop to secure further gains
Avoid re-entry if price closes below 0.1494
---
⚠️ Disclaimer
Educational purpose only — not financial advice. Always manage risk.
---
📌 Hashtags for TradingView
#ALGOUSDT #Algorand #CryptoSignal #TradingViewIdeas #CryptoTrading #TechnicalAnalysis #Altcoins #FuturesTrading
---
ALGO Pullback Opportunity – Ready for the Next Leg Higher?After a strong 28% move up from our last call, Algorand (ALGO) has pulled back into a key support zone, potentially setting up for another bullish wave. This type of retracement after a breakout is typical in trending markets and often offers high-probability re-entry points.
📌 Trade Setup:
Entry Zone: $0.15 – $0.16
Take Profit Targets:
→ Tier 1: $0.22 – $0.26
→ Tier 2: $0.28 – $0.33
Stop Loss: Just below $0.13
This setup offers a favorable risk-to-reward ratio, targeting a continuation of the prior move while protecting against deeper downside. Volume confirmation and market conditions should be monitored closely for added conviction.

Algo spot Idea Algo — Long-Term Outlook
At the moment, I see several possible long-term scenarios for ALGO.
On the TradingView chart, I’ve highlighted the key potential bounce zones in green.
I also don’t rule out the possibility that the liquidity marked on Hyblock may simply get taken out first, which could push the price lower before any meaningful reversal.
Because of that, avoid placing limit orders too early.
The safer approach is to wait for:
the weekly candle close, or
a confirmed breakout and clean retest above the triangle’s trendline.

ALGO BUllish Pennantwe've got ALGO inside a pennant formation and let me tell you, it's getting charged up for another leg up. ALGO just recently retested and broke through its trendline resistance, which was previously acting as support before the breakdown. Now, it's making a strong push to break through this bullish pennant, but you need to be careful with your trades, my friends. This is not the time to get reckless with your investments.
And here's the thing, we can't forget about BTC. It's the elephant in the room, and it's the weekend, so you need to keep a close eye on it as well. You know how volatile the crypto market can be, and we can't afford to let our guard down. So, stay sharp, stay vigilant, and make your moves strategically. The name of the game is risk management, and if you do it right, you'll come out on top.

#ALGO/USDT - this will go up#ALGO
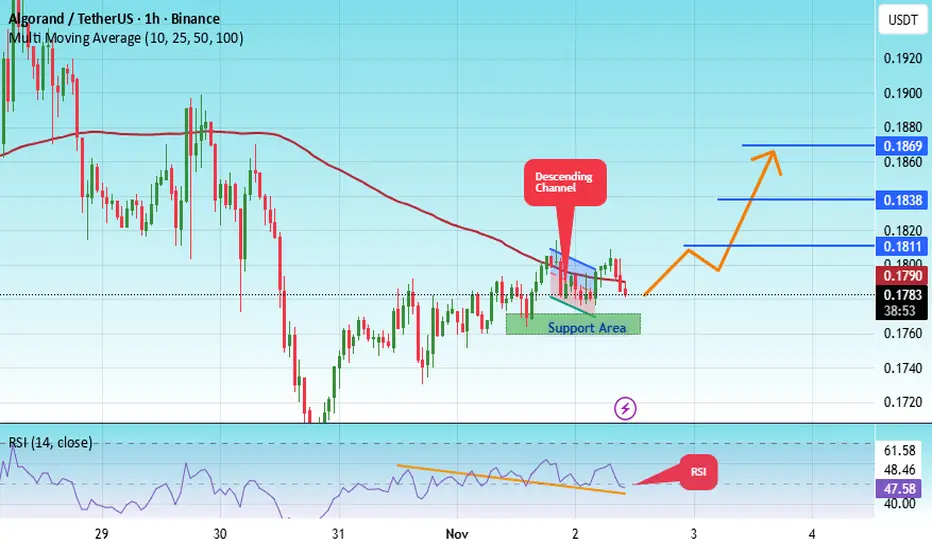
The price is moving within an ascending channel on the 1-hour timeframe and is adhering to it well. It is poised to break out strongly and retest the channel.
We have a downtrend line on the RSI indicator that is about to break and retest, which supports the upward move.
There is a key support zone in green at 0.1764, representing a strong support point.
We have a trend of consolidation above the 100-period moving average.
Entry price: 0.1784
First target: 0.1811
Second target: 0.1840
Third target: 0.1870
Don't forget a simple money management rule:
Place your stop-loss order below the green support zone.
Once you reach the first target, save some money and then change your stop-loss order to an entry order.
For any questions, please leave a comment.
Thank you.

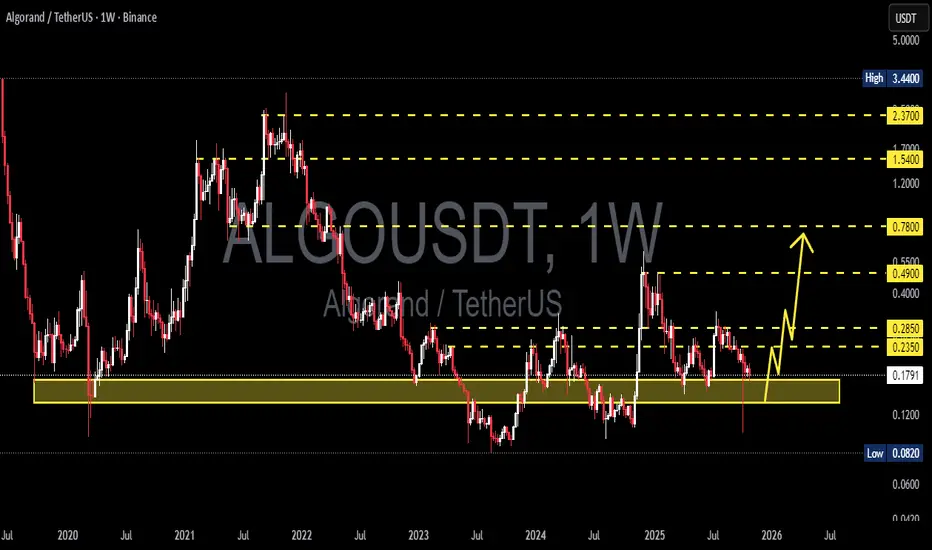
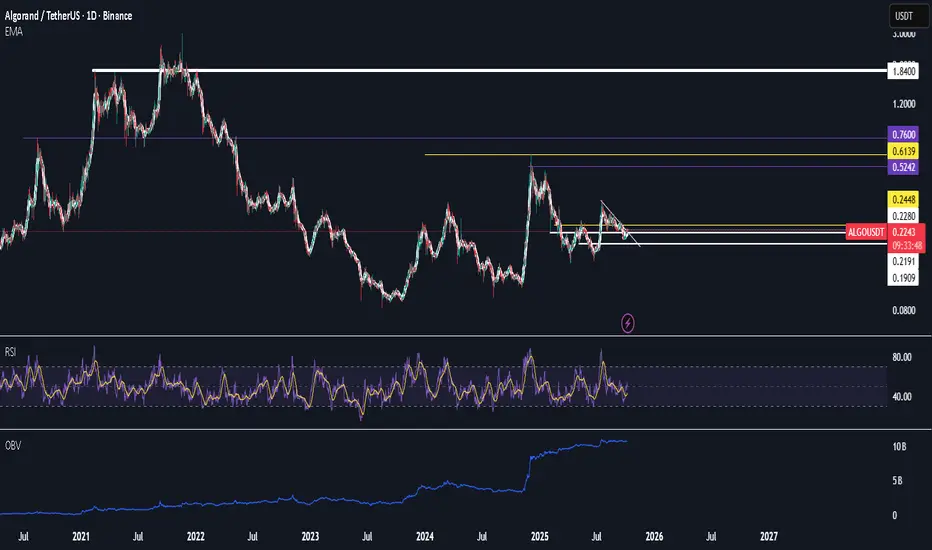
ALGO/USDT –Between Capitulation or Massive Reversal Zone?ALGO is now trading at one of the most decisive zones in recent years, a major historical support area between 0.17–0.135 — a battle zone between buyers and sellers since 2020.
Each time the price tapped this area, the market reacted with a strong reversal, signaling heavy accumulation by smart money. However, this time, selling pressure appears stronger, creating tension between a potential massive reversal or a final breakdown before a new redistribution phase.
The weekly structure continues to print consistent lower highs since 2021, confirming that the macro trend remains bearish. Yet, the recent price rejection around 0.135–0.17 and the presence of a liquidity sweep below that zone suggest that many retail stop-losses have been taken — possibly setting the stage for a mean reversion rally.
---
🟢 Bullish Scenario: “The Bottom Reclaim”
Confirmation only occurs if weekly close > 0.235 with strong volume.
A breakout above this level would signal a structural reclaim and open the path for a rally toward 0.285 – 0.49 as the primary targets.
If momentum strengthens, further expansion toward 0.78 – 1.54 remains possible (the former 2021–2022 distribution area).
Aggressive traders may consider accumulation within 0.17–0.135, with a tight stop below 0.12, aiming for a minimum 1:3 risk-reward ratio.
💡 Additional bullish narrative:
If the crypto market rotates capital from major layer-1 assets into mid-cap plays, ALGO could become one of the “revival candidates,” backed by strong liquidity and a recognizable brand.
---
🔴 Bearish Scenario: “Break the Floor”
If weekly close < 0.135, it would confirm a breakdown of multi-year structural support.
The next logical downside target lies around 0.082, the historical low and the last visible demand zone before uncharted territory.
Such a breakdown usually triggers a capitulation event, where short-term volume spikes due to panic selling.
In an extreme case, ALGO could establish a new structural range below 0.10 before attempting a long recovery.
💡 Additional bearish narrative:
If macro pressure persists (e.g., BTC retraces or USDT dominance rises), ALGO might experience a “final flush” before forming a structural bottoming pattern.
---
📊 Key Structure & Technical Patterns
Primary pattern: Long-term Accumulation Range with repeated liquidity sweeps below support.
Macro trend: still bearish, though momentum is weakening — visible through declining volatility and volume contraction.
Potential reversal trigger: a strong bullish engulfing candle from within the yellow box.
Volume divergence: watch for rising volume around 0.15–0.17 — it often signals silent accumulation by smart money.
---
🧭 Conclusion
ALGO is standing at a critical multi-year decision zone — it could either mark the beginning of a multi-year reversal or the final breakdown toward new lows.
Traders should focus on weekly reactions around 0.17–0.135 and wait for confirmed weekly closes before taking positions.
There is no “best” position yet — only patience and discipline will define the outcome at such a pivotal stage.
---
#ALGO #ALGOUSDT #Algorand #CryptoAnalysis #PriceAction #MarketStructure #SwingTrading #TechnicalAnalysis #CryptoBreakout #TradingViewCommunity
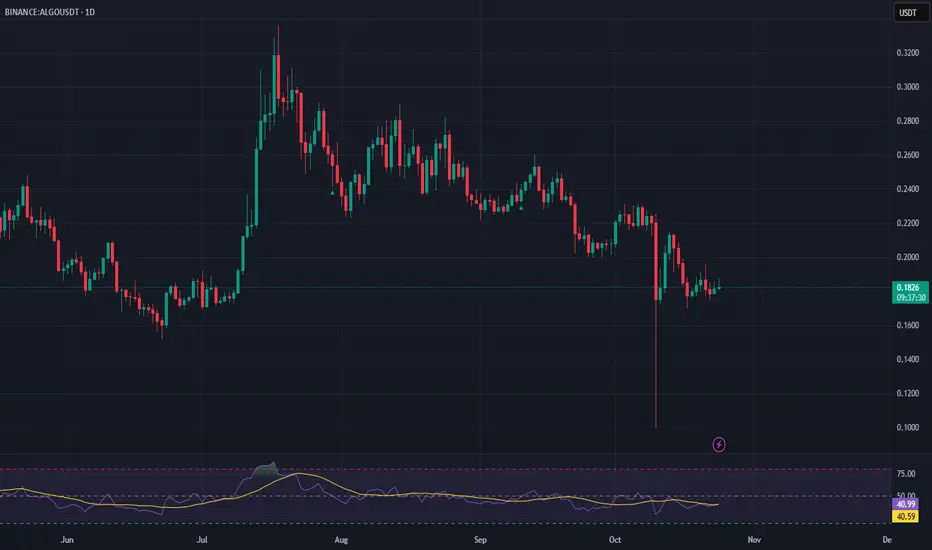
ALGOusdt"ALGO is seeing an increase in trading volume 📈
The price has also broken above the 14-period RSI and the 50 level, indicating strong momentum and potential continuation to the upside
Targets are shown on the chart 📊

ALGOUSDT - this will go uphi traders,
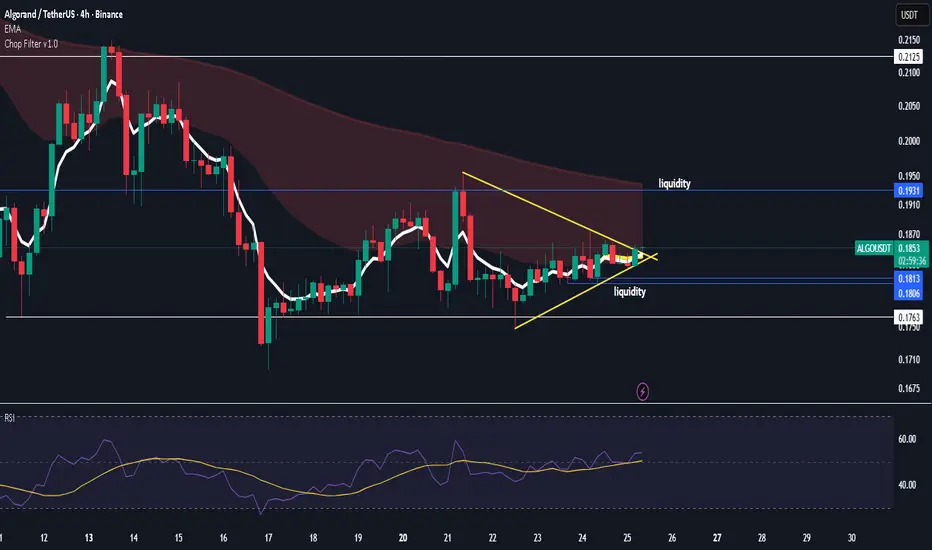
The chart shows ALGO/USDT forming a descending triangle pattern over the past year, with a series of lower highs and a relatively flat support line around the $0.18–$0.19 level. The price is currently near the apex of the triangle, suggesting a potential breakout point is approaching.
Key observations:
Support line: Around $0.18, tested multiple times since early 2025.
Resistance trendline: Descending from the December 2024 high, forming lower highs.
Volume: Noticeable spikes coincide with price movements, suggesting increasing interest around key breakout levels.
Stochastic RSI: Currently in the oversold region (around 11–16), indicating a potential upward momentum reversal in the near term.
Trading idea:
If ALGO breaks above the descending resistance line with strong volume, the next target is projected near $0.618, as marked on the chart. This suggests a significant upside potential from the current levels, aligning with the breakout strategy. Traders might consider entering near the support or upon confirmation of a breakout, with stop-losses placed just below the support line to manage risk.
Summary:
ALGO/USDT is in a consolidation phase within a descending triangle. A breakout to the upside is anticipated, supported by oversold Stochastic RSI levels, with a projected target around $0.618. Risk management should be applied near the $0.18 support level.

$ALGO- ride to 97c then do what you wantwas lagging now looking better than ada
basically gone in for these 3 the A team and a few degen plays with low caps
again in mid zone and we need some loving to pump this
sunday nite may get a liquidity grab
either way domi is still hovering in supply zone need it to loose 57%ish
after that monthly wick on domi and 60% rejection a few days ago its getting lower highs for now ... keep the faith
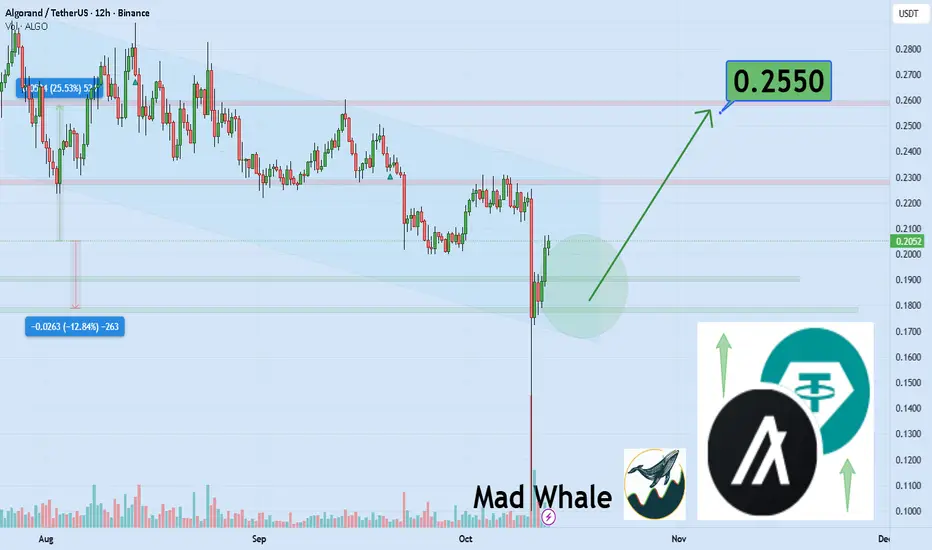
Algo will hit 25% profit with target of 0.02550 soon hi
the support and resistances on the chart are based on the previous data and weekly candlesticks if BINANCE:ALGOUSDT holds this last support the potential of 25% gain is logical toward 0.2550 $
ALGO Setup: Watching $0.15 for Potential Long OpportunityWe're eyeing ALGO/USD for a potential retest of the $0.15 support zone, which could act as a springboard for a bullish reversal on higher timeframes. This zone has historically provided strong demand, and another touch could offer a high-probability entry — though patience is key as we wait for confirmation.
📈 Long Spot Trade Idea:
Entry Zone: $0.15 – $0.16
Targets:
TP1: $0.225 – $0.26
TP2: $0.28 – $0.33
Stop Loss: Below $0.13
Algorand (ALGO): Waiting For Breakout | Good Buy Opportunity!ALGO is still sitting in a sweet spot despite the recent dip we’ve seen. The structure remains the same — price is hovering near a key area where historically, each proper breakout from here has led to strong upside moves.
As always, patience is key. We’ll be waiting for that breakout confirmation, and once it happens, we’ll be looking for a clean bounce and a potential repeat of the same pattern we’ve seen before.
Swallow Academy

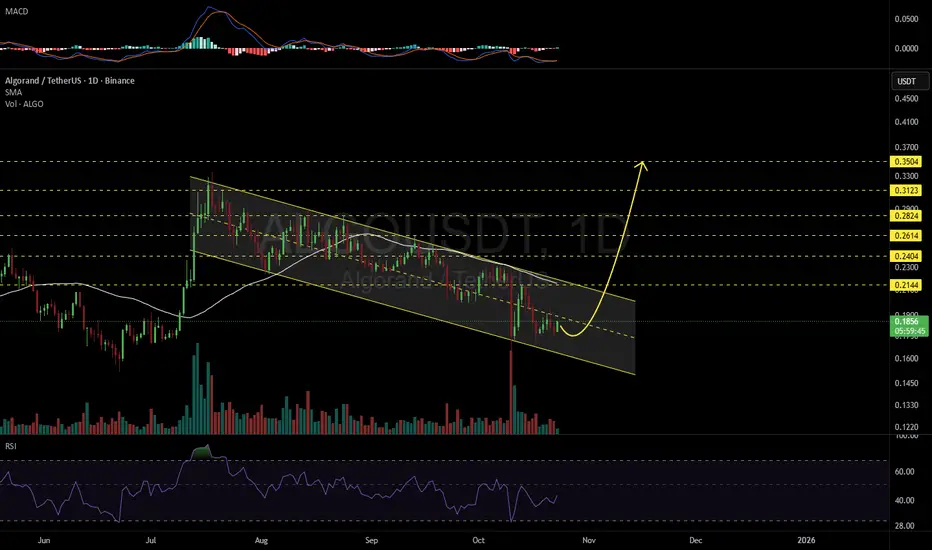
ALGOUSDT 1D#ALGO is moving inside a descending channel on the daily chart. In case of a breakout above the channel resistance and the daily SMA50, the potential targets are:
🎯 $0.2144
🎯 $0.2404
🎯 $0.2614
🎯 $0.2824
🎯 $0.3123
🎯 $0.3504
⚠️ Always remember to use a tight stop-loss and maintain proper risk management.
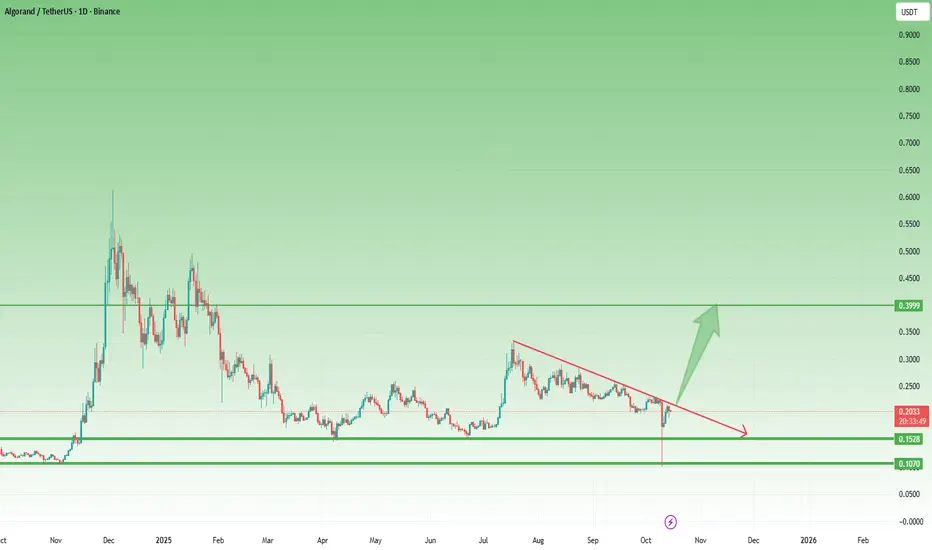
ALGO – Reversal from the Final Support ZoneLike most altcoins, Algorand also ended Friday’s crash by touching its final support zone, then strongly reversed.
After dropping to 0.10, the coin rebounded sharply and reclaimed the next key level at 0.15.
Currently trading around 0.20, ALGO is showing early signs of stabilization. If the overall crypto recovery continues, this setup could develop into a solid bullish signal.
The confirmation comes with a break above 0.2250, which would mark the end of the correction that started in December last year — opening the way toward the 0.40 zone.
Let’s see if the market confirms it. 🚀
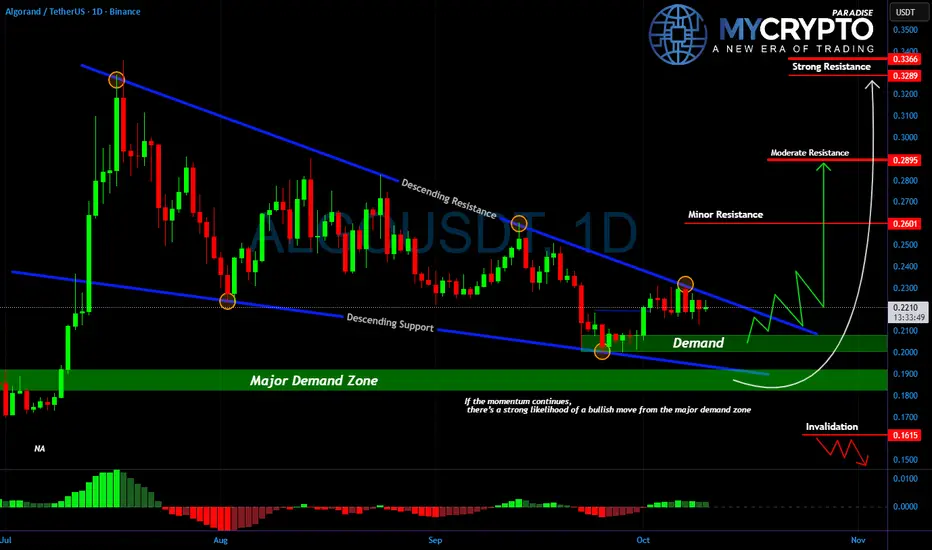
ALGO on the Edge: Will the Next Move Catch Everyone Off Guard?Yello Paradisers, are you prepared for what could be the breakout that surprises the entire market? While most traders are distracted, #ALGOUSDT is quietly compressing inside a clean descending wedge structure, and the pressure is reaching a critical point.
💎After weeks of bleeding, #ALGO has established a solid base within the major demand zone between $0.185 and $0.20. This area has held strong multiple times, showing clear signs of aggressive buying each time price touches down. It’s no coincidence this zone is being defended, and smart money knows it.
💎Price is now consolidating just below the descending resistance line, and every touch to the downside has become weaker, signaling a potential shift in market control. If momentum builds from here, a confirmed breakout above the $0.23 level could open the path toward higher targets. The $0.26 region will likely act as the first minor resistance, followed by stronger supply zones around $0.288 and $0.3289, where historical selling has previously stepped in.
💎However, as always, we must stay grounded in probabilities. Invalidation sits clearly below $0.1615. A break beneath that level would invalidate the bullish structure and shift the momentum back into the hands of the bears.
💎Until then, this remains a high-probability accumulation pattern. But remember, the market often fakes in one direction before delivering the real move. That means a final shakeout can’t be ruled out before the breakout. This is where emotional traders get liquidated and where the disciplined ones wait with confidence.
Strive for consistency, not quick profits. Treat the market as a businessman, not as a gambler. This is the only way you will make it far in your crypto trading journey. Be a PRO.
MyCryptoParadise
iFeel the success🌴
$algo - higher high incoming waiting for kava to pop so thought mught as well pop some in this as well imo its free money so small size but high leverage laddered down a little so hopefully get filled
obv has been up rsi on the daily little down but weekly looks lit to reclaim the 7 ema or around 2380
AlgorandAlgo usdt daily analysis
Time frame 4 hours
Risk rewards ratio >2.5 👈
Target = 0.33 $
I entered long position at the end of down trend
LS is so close and tight to decrease of damage

Buy Algo right here !!I am all eyes on Algo to break my trigger line (around 0.2250). then the buy setup will be activated :)
First midterm target --> 0.43
