$APE is EXTREMELY underpriced for being a meme coinWhen it got added to the canadian market Wealthsimple it, like every other new crypto added to Wealthsimple(not anymore there's too many), It Shot to the moon in a week tripling in value! A back of the mind crypto once worth nearly 8 BILLION is finding a floor at 100m+. A psychological target of $1

#APE/USDT chart (1-hour timeframe)#APE
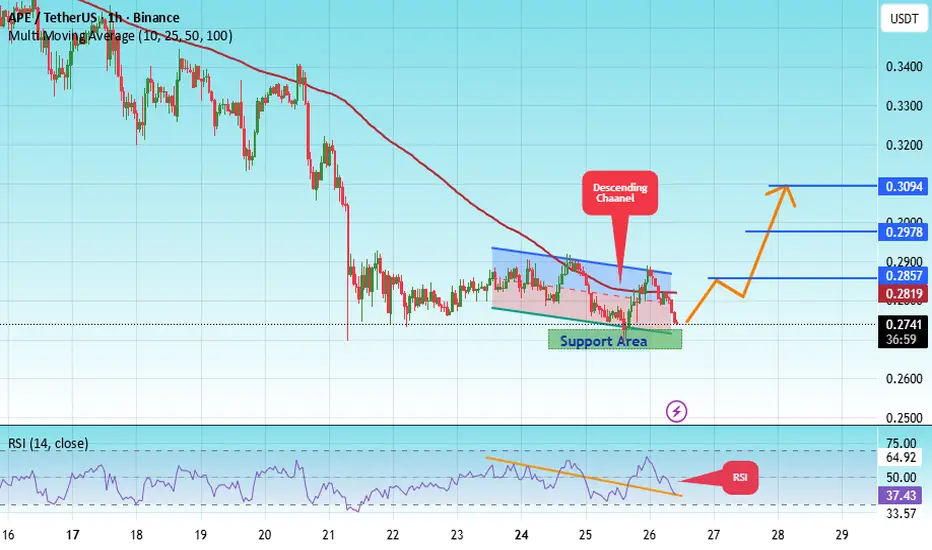
The price is moving in a descending channel on the 1-hour timeframe. It has reached the lower boundary and is heading towards breaking above it, with a retest of the upper boundary expected.
We have a downtrend on the RSI indicator, which has reached near the lower boundary, and an upward reb

FireHoseReel | APE at a Critical Breakout Point🔥 Welcome To FireHoseReel !
Let’s dive into APE analysis.
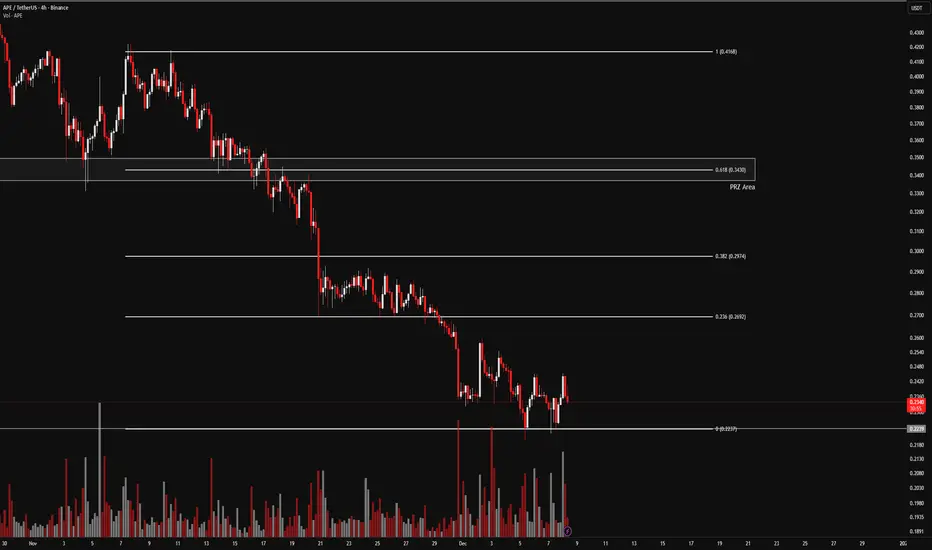
👀 APE 4H Overview
APE remains bearish across most higher timeframes. We’ve applied a Fibonacci retracement on the last 4H bearish leg, which has highlighted several key levels. A break below the current low signals continuation of the downtr
#APE/USDT chart (1-hour timeframe)#APE
The price is moving within an ascending channel on the 1-hour timeframe and is adhering to it well. It is poised to break out strongly and retest the channel.
We have a downtrend line on the RSI indicator that is about to break and retest, which supports the upward move.
There is a key suppo
TradeCityPro | APEUSDT Analysis Buyers’ Last Attempt🔥 APEUSDT Analysis — Buyers’ Last Attempt
Let’s move on to the analysis of APE, one of the NFT-sector tokens that has recently experienced a deep decline and is currently facing several critical developments.
🌐 Overview of Bitcoin
Before starting the analysis, let me remind you once again that we’

APE near Trendline Support APE Tried to break Trendline Support but bounced from Strong Static Support
Wait for Breakdown and Retest!

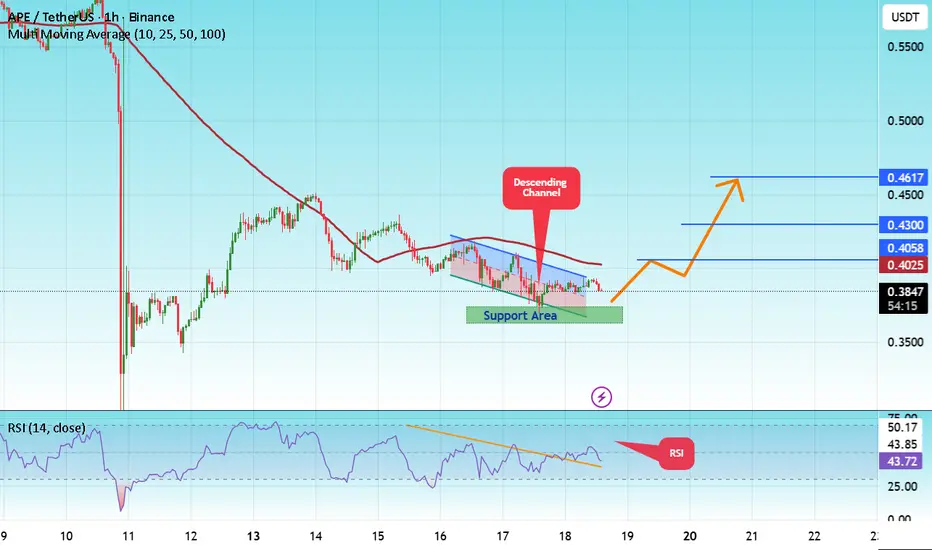
#APE/USDT chart (1-hour timeframe)#APE
The price is moving in an ascending channel on the 1-hour frame, adhering well to it, and heading for a strong breakout and retest.
We have a bearish trend on the RSI indicator that is about to be broken and retested, which supports the upward breakout.
There is a major support area in green

APEGETTEX:APE has reacted strongly from its support level and looks ready for a breakout. The setup suggests a potential 750% gain from current levels. With strong funding, solid backing, and momentum building, this project has all the tools needed to push much higher.

APE Analysis (2H)This is one of the coins that hasn’t shown any significant upward movement after the market’s heavy dump. In such cases, it’s better to look for the origin of potential moves. From a wave perspective, it seems to be forming a triangle, which could start from the green zone of wave E. Therefore, we’l

#APE/USDT chart (1-hour timeframe)...#APE
The price is moving in a descending channel on the 1-hour frame and is expected to break and continue upward.
We have a trend to stabilize above the 100 moving average once again.
We have a downtrend on the RSI indicator that supports the upward move with a breakout.
We have a major support
See all ideas
Summarizing what the indicators are suggesting.
Oscillators
Neutral
SellBuy
Strong sellStrong buy
Strong sellSellNeutralBuyStrong buy
Oscillators
Neutral
SellBuy
Strong sellStrong buy
Strong sellSellNeutralBuyStrong buy
Summary
Neutral
SellBuy
Strong sellStrong buy
Strong sellSellNeutralBuyStrong buy
Summary
Neutral
SellBuy
Strong sellStrong buy
Strong sellSellNeutralBuyStrong buy
Summary
Neutral
SellBuy
Strong sellStrong buy
Strong sellSellNeutralBuyStrong buy
Moving Averages
Neutral
SellBuy
Strong sellStrong buy
Strong sellSellNeutralBuyStrong buy
Moving Averages
Neutral
SellBuy
Strong sellStrong buy
Strong sellSellNeutralBuyStrong buy
Displays a symbol's price movements over previous years to identify recurring trends.