$APE is EXTREMELY underpriced for being a meme coinWhen it got added to the canadian market Wealthsimple it, like every other new crypto added to Wealthsimple(not anymore there's too many), It Shot to the moon in a week tripling in value! A back of the mind crypto once worth nearly 8 BILLION is finding a floor at 100m+. A psychological target of $1 from 20 cents will easily 5x with such little market cap!
Market insights

#APE/USDT chart (1-hour timeframe)#APE
The price is moving in a descending channel on the 1-hour timeframe. It has reached the lower boundary and is heading towards breaking above it, with a retest of the upper boundary expected.
We have a downtrend on the RSI indicator, which has reached near the lower boundary, and an upward rebound is expected.
There is a key support zone in green at 0.2412. The price has bounced from this zone multiple times and is expected to bounce again.
We have a trend towards consolidation above the 100-period moving average, as we are moving close to it, which supports the upward movement.
Entry price: 0.2453
First target: 0.2500
Second target: 0.2565
Third target: 0.2652
Don't forget a simple principle: money management.
Place your stop-loss order below the green support zone.
For any questions, please leave a comment.
Thank you.

FireHoseReel | APE at a Critical Breakout Point🔥 Welcome To FireHoseReel !
Let’s dive into APE analysis.
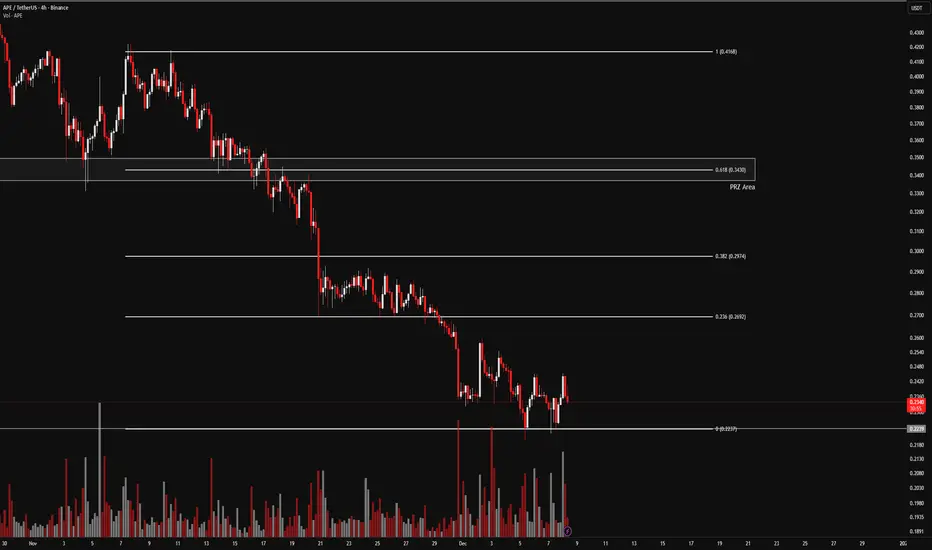
👀 APE 4H Overview
APE remains bearish across most higher timeframes. We’ve applied a Fibonacci retracement on the last 4H bearish leg, which has highlighted several key levels. A break below the current low signals continuation of the downtrend, while a breakout above the PRZ zone would act as the best bullish trigger.
📊 Volume Analysis
APE volume has increased as price reached this zone. This rise in volume suggests that whales may be defending lower prices. If the floor breaks, heavy liquidations and spot selling could follow.
✍️ APE Trading Scenarios
🟢 Long Scenario:
A breakout above the PRZ at $0.343, supported by strong buy volume, could activate a long trigger. Prefer entries on the second or third test of the breakout.
🔴 Short Scenario:
A breakdown of the current base with strong selling pressure and whale capitulation could push price lower. The main short trigger lies below $0.2237.
🧠 Protect your capital first. No setup is worth blowing your account. If risk isn’t controlled, profit means nothing. Trade with rules, not emotions.
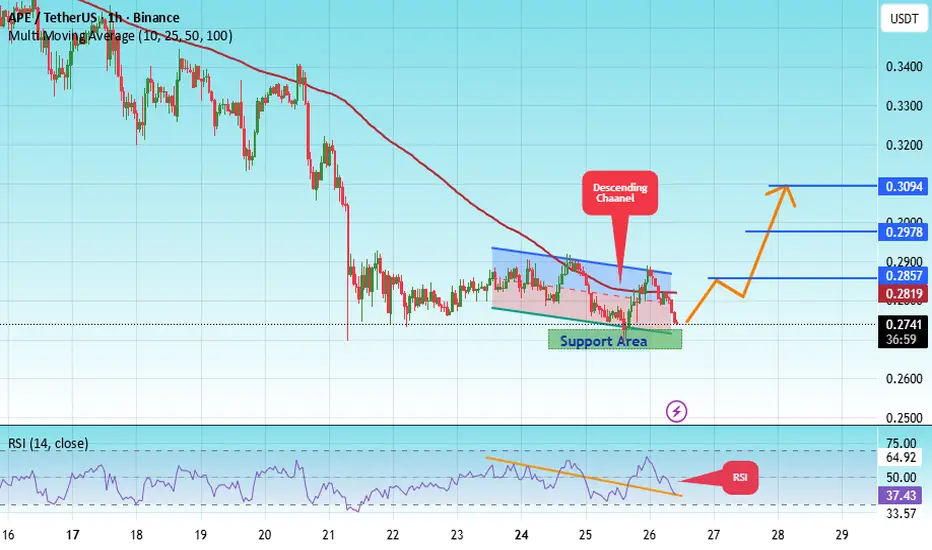
#APE/USDT chart (1-hour timeframe)#APE
The price is moving within an ascending channel on the 1-hour timeframe and is adhering to it well. It is poised to break out strongly and retest the channel.
We have a downtrend line on the RSI indicator that is about to break and retest, which supports the upward move.
There is a key support zone in green at 0.2650, representing a strong support point.
We have a trend of consolidation above the 100-period moving average.
Entry price: 0.2700
First target: 0.2857
Second target: 0.2978
Third target: 0.3094
Don't forget a simple money management rule:
Place your stop-loss order below the support zone in green.
Once you reach the first target, save some money and then change your stop-loss order to an entry order.
For any questions, please leave a comment.
Thank you.
TradeCityPro | APEUSDT Analysis Buyers’ Last Attempt🔥 APEUSDT Analysis — Buyers’ Last Attempt
Let’s move on to the analysis of APE, one of the NFT-sector tokens that has recently experienced a deep decline and is currently facing several critical developments.
🌐 Overview of Bitcoin
Before starting the analysis, let me remind you once again that we’ve moved the Bitcoin analysis section to a dedicated daily report at your request — allowing us to discuss Bitcoin’s trend, dominance, and overall market sentiment in greater detail each day.
📉 Daily Timeframe Analysis
After the recent market drop and the rejection from 0.5833, APE experienced a sharp decline and has now reached its final major support zone.
If 0.3467 breaks, we will likely see another sharp sell-off, meaning buyers must make their final effort to defend this support and prevent further collapse.
📈 Long Position Setup
For a long entry, we first need to see a proper structure forming on lower timeframes.
The main long trigger will be:
A breakout of the daily trendline, and
A confirmed break above 0.4141
This would signal a potential trend reversal.
🔻 Short Position Setup
Our short trigger is completely clear:
A confirmed break below 0.3467
But be aware: volatility is expected to be high, so it’s necessary to use a larger stop-loss to avoid getting wicked out during price spikes.
📝 Final Thoughts
Stay calm, trade wisely, and let's capture the market's best opportunities!
This analysis reflects our opinions and is not financial advice.

APE near Trendline Support APE Tried to break Trendline Support but bounced from Strong Static Support
Wait for Breakdown and Retest!

#APE/USDT chart (1-hour timeframe)#APE
The price is moving in an ascending channel on the 1-hour frame, adhering well to it, and heading for a strong breakout and retest.
We have a bearish trend on the RSI indicator that is about to be broken and retested, which supports the upward breakout.
There is a major support area in green at 0.4330, which represents a strong support point.
We are heading for consolidation above the 100 moving average.
Entry price: 0.4336
First target: 0.4500
Second target: 0.4600
Third target: 0.4736
Don't forget a simple matter: capital management.
When you reach the first target, save some money and then change your stop-loss order to an entry order.
For inquiries, please leave a comment.
Thank you.

APEGETTEX:APE has reacted strongly from its support level and looks ready for a breakout. The setup suggests a potential 750% gain from current levels. With strong funding, solid backing, and momentum building, this project has all the tools needed to push much higher.

APE Analysis (2H)This is one of the coins that hasn’t shown any significant upward movement after the market’s heavy dump. In such cases, it’s better to look for the origin of potential moves. From a wave perspective, it seems to be forming a triangle, which could start from the green zone of wave E. Therefore, we’ll be looking for buy/long positions around the green zone.
Targets are marked on the chart.
A 4-hour candle closing below the invalidation level will invalidate this analysis.
For risk management, please don't forget stop loss and capital management
When we reach the first target, save some profit and then change the stop to entry
Comment if you have any questions
Thank You

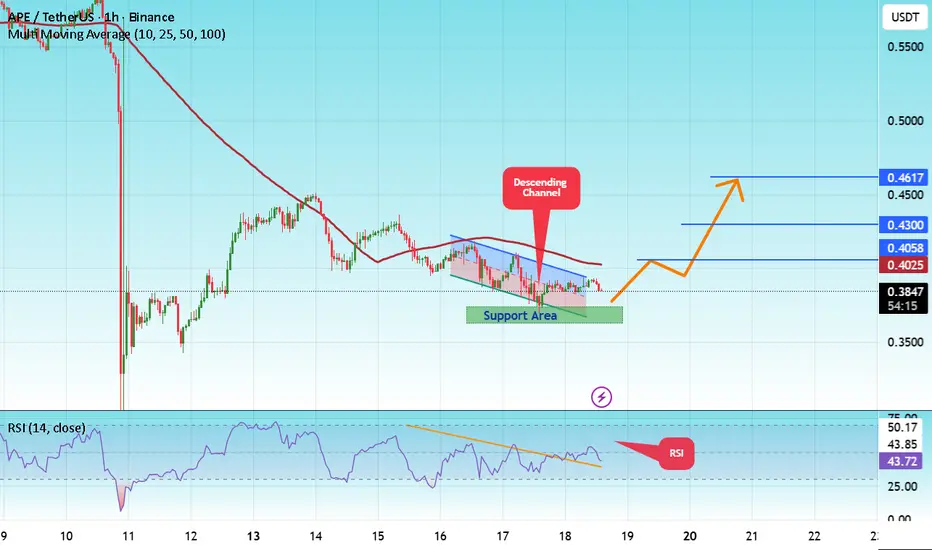
#APE/USDT chart (1-hour timeframe)...#APE
The price is moving in a descending channel on the 1-hour frame and is expected to break and continue upward.
We have a trend to stabilize above the 100 moving average once again.
We have a downtrend on the RSI indicator that supports the upward move with a breakout.
We have a major support area in green that pushed the price higher at 0.680.
Entry price: 0.3857.
First target: 0.4058.
Second target: 0.4300.
Third target: 0.4617.
To manage risk, don't forget stop loss and capital management.
When you reach the first target, save some profits and then change the stop order to an entry order.
For inquiries, please comment.
Thank you.
APEUSDT 1D#APE is moving inside a descending triangle on the daily chart. In case of a breakout above the daily SMA50 and the triangle resistance, the potential targets are:
🎯 $0.5513
🎯 $0.6467
🎯 $0.7341
🎯 $0.8214
🎯 $0.9457
🎯 $1.1040
⚠️ Always remember to use a tight stop-loss and maintain proper risk management.

APEUSDT the massive pump and 5x soon coming As previously outlined in our analysis, the APEUSDT pair is trading in a zone that historically constitutes a long-term support base. The current price action suggests a potential exhaustion of selling pressure, indicating that the asset may be consolidating for its next significant move. We anticipate a substantial bullish wave, projecting a minimum appreciation of +500% towards the predefined targets illustrated on our technical chart. This upward movement is expected to materialize upon the confirmation of a trend reversal, irrespective of the exact timing.
DISCLAIMER: ((trade based on your own decision))
<<press like👍 if you enjoy💚

APEUSDT: Trend in daily timeframeThe color levels are very accurate levels of support and resistance in different time frames, and we have to wait for their reaction in these areas.
So, Please pay special attention to the very accurate trend, colored levels, and you must know that SETUP is very sensitive.
Be careful
BEST
MT

APEUSDT near ATL and daily supportLol price is currently dead and is almost near best buy zones for those who can hold and soon we can expect pump here to the 2$ target at least and that would be easy one but if you can take your time it may happen now or after 6 months.
DISCLAIMER: ((trade based on your own decision))
<<press like👍 if you enjoy💚
APEUSDT — consolidation and volatility squeezeAfter a prolonged downtrend, APE has entered a summer consolidation phase, with the range tightening week by week. Such formations usually precede a strong breakout. The market is now approaching a decisive move.
📌 Breakout to the upside may confirm a bullish pennant, with the first target around 0.64 and further potential toward dynamic resistance near 0.94. That could trigger a broader recovery.
📌 Breakout to the downside would retest the lower support zone, once again checking the real demand for the token.
⚠️ On the macro scale, APE is still trading about -97% below its ATH. Scary to buy something that has dropped this much? Maybe. But think about it — at $2 it won’t feel scary anymore. Often, these are exactly the zones where the best long-term opportunities appear.
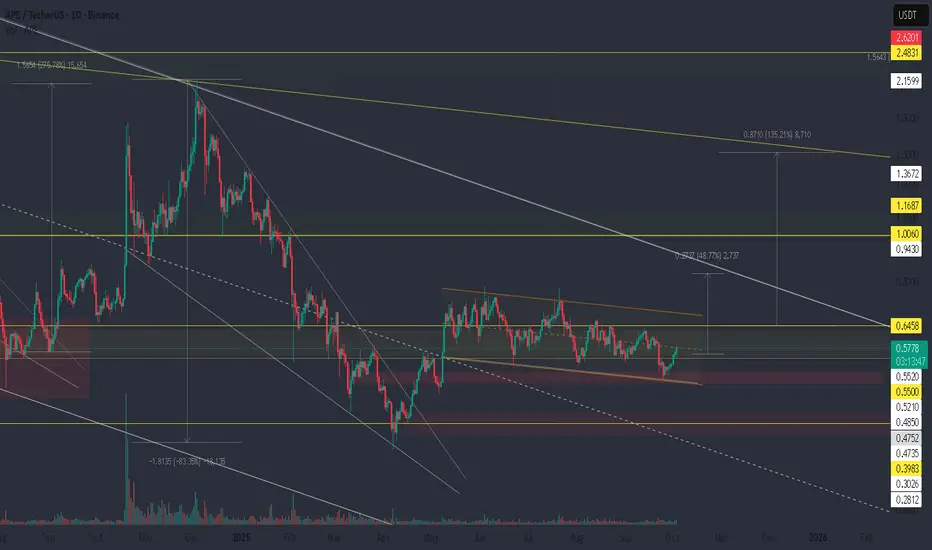
APEUSDT 1D#APE is moving inside a descending channel on the daily timeframe and has bounced off the channel support line. We expect an upward move from here unless BTC’s decline negatively impacts APE. Always use a stop-loss. The targets are:
🎯 $0.6149
🎯 $0.6972
🎯 $0.7795
🎯 $0.8967
🎯 $1.0460
⚠️ Always remember to use a tight stop-loss and follow proper risk management.

APECOIN (APE) – Technical Outlook & Key Market InsightsDescription :
ApeCoin (APE) is the governance token of the Ape ecosystem, designed to support community-led initiatives within the Bored Ape Yacht Club (BAYC) and related projects. Its utility extends to governance, payments, and ecosystem participation, making it one of the most discussed tokens in the NFT and Web3 sector.
In this analysis, we review the current technical structure of APE with a focus on price action, market sentiment, and possible support/resistance levels. While ApeCoin remains highly volatile, its connection to the NFT space and strong community backing are key fundamentals to watch.
⚠️ Disclaimer: This content is for educational and informational purposes only. It does not constitute financial advice. Always conduct your own research before making trading or investment decisions.
#APE #ApeCoin #Crypto #Altcoins #Web3 #NFT #Trading #TechnicalAnalysis #CryptoCommunity #Blockchain

APE Main trend. Channel. Wedge. Reversal zones 05 05 2025Logarithm. Time frame 1 week.
1️⃣ Decline from the maximum by -98% , which is acceptable for assets of such liquidity and capitalization, after that either a trend reversal (main), or a complete scam.
2️⃣X (twitter) of this crypto project has 473 thousand subscribers . This army will be sent to pump this cryptocurrency at the right time in the so-called 3rd alt season of this cycle.
🟣And now work with a breakout of the descending wedge, and the price movement to the resistance of the descending channel. The percentage locally - medium-term showed for clarity from two zones - scenarios.
3️⃣The third plus is that this cryptocurrency is traded on 4 liquid exchanges: binance, bybit, okx, and most importantly Coinbase.
Line chart (trend direction and liquidity).

APEUSDT LongTrying this swing long setup on APEusdt here.
Entering a long position under 0.6050
Currently the price is holding key area and if this holds a bit more it can squeeze fast to upside.
A nice RR if happens.
Risky trade but can be worth it to take.
Invalidation clean break below 0.5900.
Note:Not a Financial advice.

apeusdt position tradeWait for correction. And buy on this zone. This is my point of interest of buying accumulating

APEUSDT – 1D AnalysisHey traders! 👋
Looking at APEUSDT on the daily chart, we can see that the market has completed a clear 5-wave impulse to the downside. After that strong bearish move, the resistance line was broken, which gave us the first signs of a potential reversal.
From there, we formed a smaller 5-wave impulse upwards, which could very well be wave A of an ABC zig-zag correction. Following that, wave B unfolded in what looks like an irregular correction.
👉 Now, I’m watching closely for wave C to unfold, which should take the form of another 5-wave impulse. According to Elliott Wave guidelines, wave C often equals the length of wave A. However, in this case, wave A was already quite extended, so I wouldn’t be overly optimistic with projections. The minimum correction target has already been reached, but structurally we’re still missing wave C – so I expect it to play out, potentially in the form of a rising wedge.
The good news is that the structure will become clearer as it develops, and we can adjust targets dynamically once price action confirms the pattern. For now, I’m eyeing the green zone as a possible target area for wave C.
📊 Potential Trade Levels:
Entry zone: 0.60 – 0.65 USDT
Stop Loss: 0.51 USDT
Target: 0.99 USDT
⚠️ Important reminder: This is not financial advice – just sharing my Elliott Wave perspective and how I’m viewing the structure right now. The market may develop differently, so please manage your own risk and adjust accordingly. Trade safe, friends! 🙌

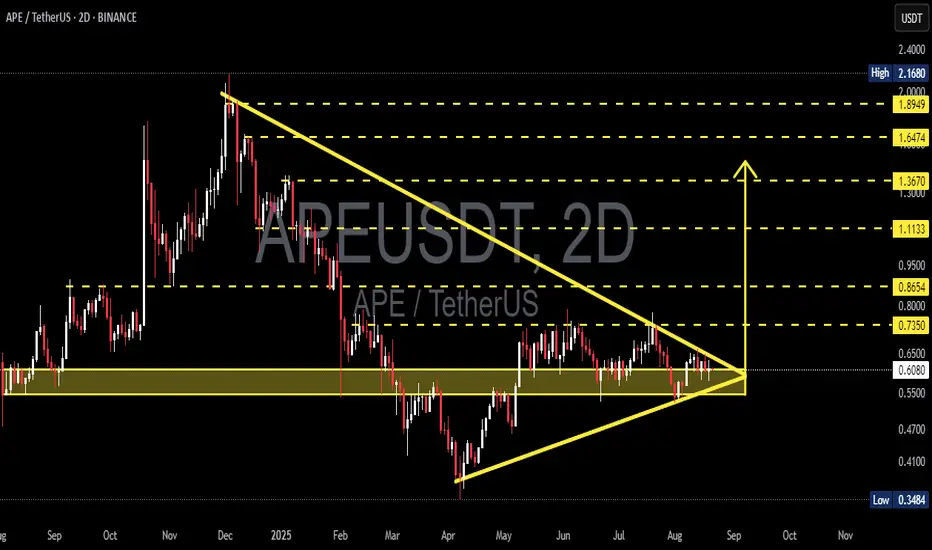
APE/USDT: Symmetrical Triangle – The Next Big Move is Loading!📊 Market Context:
APE/USDT is currently consolidating after a sharp move from the $2.168 high down to the $0.3484 low. The price action has now formed a symmetrical triangle, signaling compressed volatility and accumulation phase.
The $0.52 – $0.62 demand zone remains the critical support, while the long-term descending resistance line (from Dec 2024) is the key barrier that must be broken to unlock further upside potential.
---
🔶 Pattern & Technical Structure:
Main Pattern: Symmetrical Triangle (neutral, often continuation).
Key Support Zone: $0.52 – $0.62.
Immediate Resistance: $0.735 as the first breakout confirmation.
Next Resistances: $0.8654 – $1.1133 – $1.3670 – $1.6474 – $1.8949.
Major Levels: $0.3484 (low) and $2.1680 (high).
---
🚀 Bullish Scenario
If APE breaks above with a 2D candle close > $0.735 and strong volume:
Step Targets:
$0.8654 (minor resistance)
$1.1133 (major resistance)
$1.3670 (mid-range target)
Measured-Move Target (triangle projection): $2.43 – $2.55.
Extra Confirmation: a retest of the descending trendline turning into support would strengthen the bullish case.
---
🔻 Bearish Scenario
If APE breaks down below the $0.52 demand zone:
First Target: $0.3484 (previous low).
Extended Target: $0.25 psychological support.
Risk Factor: A confirmed break below $0.3484 may extend the bearish cycle much deeper.
---
⚖️ Conclusion & Key Notes
APE is currently at a critical crossroad, with the symmetrical triangle nearing its apex. The next breakout or breakdown will dictate the medium-term trend.
For traders, this is a “wait & see with confirmation” phase, as the reward–risk ratio can be very attractive in both directions. The best approach is to wait for a 2D candle close + volume breakout + potential retest to avoid false signals.
#APE #APEUSDT #CryptoAnalysis #SymmetricalTriangle #Altcoin #PriceAction #BreakoutSetup #CryptoTrading
APEUSDTAPEUSDT shows strong bullish momentum on the 1-hour chart, supported by MACD and RSI trends. However, the KDJ and Bollinger Bands suggest the asset is nearing overbought conditions, which could lead to a short-term pullback or sideways movement. Traders should watch for confirmation signals before making new entries.
Entry - 0.6647$
TP - 0.6769$
TP2 - 0.6561$
SL - 0.6582$
Always do your DOR (Research) before making a decision.
