APT/USDT — Same Pattern, Same Potential?APT/USDT is showing a repeating cyclical structure — three times price has broken out of a falling wedge, each followed by a sharp rally.
📈 Historically:
▪️ Each breakout led to +150% or more gains
▪️ We’re now seeing a third similar setup forming
▪️ Targets (based on previous expansions): 8.18 / 1
Related pairs

Live tradehello friends👋
✅️Considering the drop we had, now the price has reached an important and good support and the price is supported by the buyers, and the downward trend line has broken and the ceiling has been raised. Considering this, we entered into the transaction with capital and risk management.

Free signal hello friends👋
✅️Due to the price reaching the important weekly back support, the price is expected to grow, so you can enter into the transaction with risk and capital management and move to the specified goals.
🔥Follow us for more signals🔥
*Trade safely with us*

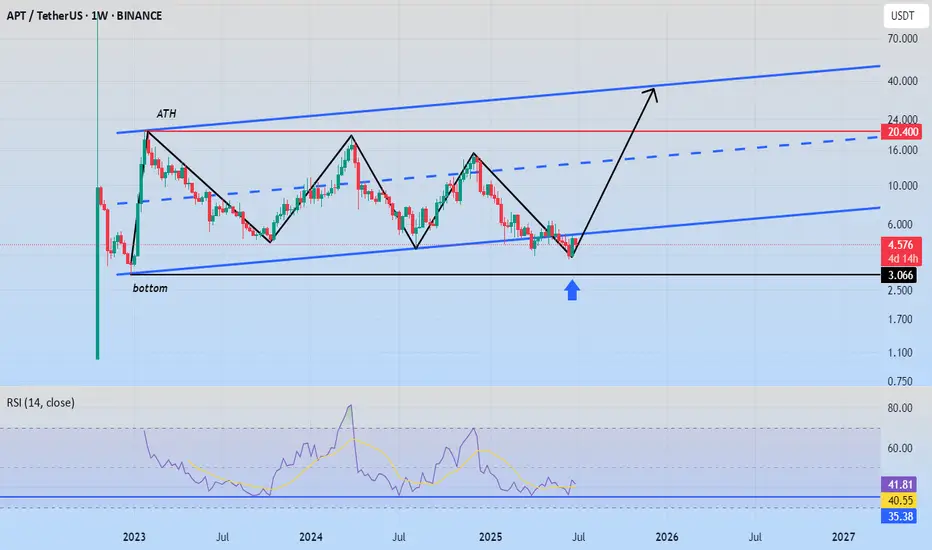
APT at Historic Support – Massive Reversal Incoming?APTUSDT technical analysis update
APT has been trading inside a descending channel for over 900 days, and it's now once again testing the channel support. As shown in the chart, the price has bounced multiple times from this level, making it a historically strong support zone.
Currently, the targe

APT 35$ SOONHI GUYS
See the masterpiece on the chart.
Coinciding with very positive news for the currency,
The currency has been moving within a price channel since its launch.
We also see a false break of the channel, while maintaining the bottom on the RSI.
There was no break, so it's considered a false brea
APT/USDTKey Level Zone: 4.6666 - 4.7500
LMT v2.0 detected.
The setup looks promising—price previously trended upward with rising volume and momentum, then retested this zone cleanly. This presents an excellent reward-to-risk opportunity if momentum continues to align.
Introducing LMT (Levels & Momentum Tr

#APTUSDT | Bullish Breakout from Descending ChannelBINANCE:APTUSDT has broken out of a 3-month-long descending channel, indicating a shift in momentum and a potential bullish reversal.
Entry: $5.64 - $5.10
🎯 Targets:
• TP1 – $6.77
• TP2 – $8.40
• TP3 – $9.94 (final target)
Stop Loss: $4.48
📌 Notes:
• EMA resistance sits around $6.10 — a daily c

Aptos APT price analysis💰 We will soon find out whether the price of #APT has finally begun to recover, or whether this is just a rebound before a further decline.
📈 For growth to continue, it is important that buyers manage to keep the price of OKX:APTUSDT above $4
◆ Next, the price will exit the falling channel and mo

APT around a historical support DO or DIEAPT / USDT
Price dropped hard to retest the massive historical support again
This multi years support ( 3$-4$) zone always shows great buying pressures thats why it catch our attention!
This support also can play as DO or DIE borderline between bulls and bears
The buyers must defend this area o

Aptos Bullish, Altcoins BullishThe best is yet to come. Do not despair my dear friend, patience is key.
Aptos is breaking bullish right now after a final low with the highest volume since February. This confirms the latest double-bottom as the market bottom.
The high bullish momentum developing on today's candle, full green, co

See all ideas
Summarizing what the indicators are suggesting.
Oscillators
Neutral
SellBuy
Strong sellStrong buy
Strong sellSellNeutralBuyStrong buy
Oscillators
Neutral
SellBuy
Strong sellStrong buy
Strong sellSellNeutralBuyStrong buy
Summary
Neutral
SellBuy
Strong sellStrong buy
Strong sellSellNeutralBuyStrong buy
Summary
Neutral
SellBuy
Strong sellStrong buy
Strong sellSellNeutralBuyStrong buy
Summary
Neutral
SellBuy
Strong sellStrong buy
Strong sellSellNeutralBuyStrong buy
Moving Averages
Neutral
SellBuy
Strong sellStrong buy
Strong sellSellNeutralBuyStrong buy
Moving Averages
Neutral
SellBuy
Strong sellStrong buy
Strong sellSellNeutralBuyStrong buy
Displays a symbol's price movements over previous years to identify recurring trends.
Frequently Asked Questions
The current price of APTOS / Tether US (APT) is 4.4202 USDT — it has fallen −7.80% in the past 24 hours. Try placing this info into the context by checking out what coins are also gaining and losing at the moment and seeing APT price chart.
APTOS / Tether US price has fallen by −10.69% over the last week, its month performance shows a −11.68% decrease, and as for the last year, APTOS / Tether US has decreased by −25.83%. See more dynamics on APT price chart.
Keep track of coins' changes with our Crypto Coins Heatmap.
Keep track of coins' changes with our Crypto Coins Heatmap.
APTOS / Tether US (APT) reached its highest price on Jan 30, 2023 — it amounted to 20.3443 USDT. Find more insights on the APT price chart.
See the list of crypto gainers and choose what best fits your strategy.
See the list of crypto gainers and choose what best fits your strategy.
APTOS / Tether US (APT) reached the lowest price of 3.0669 USDT on Dec 29, 2022. View more APTOS / Tether US dynamics on the price chart.
See the list of crypto losers to find unexpected opportunities.
See the list of crypto losers to find unexpected opportunities.
The safest choice when buying APT is to go to a well-known crypto exchange. Some of the popular names are Binance, Coinbase, Kraken. But you'll have to find a reliable broker and create an account first. You can trade APT right from TradingView charts — just choose a broker and connect to your account.
Crypto markets are famous for their volatility, so one should study all the available stats before adding crypto assets to their portfolio. Very often it's technical analysis that comes in handy. We prepared technical ratings for APTOS / Tether US (APT): today its technical analysis shows the strong sell signal, and according to the 1 week rating APT shows the sell signal. And you'd better dig deeper and study 1 month rating too — it's sell. Find inspiration in APTOS / Tether US trading ideas and keep track of what's moving crypto markets with our crypto news feed.
APTOS / Tether US (APT) is just as reliable as any other crypto asset — this corner of the world market is highly volatile. Today, for instance, APTOS / Tether US is estimated as 1.78% volatile. The only thing it means is that you must prepare and examine all available information before making a decision. And if you're not sure about APTOS / Tether US, you can find more inspiration in our curated watchlists.
You can discuss APTOS / Tether US (APT) with other users in our public chats, Minds or in the comments to Ideas.