Aptos (APT): Looking For MSB + BOS | Bullish SetupAPT is still trading at the local low after a series of clear breaks of structure to the downside. For now, price is stabilizing at this support zone, but buyers haven’t confirmed control yet.
The game plan is simple: we wait for a proper market structure break to form. Once that happens, we then look for a confirmational BOS, which would be our entry trigger. Until structure shifts, this remains a wait-for-confirmation setup rather than a full send.
Swallow Academy
Market insights

APTUSDT - Correction and liquidity capture before the fall BINANCE:APTUSDT.P is making a countertrend move towards the zone of interest 1.66 - 1.68. Global and local trends are downward, and bearish pressure may do its job...
Bitcoin is consolidating within a downward trend. A retest of resistance is forming; if bears keep the market under pressure again, the decline of the flagship will also increase pressure on the altcoin market.
APT has been forming a global downward trend for quite some time. After updating the low to 1.400, we are seeing profit-taking and a rally to the zone of interest 1.66 - 1.68. A short squeeze could trigger a resumption of movement within the main trend.
Resistance levels: 1.6623, 1.6873, 1.734
Support levels: 1.553, 1.5035
A retest of the specified resistance zone and the absence of bullish momentum could give us a false breakout, which in turn could trigger a reversal of the local downward movement...
Best regards, R. Linda!

APTUSDT 1D#APT is trading near the descending resistance on the daily chart. If a breakout above this level occurs, the potential upside targets are:
🎯 $1.978
🎯 $2.152
🎯 $2.325
🎯 $2.572
🎯 $2.887
⚠️ Ensure tight stop-losses and disciplined risk management at all times.

APT/USDT +150%Aptos (APT) has spent a significant portion of 2024 and 2025 in a brutal downtrend, recently testing "generational lows" near the $1.42 – $1.60 zone. However, the tide is shifting. With the Baby Raptr and Velociraptr upgrades halving block times to 50ms and massive institutional backing from the likes of BlackRock (BUIDL Fund), APT is fundamentally one of the most undervalued Layer-1 assets in the market.

APT Buy/Long (4H)A solid structure shift has occurred on the chart, and a liquidity pool is visible above. If price reaches our entry zones before touching the supply area, we will enter the position.
We have two entry points, and we will enter using a DCA approach.
The targets are marked on the chart.
A daily candle close below the invalidation level will invalidate this analysis.
For risk management, please don't forget stop loss and capital management
When we reach the first target, save some profit and then change the stop to entry
Comment if you have any questions
Thank You

APT is testing the red resistance zone🚨📊 APT Update
APT is testing the red resistance zone 🔴 right now,
and this level is critical.
A breakout above could signal
bullish continuation.
If sellers step in here,
price may face rejection.
Watching the reaction closely. 👀

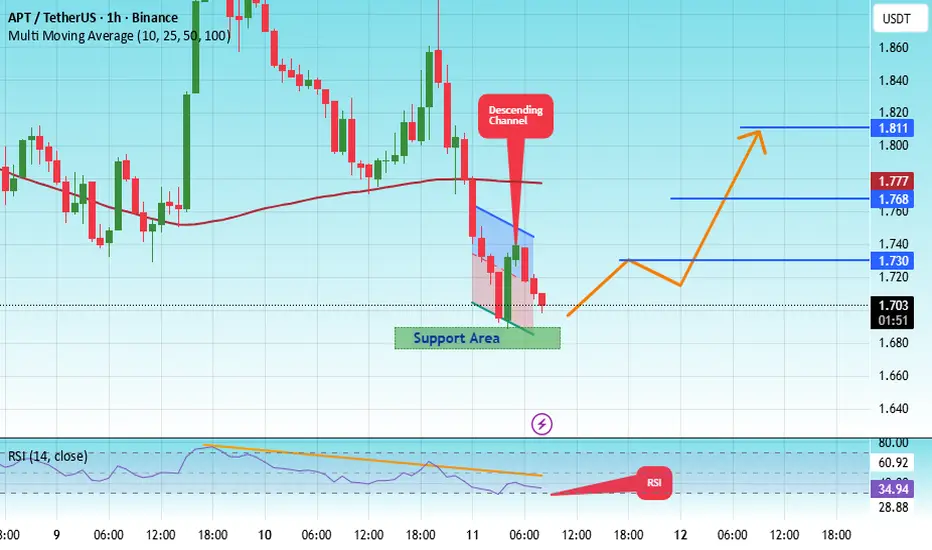
#APT/USDT #APT The price is moving in a descending channel on #APT
The price is moving in a descending channel on the 1-hour timeframe. It has reached the lower boundary and is heading towards breaking above it, with a retest of the upper boundary expected.
We have a downtrend on the RSI indicator, which has reached near the lower boundary, and an upward rebound is expected.
There is a key support zone in green at 1.68. The price has bounced from this zone multiple times and is expected to bounce again.
We have a trend towards consolidation above the 100-period moving average, as we are moving close to it, which supports the upward movement.
Entry price: 1.70
First target: 1.73
Second target: 1.76
Third target: 1.81
Don't forget a simple principle: money management.
Place your stop-loss below the support zone in green.
For any questions, please leave a comment.
Thank you.
APT - BEARISH OUTLOOKAMEX:APT - Bearish Setup 📉
Same story: no buy pressure, strong downtrend & no historical support.🔴
Price looks ready to break to the downside once again.
Potential key support:
$ 1.510 and $1.380 level (0.706 fib).
Chart looks terrible under the key resistances mentioned. 🍿📉

APT - how much money Aptos earns🧩 1. TVL (Total Value Locked) of Aptos
📉 Current state (mid-2025 → now):
Peak TVL was around $220–250M
Today it sits around $60–75M
A decline of 3–4x
❗Compare:
Solana: $5.5B+
Sui: $500M+
Aptos: $60M
(10× smaller than its younger competitor Sui)
🔥 Conclusion:
Aptos has very little liquidity, which means:
no trading activity
no DeFi
no developers
no user growth
no revenue
APT as a Layer-1 is failing in DeFi.
📊 2. Transactions & Active Users
🔽 Daily transactions:
Previously inflated by bots to 5–10M
Currently 200–300k real transactions
Compare:
Solana — 20–30M
Sui — 2–4M
TON — 5–7M
APT is far below second-tier blockchains.
🔻 Daily active users (DAU):
Only 20–40k.
Extremely low for a Layer-1 chain.
🧨 Why?
Because Aptos has:
no major DEX activity
no NFT ecosystem
no gaming
no DeFi
no real demand
💵 3. Network Revenue (how much money Aptos earns)
Aptos does not generate real revenue.
Reasons:
Very low transaction fees
No trading volume in DeFi
No popular apps or protocols
High inflation + massive token unlocks
Net revenue ≈ zero.
This means:
APT is not self-sustaining
token has almost no fundamental value
the ecosystem survives only on investor funds
(not on organic demand)
🚨 4. On-Chain Activity
📉 DEX volume:
At peak: $50–70M/day
Today: $2–5M/day (basically dead)
📉 New smart contracts:
Almost zero.
Developers have moved to Sui, Solana, Monad, Berachain.
📉 New projects:
No real ecosystem growth for over a year.
📉 NFT market:
Dead.
Even Sui and TON have more active NFT ecosystems.
💣 5. Tokenomics — Aptos’ biggest weakness
One of the worst tokenomics among L1 chains.
❌ 1. Enormous token unlocks for years ahead
Monthly unlocks go to:
investors
team
foundations
ecosystem grants
Creates constant selling pressure.
❌ 2. High inflation — 7%+ per year
❌ 3. Token has almost no utility
staking yield is low
no strong use case in DeFi
no natural demand beyond speculation
🟡 1-Month Outlook
Scenario:
🔻 Likely decline toward $1.00–1.20
Unlock pressure + weak demand.
🔂 Possible bounce
A technical rebound to $2.2–2.5 is possible,
but NOT a trend reversal.
🟠 3-Month Outlook
The key level is $1.00.
More likely scenario:
Break below $1 → move toward $0.60–0.70
Less likely:
Bounce from $1 → retest $2.5–3.0 → continue downward
Still bearish overall.
🔴 6-Month Outlook
Considering:
collapsing TVL
developer outflow
token inflation
weak ecosystem
no revenue
extremely bearish chart
🎯 6-Month target:
$0.40 – $0.70
If the market turns bullish, decline may slow down,
but the overall trend remains down.
🧠 Final Verdict
❌ Aptos is a weak, overvalued Layer-1 with minimal real adoption.
❌ Tokenomics are toxic.
❌ On-chain activity is near dead.
❌ Chart shows massive downside continuation.
❌ Not suitable for long-term investing.
✔️ Short-term trading opportunities exist (bounces / shorts).
✔️ For long-term exposure, better look at SOL, TON, ETH, BTC, SUI.

Aptos (APT): Entering The Local Lows | Looking For BounceAPT kept breaking lows step by step and finally tapped the main local low. This is the first place where buyers can try to build something, but we don’t have any real shift yet — just a reaction from the zone.
What we need now is a clean break of structure to confirm the reversal attempt. Until that BOS comes, this is only a bounce from support, but the area itself is strong enough to watch for the early signs of buyers stepping back in.
Swallow Academy

APT USDT LONG SIGNAL---
📢 Official Trade Signal – APT/USDT
📈 Position Type: LONG
💰 Entry Price: 1.7780
---
🎯 Take-Profit Targets (Partial Exits):
• TP1: 1.8100
• TP2: 1.8480
• TP3: 1.8880
• TP4: 1.9214
• TP5: 1.9532
• TP6: 2.0000
---
🛑 Stop-Loss: 1.7200
📊 Timeframe: 15m
⚖️ Risk/Reward Ratio: ≈ 2.34 (based on TP6)
💥 Suggested Leverage: 5× – 10×
---
🧠 Technical Analysis Summary
APT is showing signs of bullish momentum after holding above a key support area near 1.7750. The 15m chart suggests a potential upward shift if price breaks above immediate resistance around 1.8100. Higher lows and increasing buy pressure could propel APT toward the identified liquidity zones above.
The key upside targets are structured as follows:
1.8100 → 1.8480 → 1.8880 → 1.9214 → 1.9532 → 2.0000
A confirmed break above TP1 (1.8100) may accelerate upward movement toward 1.8880 and beyond.
---
⚙️ Trade Management Rules
✔ Take partial profit at each TP level
✔ Move SL to entry once TP1 is reached
✔ Trail stop-loss upward as price advances
✔ Do not re-enter if SL (1.7200) is triggered
✔ Confirm bullish structure on 15m chart before entering
---
📌 TradingView Hashtags
#APTUSDT #APT #CryptoSignal #LongTrade
#TradingView #FuturesTrading #TechnicalAnalysis
---
Let me know if you'd like this adjusted for a different style or translated into Persian.

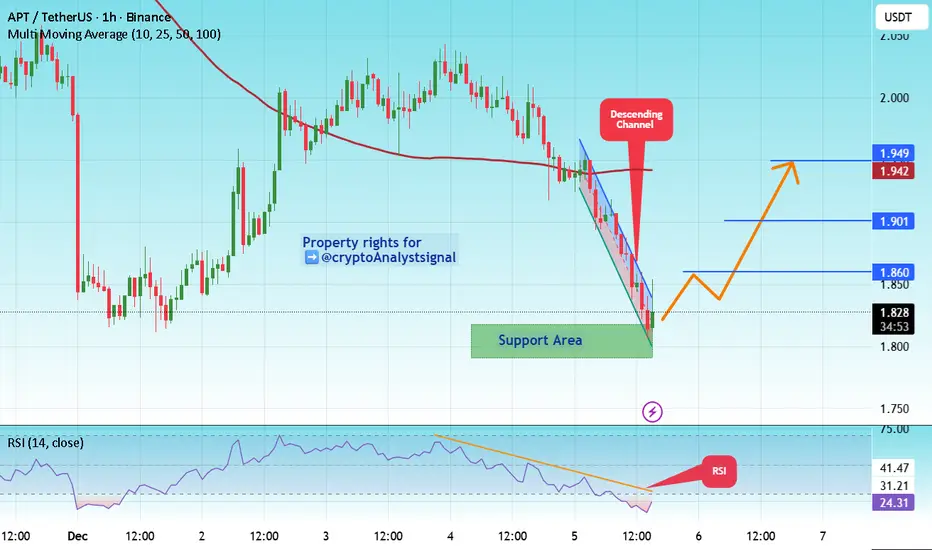
#APT/USDT 1H – Stablecoin-heavy, swing long from local base#APT
The price is moving in a descending channel on the 1-hour timeframe. It has reached the lower boundary and is heading towards a breakout, with a retest of the upper boundary expected.
We are seeing a bearish bias in the Relative Strength Index (RSI), which has reached near the lower boundary, and an upward bounce is expected.
There is a key support zone in green at 1.80. The price has bounced from this level several times and is expected to bounce again.
We are seeing a trend towards stabilizing above the 100-period moving average, which we are approaching, supporting the upward trend.
Entry Price: 1.82
First Target: 1.86
Second Target: 1.90
Third Target: 1.95
Remember a simple principle: Money Management.
Place your stop-loss order below the green support zone.
For any questions, please leave a comment.
Thank you.
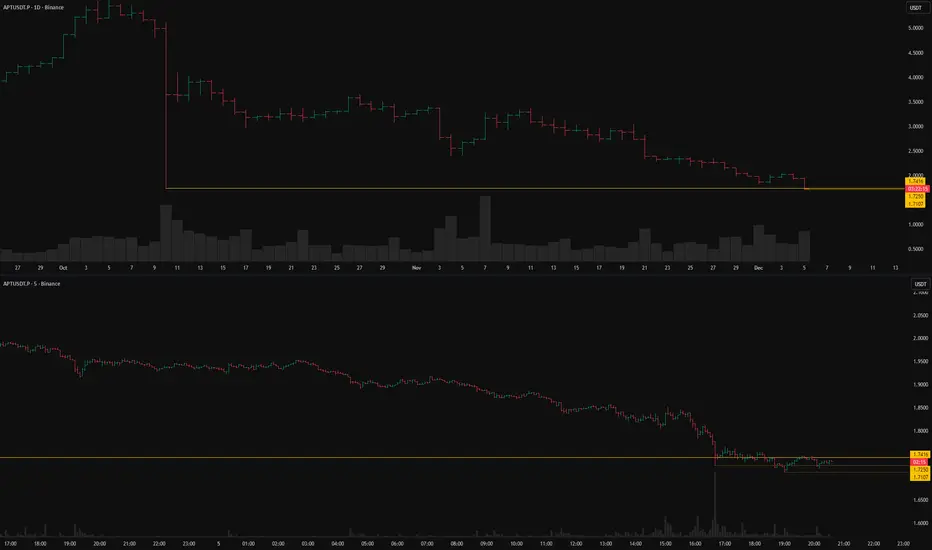
APTUSDT: short setup from daily support at 1.7416BINANCE:APTUSDT.P has approached a strong level at 1.7416. Today we are seeing a breakout attempt, but the lack of impulse suggests it might be a false break. However, we are also missing the sharp rejection (bounce) typical of a defended level. Instead, the price is "sawing" around the level. Therefore, it is prudent to either wait for a clear entry point from a newly formed local level or wait for the daily bar to close below the level and near its absolute low. Such a close would confirm price acceptance and the major players' intent to push the asset further down.
Key factors for this scenario:
Global & local trend alignment
Price void / low liquidity zone beyond level
Correlation with the market
No reaction after a false break
Closing near the level
Closing near the bar's extreme
Factors that contradict this scenario:
Yesterday's bar closed far from the level
Lack of consolidation near the level on the working lower timeframe
Was this analysis helpful? Leave your thoughts in the comments and follow to see more.
APT is forming a Double Bottom pattern🚨📊 APT Update
APT is forming a Double Bottom pattern,
a bullish reversal setup 🔄📈.
If price breaks out above the red resistance zone,
the first target will be the green line level 🟩🎯.

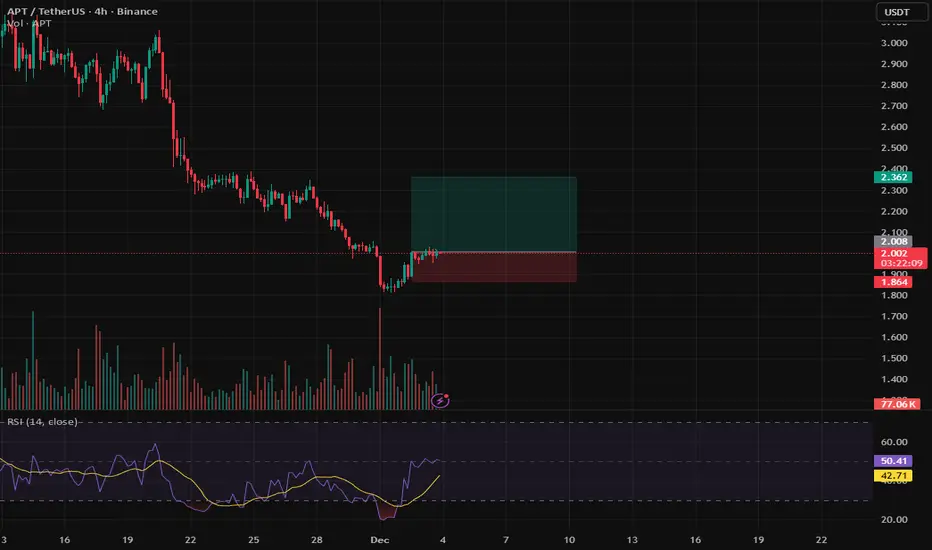
APTUSDT - bullish divergences APT has been in a sustained downtrend, forming a series of lower lows on the daily chart. However, the recent price action shows a bullish divergence between price and RSI:
1. Bullish Divergence
Price has made a lower low.
RSI has made a higher low.
This suggests weakening bearish momentum and a potential reversal or relief bounce.
Both swing lows on the chart and RSI lows are highlighted and connected, confirming the divergence pattern.
2. Entry Zone
The long entry is positioned just above the most recent candle after divergence confirmation.
Price is currently trading near support created by the descending trendline.
3. Stop-Loss
Stop-loss is set slightly below the recent swing low.
This protects the position in case bearish continuation invalidates the divergence.
4. Take-Profit Target
The take-profit region is placed near a previous resistance zone around 2.32–2.33 USDT, which aligns with a prior consolidation area.
This provides a favorable risk-to-reward ratio.
5. Concept Behind the Trade
Bullish divergence indicates sellers are losing strength.
Daily timeframe divergences often lead to strong corrective moves.
The setup is structured as a trend-exhaustion reversal attempt, aiming to capture a bounce back toward higher resistance.

apt long ideaapt usdt long ✅
ENTRY : 1.8270 - 1.7800✅
TARGETS :
1.8295
1.8320
1.8355
1.8370
1.8420
1.8490
1.8560
1.8600
1.8720
1.8900
1.9120
1.9240
1.9500
1.9710
1.9950
2.0500
2.0900
2.1200
2.1500
STOPLOSS : 1.7200 ✅
🔴RISKY TRADE USE LOW FUNDS !

APT has broken below the blue support level🚨📊 APT Update
APT has broken below the blue support level 🔵⬇️,
showing clear weakness as sellers take control.
This breakdown increases the chance of further downside
unless buyers quickly reclaim this zone.

showing signs of a potential reversal with increasing demand at Price is currently retesting the breakout zone after the first impulsive push upward. As long as this retest holds, the market has room to continue toward the next liquidity area. Stop-loss is placed below the recent higher low, maintaining a clean invalidation level for the setup.
#APT/USDT 1H – Stablecoin-heavy, swing long from local base#APT
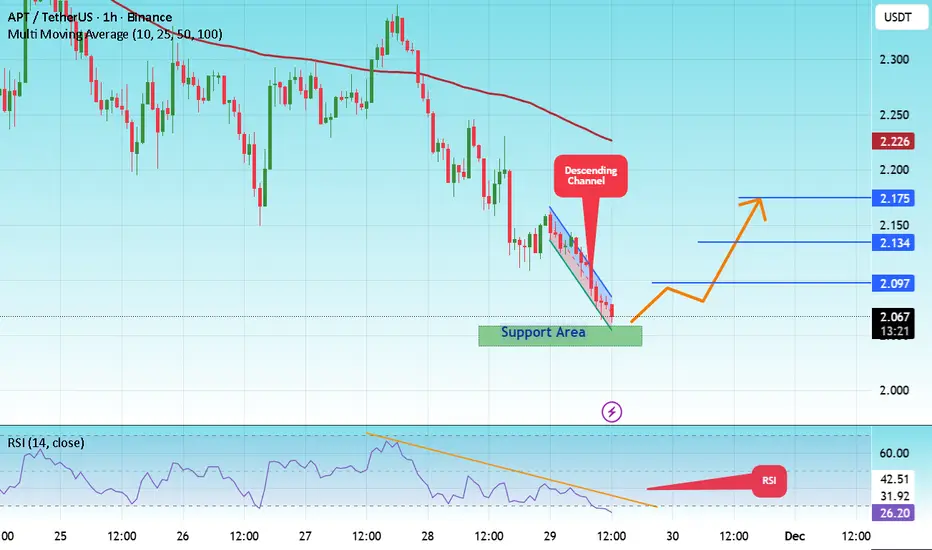
The price is moving in a descending channel on the 1-hour timeframe. It has reached the lower boundary and is heading towards a breakout, with a retest of the upper boundary expected.
We are seeing a bearish bias in the Relative Strength Index (RSI), which has reached near the lower boundary, and an upward bounce is expected.
There is a key support zone in green at 2.05. The price has bounced from this level several times and is expected to bounce again.
We are seeing a trend towards stabilizing above the 100-period moving average, which we are approaching, supporting the upward trend.
Entry Price: 2.06
First Target: 2.097
Second Target: 2.134
Third Target: 2.175
Remember a simple principle: Money Management.
Place your stop-loss order below the green support zone.
For any questions, please leave a comment.
Thank you.
#APT/USDT 1H – Stablecoin-heavy, swing long from local base#APT
The price is moving in a descending channel on the 1-hour timeframe. It has reached the lower boundary and is heading towards breaking above it, with a retest of the upper boundary expected.
We have a downtrend on the RSI indicator, which has reached near the lower boundary, and an upward rebound is expected.
There is a key support zone in green at 1.81. The price has bounced from this zone multiple times and is expected to bounce again.
We have a trend towards consolidation above the 100-period moving average, as we are moving close to it, which supports the upward movement.
Entry price: 1.84
First target: 1.87
Second target: 1.90
Third target: 1.95
Don't forget a simple principle: money management.
Place your stop-loss below the support zone in green.
For any questions, please leave a comment.
Thank you.

Aptos (APT): Is This Coin Dead? APT still looks weak on the higher timeframe, with price forming continuous lower lows and no clear support in sight. Because of that, we’re expecting further downside and will be watching the recent liquidity-grab area as the next logical zone where price could fall into.
That’s where we’ll look for a reaction. If buyers show strength there, the plan is to pick up a long from that zone. Until then, downside remains the most likely path.
Swallow Academy

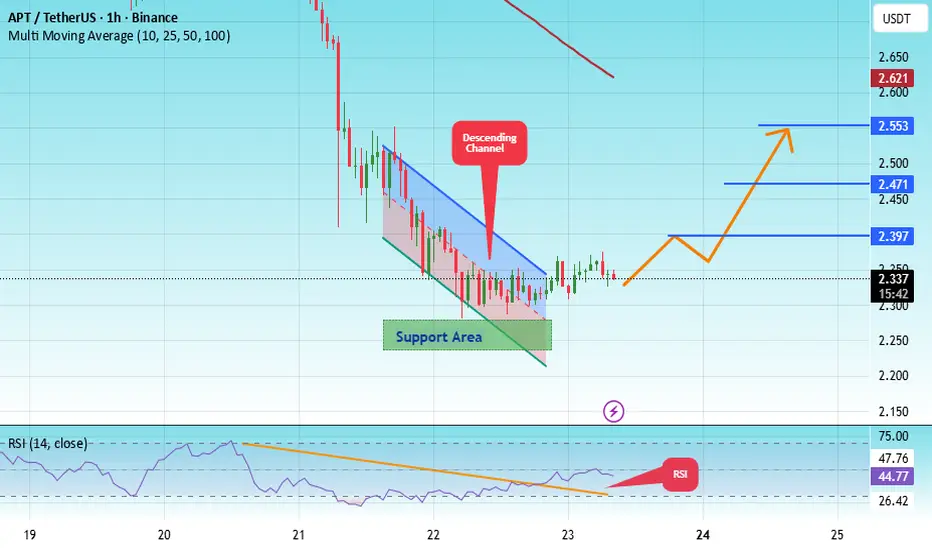
#APT/USDT 1H – Stablecoin-heavy, swing long from local base#APT
The price is moving within an ascending channel on the 1-hour timeframe and is adhering to it well. It is poised to break out strongly and retest the channel.
We have a downtrend line on the RSI indicator that is about to break and retest, which supports the upward move.
There is a key support zone in green at the price of 2.25, representing a strong support point.
We have a trend of consolidation above the 100-period moving average.
Entry price: 2.33
First target: 2.40
Second target: 2.47
Third target: 2.553
Don't forget a simple money management rule:
Place your stop-loss order below the support zone in green.
Once the first target is reached, save some money and then change your stop-loss order to an entry order.
For any questions, please leave a comment.
Thank you.
APT is Bearish (4H)It has a bearish structure. We have an iCH (liquidity grab / mitigation) on the chart, the overall power is bearish, and price is trading below a resistance line. Recently, a base has also broken to the downside, and all signs indicate a bearish outlook.
We can enter a sell/short position once the stop-loss (invalidation level) is tapped, targeting the levels marked on the chart.
Do not enter the position without capital management and stop setting
Comment if you have any questions
thank you
