#ARB/USDT | Testing Wedge Breakout Amid Key Support#ARB
The price is moving in a descending channel on the 1-hour timeframe. It has reached the lower boundary and is heading towards breaking above it, with a retest of the upper boundary expected.
We have a downtrend on the RSI indicator, which has reached near the lower boundary, and an upward reb

Arbitrum (ARB): Ideally We Should Breakout | Logically BreakdownARB keeps doing the same thing over and over again. Every attempt to push above the 200 EMA gets rejected, and right after that we see a break of local lows followed by another sellside move. If history repeats, the next thing we should see is one more sweep of local lows with a smaller continuation

ARBUSDT LONG SIGNAL📊 ARB/USDT Analysis
Bias: Bullish (Counter-trend rebound)
Entry Zone: 0.1945–
Stop Loss: 0.186
Targets:
TP1: 0.203
TP2: 0.212
TP3: 0.222
TP4: 0.234
Leverage: 3× – 5×
Technical Notes:
Price reacting to ascending support
Break above descending trendline
Demand zone holding
Momentum improving

ARB showing no signs of support... Yet.ARB is still trading within a well-defined daily downtrend, with price respecting the descending channel and holding below key moving averages. Structure remains bearish for now, so the broader trend hasn’t shifted.
Momentum, however, is telling a different story. Oscillators are heavily compressed

FireHoseReel | ARB 4H Range Structure with Pre-Breakout Zones🔥 Welcome To FireHoseReel !
Let’s dive into Arbitrum (ARB) analysis.
⛳️ ARB Fundamental Overview
Arbitrum (ARB) is an Ethereum Layer-2 scaling solution ranked #56 on CoinMarketCap. It makes transactions faster and cheaper while supporting many dApps.
👀 ARB 4H Overview
ARB is trading inside a 4-ho

Arbitrum (ARB) - scalp ideaThis is not a setup. These are just sketches and ideas. We need to closely monitor the reaction in the long FVG. The targets are indicated on the chart.
This is a risky idea. BINANCE:ARBUSDT.P

Arbitrum (ARB): Looking For Break of Local High | Good R:RARB is still stuck inside the range, but buyers are showing some life from the local bottom. Price is holding above that lower support and slowly pressing into the orange zone above.
The key level is still that local high. If buyers manage to break and hold above it, then the game plan shifts to lo

#ARB/USDT | Testing Wedge Breakout Amid Key Support#ARB
The price is moving in a descending channel on the 1-hour timeframe. It has reached the lower boundary and is heading towards breaking above it, with a retest of the upper boundary expected.
We have a downtrend on the RSI indicator, which has reached near the lower boundary, and an upward reb

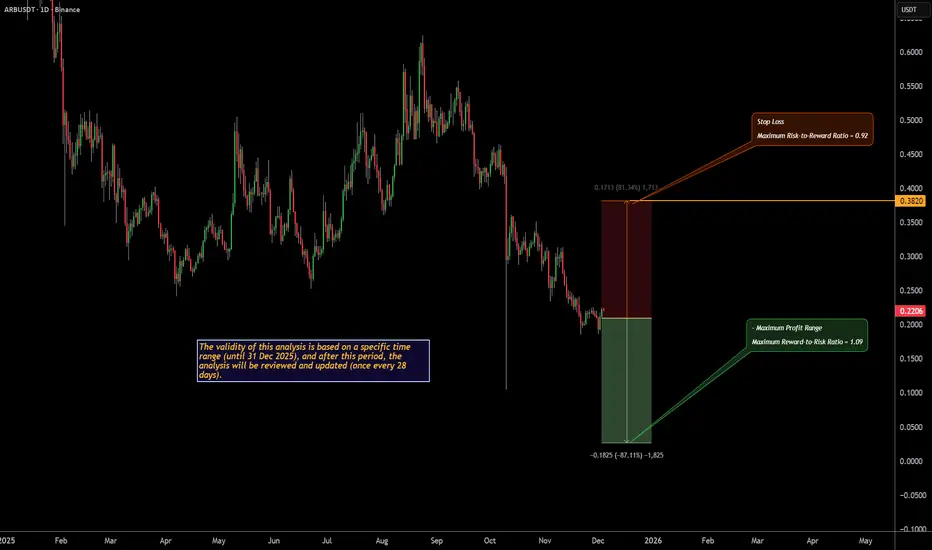
Monthly Crypto Analysis: Arbitrum (ARBUSD) – Issue 110 The analyst expects Arbitrum's price to decline by the specified end time, based on quantitative analysis.
The take-profit level only highlights the potential price range during this period — it’s optional and not a prediction that the market will necessarily reach it.
You don’t need to go all-in o
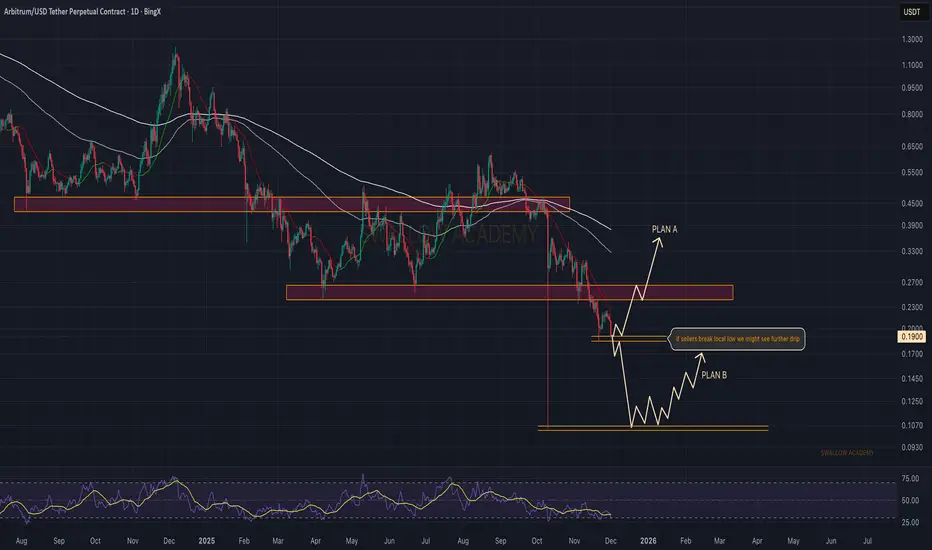
Arbitrum (ARB): Approaching Important Zone | Plan A & Plan BARB is trading right above a local support zone that has been reacting well in the past. For now the key level is the local low — if sellers break it, we’ll most likely see a deeper move into the lower support area where Plan B would activate.
But if buyers manage to hold this zone and push back ab
See all ideas
Summarizing what the indicators are suggesting.
Oscillators
Neutral
SellBuy
Strong sellStrong buy
Strong sellSellNeutralBuyStrong buy
Oscillators
Neutral
SellBuy
Strong sellStrong buy
Strong sellSellNeutralBuyStrong buy
Summary
Neutral
SellBuy
Strong sellStrong buy
Strong sellSellNeutralBuyStrong buy
Summary
Neutral
SellBuy
Strong sellStrong buy
Strong sellSellNeutralBuyStrong buy
Summary
Neutral
SellBuy
Strong sellStrong buy
Strong sellSellNeutralBuyStrong buy
Moving Averages
Neutral
SellBuy
Strong sellStrong buy
Strong sellSellNeutralBuyStrong buy
Moving Averages
Neutral
SellBuy
Strong sellStrong buy
Strong sellSellNeutralBuyStrong buy
Displays a symbol's price movements over previous years to identify recurring trends.