Is Brent Crude Setting Up for a Deeper Pullback?🔥 BRUTAL BRENT (UKOIL) SELL BLUEPRINT — Day & Swing Trade Guide! 🔥
Asset: BRENT “UKOIL” — Energies Market Trade Opportunity Guide (Day / Swing Trade)
Bias: Bearish Plan 📉
📍 Trade Setup Overview
The market is showing a clear downside narrative as liquidity continues shifting away from buyer strengt

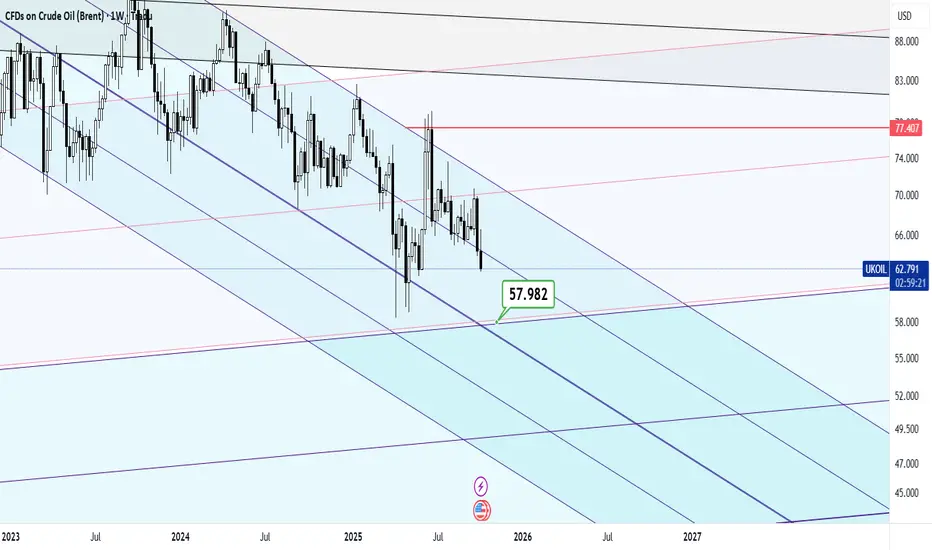
Brent Crude - a BEARISH outlook for the black metal to $51.87The most unexplained and naughty market on the market. Brent Crude.
Brent Crude has completed an M-top (double-top) formation and broken decisively below the 20- and 200-day moving averages, confirming a shift to a bearish market structure.
The failure to reclaim the moving averages, combined wi

Brent Oil Under Pressure – Key Resistance Zone Holding Strong!🔥 UKOIL / BRENT Energies Market Opportunity Blueprint (Day & Swing Plan) ⚡️
📉 Plan Overview:
Thief is spotting a Bearish Blueprint on UKOIL / Brent — price confirming rejection around the Triangular Moving Average (TMA) zone 📊. A clean pullback and retest structure are forming — time for a layered

XBR/USD Chart Analysis: Price Rebounds from a Seven-Week LowXBR/USD Chart Analysis: Price Rebounds from a Seven-Week Low
On 1 December, we outlined a descending channel on the XBR/USD chart and noted that the bearish trend was driven by fading geopolitical risks. Indeed, hopes for an end to the war in Ukraine—along with the possibility of sanctions on Russ

Brent Crude Bearish continuation below 6237 resistanceThe Brent Crude continues to display a bearish outlook, in line with the prevailing downward trend. Recent price action suggests a corrective pullback, potentially setting up for another move lower if resistance holds.
Key Level: 6237
This zone, previously a consolidation area, now acts as a signif

Zayed Al-Wasafi's excessive interest in targeting a price of $58Whatever we see from oil in the short term is considered a unique buying opportunity for astronomical and unprecedented goals in history, but for now we should think about the immediate goal!
Good luck
BRN: energy reductionIn recent sessions, BRN has shown a gradual shift in sentiment toward sellers. Oil’s movement consists of a series of downward impulses that form the basis for a bearish scenario.
The chart shows that the price is losing stability in the upper ranges and is attempting to consolidate below local lev

Brent Crude downtrend continuation The Brent Crude continues to display a bearish outlook, in line with the prevailing downward trend. Recent price action suggests a corrective pullback, potentially setting up for another move lower if resistance holds.
Key Level: 6417
This zone, previously a consolidation area, now acts as a signif

UKOIL M30 | Bullish Bounce Off Pullback SupportMomentum: Bullish
Price is currently above the ichimoku cloud.
Buy entry: 60.28
- Pullback support
- 50% Fib retracement
- 78.6% Fib projection
Stop Loss: 59.957
- Swing low support
Take Profit: 60.637
- Multi-swing high resistance
High Risk Investment Warning
Stratos Markets Limited (tradu.com

Energy market cools down: oil and gas under pressureOver the past three months, global prices for oil (#BRENT/#WTI) and gas (#GAS) have declined noticeably. Benchmark oil grades Brent and WTI have lost around 11–12%, ending the year near multi-month lows. U.S. natural gas has also entered a correction after a strong rally at the start of the wint

See all ideas
Displays a symbol's price movements over previous years to identify recurring trends.