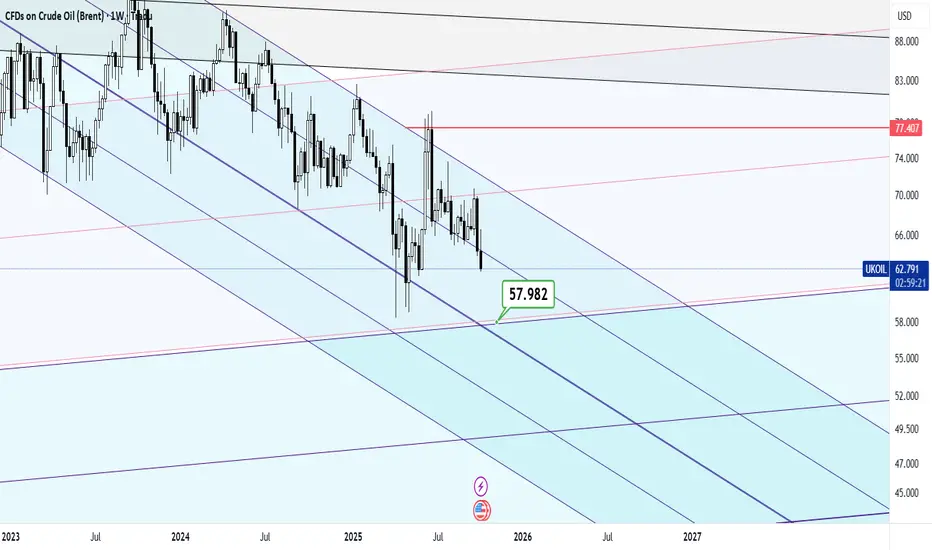
Is Brent Crude Setting Up for a Deeper Pullback?🔥 BRUTAL BRENT (UKOIL) SELL BLUEPRINT — Day & Swing Trade Guide! 🔥
Asset: BRENT “UKOIL” — Energies Market Trade Opportunity Guide (Day / Swing Trade)
Bias: Bearish Plan 📉
📍 Trade Setup Overview
The market is showing a clear downside narrative as liquidity continues shifting away from buyer strength. Volatility pockets + premium zones are forming the ideal backdrop for a controlled bearish play.
🎯 Entry
ANY PRICE LEVEL ENTRY
This setup focuses on structure, not perfection. Price exploration zones offer multiple opportunities to position short as long as the bearish narrative remains intact.
🛡️ Stop Loss
This is the Thief SL @ 62.500
Dear Ladies & Gentleman (Thief OG’s), adjust your SL based on your own system, risk comfort, and volatility tolerance.
Note: I am not recommending that you set only my SL — your capital, your control, your rules. Manage risk like a professional.
💰 Target
We have strong support, oversold confluence, and visible trap behaviour forming below, so the smart exit is clean and disciplined.
Target @ 59.500
Note: Dear Ladies & Gentleman (Thief OG’s), I am not recommending that you use only my TP. Make money, take money — at your own execution style & risk preference.
🔗 Related Pairs to Watch (Correlation Guide)
1️⃣ WTI Crude Oil — USOIL / CL
Moves closely with Brent (UKOIL).
If WTI weakens, Brent often mirrors the same bearish energy.
Watch for supply-zone rejections & macro oil inventory pressure.
2️⃣ Natural Gas — NGAS / XNGUSD
Energy sector sentiment often overlaps.
When overall energy demand weakens, oil tends to follow with downside momentum.
Good for gauging sentiment shifts.
3️⃣ CAD Pairs — USDCAD, CADJPY
Canada is an oil-exporting economy.
If oil falls, CAD weakens, making USDCAD push upward.
A great indirect correlation filter for confidence.
4️⃣ DXY — US Dollar Index TVC:DXY
A rising dollar = pressure on commodities.
Strong USD typically accelerates bearish moves on Brent.
5️⃣ S&P500 Energy Sector — AMEX:XLE
If energy equities sell off, it often preludes oil weakness.
Good higher-timeframe sentiment indicator.
🧩 Why These Correlations Matter
They help filter noise and add multi-asset confirmation.
When multiple correlated markets align, your trade idea gains more precision, timing, and conviction.
Smart traders don’t look at a single chart — they watch the entire ecosystem.
Market insights

Brent Crude - a BEARISH outlook for the black metal to $51.87The most unexplained and naughty market on the market. Brent Crude.
Brent Crude has completed an M-top (double-top) formation and broken decisively below the 20- and 200-day moving averages, confirming a shift to a bearish market structure.
The failure to reclaim the moving averages, combined with lower highs and accelerating downside momentum, opens the path toward the $51.87 downside target.
Fundamental Drivers (5 reasons)
Global Demand Softening 📉
Slower economic growth across Europe and China is reducing industrial and transportation fuel demand.
Strong US Dollar 💵
A firm dollar makes oil more expensive for non-USD buyers, pressuring global demand and prices.
High Inventories 🛢️
Elevated crude stockpiles signal oversupply and reduce urgency for buyers to bid prices higher.
OPEC+ Compliance Risk ⚠️
Market skepticism around full production discipline increases downside risk if supply leaks persist.

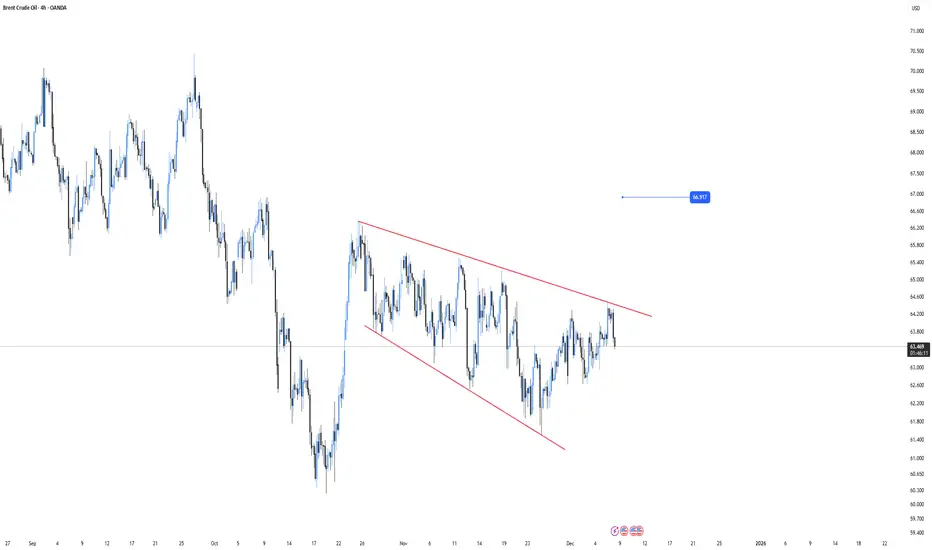
Brent Oil Under Pressure – Key Resistance Zone Holding Strong!🔥 UKOIL / BRENT Energies Market Opportunity Blueprint (Day & Swing Plan) ⚡️
📉 Plan Overview:
Thief is spotting a Bearish Blueprint on UKOIL / Brent — price confirming rejection around the Triangular Moving Average (TMA) zone 📊. A clean pullback and retest structure are forming — time for a layered sell approach to capitalize on energy market volatility ⚙️
🎯 Entry Idea:
Thief enters with multiple limit layers (Layering Strategy) — scaling in smartly with precision entries:
🔹 Sell Limits @ 64.500 / 64.000 / 63.500
(You can increase or adjust the layers based on your own conviction & market timing 🕰️)
🛑 Stop-Loss Guidance:
This is Thief’s SL @ 65.000 💣
Dear Ladies & Gentlemen (Thief OG’s), adjust your stop loss based on your risk appetite and confirmation setups. Risk management is the crown 👑 of consistency.
💰 Target Zone:
Watch out for the Police Barricade Zone @ 60.500 — this level aligns with strong support, potential oversold condition, and a trap + correction scenario 🔦
Escape with profits before liquidity hunts you — take money when you see money 💵
📘 Note to Thief OG’s:
I’m not recommending my SL or TP as mandatory levels — it’s your chart, your strategy, your risk, your reward. Trade smart, not emotional 🧠
🧩 Related Market Pairs to Watch:
🔸 WTI Crude (USOIL/USD) – Highly correlated with UKOIL. A bearish structure here often confirms momentum for Brent.
🔸 USD/CAD 💵 – Inverse correlation! A rising USD/CAD often strengthens the bearish sentiment in crude markets.
🔸 XLE (Energy ETF) – Keeps track of energy sector performance; confirmation of trend strength adds confluence to your trade.
📊 Key Market Correlations:
Oil reacts strongly to USD strength, global demand outlook, and OPEC sentiment. Keep an eye on DXY (US Dollar Index) — stronger dollar usually pressures Brent prices lower 💹
🚀 Thief Quote of the Day:
"Patience pays more than panic — layer in silence, exit in profit." 🕶️
#UKOIL #Brent #EnergyMarket #ThiefTrader #BearishSetup #LayeringStrategy #SwingTrade #OilMarket #WTI #USD #Commodities #TechnicalAnalysis

XBR/USD Chart Analysis: Price Rebounds from a Seven-Week LowXBR/USD Chart Analysis: Price Rebounds from a Seven-Week Low
On 1 December, we outlined a descending channel on the XBR/USD chart and noted that the bearish trend was driven by fading geopolitical risks. Indeed, hopes for an end to the war in Ukraine—along with the possibility of sanctions on Russia being eased—acted as a bearish catalyst.
In addition, the International Energy Agency reaffirmed its forecast for a record supply surplus and highlighted that global inventories have reached a four-year high.
Under the influence of these and other factors, such as signs of a slowdown in the Chinese economy, Brent crude fell to a seven-week low at point A. However, today the XBR/USD chart shows a bullish reversal, again triggered by geopolitics, according to media reports:
→ The United States has intercepted a sanctioned Venezuelan tanker, which Caracas described as an “act of piracy”.
→ Ukraine has struck another vessel from the “shadow fleet” linked to Russia’s oil trade.
Technical Analysis of XBR/USD
From a bearish perspective:
→ the $62.60 level (where the blue trendline was broken) remains a significant resistance zone;
→ bulls failed to preserve the gains from the A→B rally, as the price sank further to the low at point C;
→ the nearest resistance lies around $61.70.
From a bullish perspective:
→ the lower boundary of the channel may continue to act as support;
→ Brent crude has rebounded convincingly after a false bearish break below the November low—an indication of a potential liquidity grab, suggesting that “smart money” may be siding with demand.
Given these factors, geopolitical tensions may intensify, potentially driving XBR/USD back towards the median of the descending channel.
This article represents the opinion of the Companies operating under the FXOpen brand only. It is not to be construed as an offer, solicitation, or recommendation with respect to products and services provided by the Companies operating under the FXOpen brand, nor is it to be considered financial advice.

Brent Crude Bearish continuation below 6237 resistanceThe Brent Crude continues to display a bearish outlook, in line with the prevailing downward trend. Recent price action suggests a corrective pullback, potentially setting up for another move lower if resistance holds.
Key Level: 6237
This zone, previously a consolidation area, now acts as a significant resistance level.
Bearish Scenario (rejection at 6237):
A failed test and rejection at 6237 would likely resume the bearish momentum.
Downside targets include:
5910 – Initial support
5800 – Intermediate support
5700 – Longer-term support level
Bullish Scenario (breakout above 6237):
A confirmed breakout and daily close above 6237 would invalidate the bearish setup.
In that case, potential upside resistance levels are:
6300 – First resistance
6360 – Further upside target
Conclusion
Brent Crude remains under bearish pressure, with the 6237 level acting as a key inflection point. As long as price remains below this level, the bias favours further downside. Traders should watch for price confirmation around that level to assess the next move.
This communication is for informational purposes only and should not be viewed as any form of recommendation as to a particular course of action or as investment advice. It is not intended as an offer or solicitation for the purchase or sale of any financial instrument or as an official confirmation of any transaction. Opinions, estimates and assumptions expressed herein are made as of the date of this communication and are subject to change without notice. This communication has been prepared based upon information, including market prices, data and other information, believed to be reliable; however, Trade Nation does not warrant its completeness or accuracy. All market prices and market data contained in or attached to this communication are indicative and subject to change without notice.

Zayed Al-Wasafi's excessive interest in targeting a price of $58Whatever we see from oil in the short term is considered a unique buying opportunity for astronomical and unprecedented goals in history, but for now we should think about the immediate goal!
Good luck
BRN: energy reductionIn recent sessions, BRN has shown a gradual shift in sentiment toward sellers. Oil’s movement consists of a series of downward impulses that form the basis for a bearish scenario.
The chart shows that the price is losing stability in the upper ranges and is attempting to consolidate below local levels. Upward fluctuations appear more like pauses within the downward wave than genuine reversal attempts.
The fundamental backdrop also adds pressure: expectations of declining global demand and rising oil inventories in key regions provide an additional argument in favor of continued weakness.
As a result, BRN remains under the influence of bearish dynamics, where further development will depend on the market’s ability to stay within the current channel and confirm seller strength.

Brent Crude downtrend continuation The Brent Crude continues to display a bearish outlook, in line with the prevailing downward trend. Recent price action suggests a corrective pullback, potentially setting up for another move lower if resistance holds.
Key Level: 6417
This zone, previously a consolidation area, now acts as a significant resistance level.
Bearish Scenario (rejection at 6417):
A failed test and rejection at 6417 would likely resume the bearish momentum.
Downside targets include:
6235 – Initial support
6177 – Intermediate support
6120 – Longer-term support level
Bullish Scenario (breakout above 6417):
A confirmed breakout and daily close above 6417 would invalidate the bearish setup.
In that case, potential upside resistance levels are:
6464 – First resistance
6530 – Further upside target
Conclusion
Brent Crude remains under bearish pressure, with the 6417 level acting as a key inflection point. As long as price remains below this level, the bias favours further downside. Traders should watch for price confirmation around that level to assess the next move.
This communication is for informational purposes only and should not be viewed as any form of recommendation as to a particular course of action or as investment advice. It is not intended as an offer or solicitation for the purchase or sale of any financial instrument or as an official confirmation of any transaction. Opinions, estimates and assumptions expressed herein are made as of the date of this communication and are subject to change without notice. This communication has been prepared based upon information, including market prices, data and other information, believed to be reliable; however, Trade Nation does not warrant its completeness or accuracy. All market prices and market data contained in or attached to this communication are indicative and subject to change without notice.

UKOIL
Oil is completing a complex corrective pattern, and the current wave is a branch of the corrective wave forming a

UKOIL Bearish Opportunity — Is This the Pullback to Sell?🛢️ BRENT CRUDE (UKOIL) - BEARISH SWING TRADE SETUP 📉
📊 CURRENT MARKET DATA (Live as of Nov 21, 2025)
Brent Crude: $64.07/barrel (+0.88% from previous day)
WTI Crude: $57.77/barrel (-2.09% from previous day)
Market Status: Bearish momentum with descending channel pattern confirmed
🎯 TRADE SETUP - BEARISH CONFIRMATION
📍 ENTRY STRATEGY: Layered Limit Orders (Thief Method)
Layer 1: 63.00
Layer 2: 62.50
Layer 3: 62.00
(Scale entries based on your risk tolerance - add more layers if desired)
🛑 STOP LOSS: 64.00
⚠️ Risk Disclaimer: Adjust SL according to YOUR strategy and risk management. This is reference only - manage YOUR capital YOUR way.
🎯 PRIMARY TARGET: 60.50
Strong support zone identified
Oversold conditions anticipated
Trap zone detected - secure profits accordingly
💡 Exit Strategy Note: Not financial advice. Take profits when YOUR targets align with YOUR risk/reward ratio.
📈 TECHNICAL CONFLUENCE
✅ Volume-weighted moving average pullback confirmed
✅ Retest of resistance completed
✅ Descending channel pattern active
✅ Bearish momentum building
🔗 CORRELATED ASSETS TO MONITOR
1. WTI CRUDE (USOIL) 💵
Current: $57.77/barrel
Correlation: Direct (85%+ correlation with Brent)
Watch for breakdown below $57.00 support
2. USD/CAD
Inverse Correlation with oil prices
CAD weakens when oil falls
Monitor for USD strength continuation
3. ENERGY SECTOR ETFs 📊
XLE (Energy Select Sector SPDR)
XOP (Oil & Gas Exploration ETF)
Follow for confirmation of sector weakness
4. NATURAL GAS (NATGAS) ⚡
Parallel Energy Market
Similar bearish patterns observed
Confirms broader energy sector weakness
5. RUSSIAN RUBLE (USD/RUB)
Oil-dependent currency
Weakens with falling oil prices
Geopolitical risk indicator
🌍 KEY MARKET FACTORS
⚠️ Supply Pressure
Increased global production capacity
OPEC+ policy uncertainties
📉 Demand Concerns
Global economic slowdown fears
Industrial activity softening
💵 Dollar Strength
Stronger USD = Lower oil prices
Monitor Federal Reserve policy
⚡ RISK MANAGEMENT REMINDER
🚨 Ladies & Gentlemen (Thief OG's) - This is NOT financial advice:
✓ Position size according to YOUR account
✓ Never risk more than you can afford to lose
✓ Adjust stops based on YOUR strategy
✓ Take profits at YOUR comfort levels
✓ Market can remain irrational longer than you can stay liquid
Your Capital = Your Responsibility = Your Profits/Losses
🎯 Trade Smart | Stay Disciplined | Manage Risk 🎯

Energy market cools down: oil and gas under pressureOver the past three months, global prices for oil (#BRENT/#WTI) and gas (#GAS) have declined noticeably. Benchmark oil grades Brent and WTI have lost around 11–12%, ending the year near multi-month lows. U.S. natural gas has also entered a correction after a strong rally at the start of the winter season.
Factors Behind the Decline:
#BRENT — U.S. production is at record levels, supplies from Brazil and other countries are rising, and some African oil remains unsold for extended periods. As a result, Brent struggles to stay above $60 , with any price rebound quickly sold off.
#WTI — Economic and fuel demand forecasts have weakened, while crude oil and fuel inventories continue to grow, making WTI more vulnerable to selling on pullbacks.
#GAS — In autumn, gas prices surged on colder weather forecasts and record exports, but later forecasts turned milder, production stayed high, and inventories remained sufficient — leading to a price correction.
Brent and WTI are ending the year amid a clear supply surplus: record U.S. output and rising supplies from other regions prevent prices from holding above recent levels, while OPEC+ has not yet moved toward aggressive production cuts. This suggests that the risk of a gradual further decline in oil prices may persist into early next year.
The gas market follows the same logic: high production, well-filled storage facilities, and a relatively mild winter create room for prices to move lower after the recent rally. Altogether, this makes #BRENT, #WTI, and #GAS vulnerable to a continuation of the correction unless there is an unexpected surge in demand or a sharp supply disruption.
FreshForex analysts note that in the coming months, the price trajectory of oil (#Brent/#WTI) and natural gas (#GAS) will largely depend on whether the supply surplus persists, how the global economy develops, and whether expectations of a mild winter are confirmed. In such an environment, investors and traders are advised to maintain strict risk management and closely monitor news from the commodity markets.

Brent SELLNot a good R:R but worth trying. Upper yellow band is another SELL area with a good R:R
Notes to myself...Appreciate your ideas

UKOIL H4Oil has reached an important area and is expected to start its upward movement towards the specified targets after consolidation.

Expanding Correction Before a Potential Bullish ImpulseBrent crude has been developing inside a broadening / expanding corrective structure after the previous impulsive decline.
The volatility within this formation suggests indecision, yet the overall flow still fits the classic sequence of:
Impulse → Expanding Correction → Potential Next Impulse.
From a technical perspective, price has repeatedly respected the boundaries of the expanding structure, building a base of higher lows and compressing toward a breakout zone. A confirmed break above the upper trend line would unlock bullish momentum, with the 66.80–67.00 region standing out as the first major target due to unfilled inefficiencies and prior liquidity clusters.
What reinforces this scenario is that multiple technical analysts currently view the ongoing consolidation as a corrective phase rather than the start of a new bearish trend. Several independent traders identify the same broadening pattern, expecting a bullish expansion once the correction completes.
Fundamentally, short-term sentiment also supports the possibility of a rebound. Demand forecasts have recently stabilized, OPEC+ continues to manage supply conditions, and weekly inventory fluctuations have provided intermittent support for crude. These factors often allow corrective structures to resolve upward before broader macro trends take over.
At the institutional level, Goldman Sachs projects Brent to average near the mid-66s in the second half of 2025, aligning closely with the structural target from this chart. However, it is worth noting that EIA and S&P Global caution that global supply could still outweigh demand later on—meaning any bullish impulse may be limited unless fundamental conditions shift.
In summary:
The market structure supports a bullish breakout scenario.
Technical analysts widely agree on the expanding correction framework.
Short-term fundamentals allow for a recovery toward 66–67.
Longer-term outlook remains mixed, so managing risk above key resistance is essential.
This is an observational analysis, not financial advice.

Outlook for BrentCash This is my chart analysis and outlook for BrentCash in the coming days or weeks. It's just an anticipation based on the current price movement and market direction which is clearly bearish and may remain Bearish for sometime.

Brent oil When they finally rid us of Zelda and the euro weirdo leaders.
Laughs aside, I see trouble ahead. Turmoil on a global scale. When the masses realise what there leaders have been hiding .
Enough already this is purely a geometric forecast.

Brent Crude bearish trend continuation capped at 6417The Brent Crude continues to display a bearish outlook, in line with the prevailing downward trend. Recent price action suggests a corrective pullback, potentially setting up for another move lower if resistance holds.
Key Level: 6417
This zone, previously a consolidation area, now acts as a significant resistance level.
Bearish Scenario (rejection at 6417):
A failed test and rejection at 6417 would likely resume the bearish momentum.
Downside targets include:
6235 – Initial support
6177 – Intermediate support
6120 – Longer-term support level
Bullish Scenario (breakout above 6417):
A confirmed breakout and daily close above 6417 would invalidate the bearish setup.
In that case, potential upside resistance levels are:
6464 – First resistance
6530 – Further upside target
Conclusion
Brent Crude remains under bearish pressure, with the 6417 level acting as a key inflection point. As long as price remains below this level, the bias favours further downside. Traders should watch for price confirmation around that level to assess the next move.
This communication is for informational purposes only and should not be viewed as any form of recommendation as to a particular course of action or as investment advice. It is not intended as an offer or solicitation for the purchase or sale of any financial instrument or as an official confirmation of any transaction. Opinions, estimates and assumptions expressed herein are made as of the date of this communication and are subject to change without notice. This communication has been prepared based upon information, including market prices, data and other information, believed to be reliable; however, Trade Nation does not warrant its completeness or accuracy. All market prices and market data contained in or attached to this communication are indicative and subject to change without notice.

Brent Crude Short Set up
The technical sell signal for Brent Crude aligns with a broadly bearish fundamental outlook driven by concerns over a persistent global supply glut heading into 2026.
Resistance Rejection: Price is bouncing bearishly off the upper edge of the 4H channel.
Bearish Confirmation: A Bearish Engulfing candlestick pattern has formed, signaling a decisive shift in sentiment.
Momentum Shift: The Relative Strength Index (RSI) has broken below its 50-level and its own Moving Average, indicating that momentum has swung from bullish to bearish.
Fundamental Analysis: The Supply Glut
The primary fundamental pressure pushing Brent prices lower is the expected oversupply in the global oil market, a factor that overshadows moderate demand growth and geopolitical risks.
The fundamental picture supports a downside move, with many major research institutions revising their 2026 Brent price forecasts lower, often into the $60–$62 range, largely due to the risk of an unprecedented global oversupply.
The current $61.00 technical target aligns with the lower end of the projected price corridor and a major support level.

UKOIL – Falling Wedge Breakout Target (30m Timeframe)Crude Oil Brent (UKOIL) on the 30-minute timeframe has broken out of a clean Falling Wedge pattern, a formation widely recognized as a bullish reversal structure. After a prolonged decline, price compressed within two downward-sloping trendlines before surging higher with a breakout.
🔍 Key Technical Highlights
A well-defined falling wedge has been in play for several sessions, with multiple touches on both the upper and lower boundaries.
Price action shows strong accumulation near the wedge’s lower support, followed by a sharp upward breakout.
Falling wedges typically indicate exhaustion in selling pressure and the beginning of a bullish reversal.
The measured-move projection, taken from the wedge height, points toward the $65.00–$65.50 zone.
The momentum after the breakout suggests buyers are gaining control.
🎯 Bullish Breakout Target
Target Zone: ~$65.00 – $65.50
(based on wedge height projection)
⚠️ Notes for Traders
A successful continuation requires price to hold above the wedge’s upper boundary.
Retests of the breakout area may offer favorable entry setups.
Failure to hold above $62.80–$63.00 could signal weakening momentum.
Oil markets react strongly to geopolitical and supply-related news—protect your trades with proper risk management.

XBR/USD: Geopolitics Are Once Again Driving Brent Crude PricesXBR/USD Chart Analysis: Geopolitics Are Once Again Driving Brent Crude Prices
On 21 November, we outlined a descending channel on the XBR/USD chart and noted that the bearish trend had been fuelled by easing geopolitical risks and hopes for an end to the war in Ukraine.
Ten days later, Brent crude is now trading above its late-November highs — once again driven by geopolitical developments.
Why is Oil Rising?
US President Donald Trump stated that the airspace over and around Venezuela “should be considered completely closed”. This immediately led to flight cancellations, created a de facto blockade, and raised the threat of military action in an oil-rich region. This risk premium is being priced into the current rally.
In addition, OPEC+ members have confirmed they will postpone the production increases planned for early 2026 — setting the stage for a potential supply deficit, especially if Venezuelan exports are disrupted.
XBR/USD Technical Analysis
Although there was no further downside extension, the descending channel remains valid. The downward move was met with strong buying interest (evident from the long lower wicks on candles in late November around $61.50), triggering an upward reversal from the channel’s lower boundary.
This week opened with a bullish gap, followed by a large bullish candle on the 4-hour chart — a sign of limited selling pressure and market expectations of higher prices.
However, Brent’s advance may soon stall due to nearby resistance zones:
→ around $63.90 (the 20 November high);
→ at the upper boundary of the channel.
Should sellers regain control, support may be found in the area between:
→ the channel’s median line;
→ the lower edge of the gap at $62.78.
This article represents the opinion of the Companies operating under the FXOpen brand only. It is not to be construed as an offer, solicitation, or recommendation with respect to products and services provided by the Companies operating under the FXOpen brand, nor is it to be considered financial advice.


