BTC prediction end of november 2025 I think we have reach the bottom and now it will go upwards to the upper green dotted line.
I hope this will be right 💪🏻🧑🎄🎄
Happy XMas trading for everyone 😇
Trade ideas

BTC -> 44k -> 17k📉 Scenario 1 — BTC →44k
• Fed stays tight → less liquidity.
• Strong USD → pressure on all risk assets.
• ETF inflows slow → weaker demand.
• One derivatives flush takes BTC to 44k liquidity zone.
Meaning:
A normal heavy correction, not a collapse.
🔥 Scenario 2 — BTC → 17k (Feb–Mar 2025)
Worst-case
• Global liquidity crisis (banks, China, debt).
• ETF outflows turn into forced BTC selling.
• Massive liquidation cascade (OI wipeout).
• Miners capitulate → panic accelerates.
Meaning:
A full breakdown event similar to 2020/2022 — fast, violent, fear-based.
⸻
If you read it as a beginner, you understand:
• 44k = normal correction.
• 17k = crisis-level collapse.

BTC -> 44k -> 17 = 2026📉 Scenario 1 — BTC → 44k
• Fed stays tight → less liquidity.
• Strong USD → pressure on all risk assets.
• ETF inflows slow → weaker demand.
• One derivatives flush takes BTC to 44k liquidity zone.
Meaning:
A normal heavy correction, not a collapse.
🔥 Scenario 2 — BTC → 17k (Feb–Mar 2025)
• Global liquidity crisis (banks, China, debt).
• ETF outflows turn into forced BTC selling.
• Massive liquidation cascade (OI wipeout).
• Miners capitulate → panic accelerates.
Meaning:
A full breakdown event similar to 2020/2022 — fast, violent, fear-based.
If you read it as a beginner, you understand:
• 44k = normal correction.
• 17k = crisis-level collapse.

My Prediction for BTC 2025-2026 Bouncing between the Green lines !
I hope you understand my chart! What goes up must come down and vice versa! What goes down must go up! Also see the fair value gaps hitting 🫣🤩 I hope to validate! Let’s see if and when 🤓
Greetings and happy trading 🫡

BITCOIN/ EURO. THROW YOUR HANDS IN THE AIR - THE ROOF IS ON FIREThe main technical graph is Bitcoin in Euro, and yes..
.. the major supports of 52-week SMA and 3-year old trend have been broken.
Feels, this is the roof.. and the roof is on fire.
// we don't need no crypto
let the motherfucker burn
--
Best wishes,
@PandorraResearch Team

Retest 200day MA, retest long-term trendline, back upA positive look on the market.
We have broken the 200day MA and historically we will test it again from the other side. So that means that it will go back to the blue line. Hopefully sooner later than rather, the process can be drawn out but generally we will go back to it.
I think it will come sooner than later. After that it can retest the red long-term trendline (drawn by connecting all the recent weekly lows) that we have broken today.
So it can be support again.
Then from there on we will probably be December already and the government shutdown will have ended and the liquidity will come in the system. So I expect back up from there.
In my view, this is a... Good buying opportunity!

BITCOIN/ EURO. THIS IS THE END...The main technical graph is Bitcoin in Euro, and yes..
.. it nears to break the major 52-week SMA and 3-year old trend supports.
Feels, this is it the end.

BTC weekly supportLose the 50 MA (blue line) on a weekly close and we're in BEAR territory.
As long as we stay above it it's BULL time...

Danger - Bitcoin invalidated a key level!!! (crash possible)- update on this analysis where Bitcoin broke out and hence the appropriate bias was bullish
- with such a key level now failing the implications are big
- it is entirely possible Bitcoin experiences a -30% drop from here
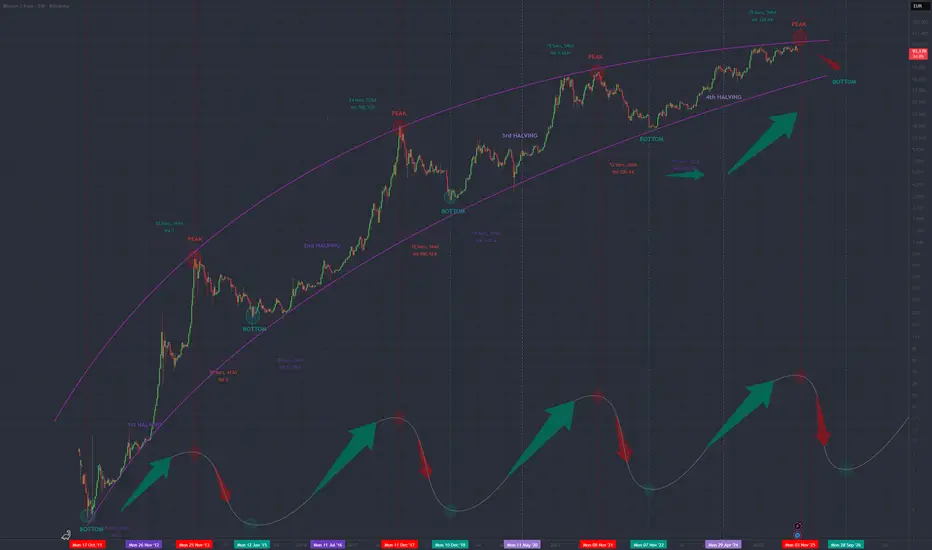
A 4 year bitcoin cycle in actionBitcoin's four-year cycle, driven by halving events that reduce supply, has historically delivered consistent, though diminishing, returns. Considering the recent April 2024 halving BTC may have already peaked in October 2025, hitting a high of $126,000, aligning with historical timing patterns. Analysts suggest this peak is likely due to a continuation of the roughly 3.4x reduction in gains per cycle, projecting a top around $120,000-140,000. While institutional adoption via ETFs may moderate future volatility, the cyclical pattern remains structurally intact. According to the model the next major buying opportunity is projected for late 2026, after a potential correction to the $60,000-$80,000 range.

BTC/EUR breakout - Bitcoin´s parabolic move to finally begin- this is the culmination of a long thread of analysis that started with USDT D. clearly being in a distribution range but taking its sweet time consolidating before the eventual breakdown (which would imply crypto upside)
- during summer BTC has produced several rallies that were noise and did not lead to meaningful change of market structure - and btc/euro was the key signal in that regard
- as of today it looks like btc/euro has finally broken out which implies this Bitcoin move is real
- given how low monthly volatility is (comments), with the breakout now confirmed, I expect more or less vertical PA from now until the end of the year
- final target of this volatility burst is anywhere from 240 - 320k per Bitcoin

BITCOIN, new all-time high in October/November?The weight of seasonality on the bitcoin cycle
Historically, September has rarely been favorable to bitcoin: increased volatility, false breakouts, and often negative performances make it a tricky month for investors. Yet, these late-summer consolidation phases have often served as a springboard for the autumn recovery. In the current cycle, which began in the fall of 2022, September lows resemble major bottoms that statistically precede the start of a much more constructive phase. The fourth quarter is indeed the one where bitcoin traditionally shows its best performances, notably thanks to renewed buying flows in October and November. This cyclical setup fuels the scenario of a final leg up before the expected exhaustion of the current bullish cycle and the onset of a longer corrective phase, anticipated for 2026. In other words, entering the last quarter often constitutes the most favorable moment to capture the market’s ultimate bullish momentum.
The decisive role of global liquidity
Beyond bitcoin’s seasonality, the fourth quarter of 2025 could benefit from a key macroeconomic factor: the shift of the Treasury General Account (TGA), the U.S. Treasury’s account at the Federal Reserve. This mechanism is essential to understanding global liquidity: when the Treasury issues bonds to fill its account, it drains cash from the markets, reducing risk appetite. This liquidity drain has weighed in recent months on financial assets, including bitcoin. But once this replenishment is complete, money is gradually reinjected into the economy through public spending, creating the opposite effect: improved financial conditions and a return of flows toward risky markets. The timeline suggests this shift will occur starting in October, right in the heart of bitcoin’s most favorable seasonal period.
A rare alignment of technical and fundamental factors
If we combine bitcoin’s historical cyclicality with this liquidity dynamic, the last quarter of 2025 appears as a strategic window for investors. The market could benefit from a doubly supportive environment: on the one hand, statistically favorable seasonality attracting short-term capital, and on the other, a macroeconomic context where abundant liquidity sustains risk appetite. Added to this are structural elements such as the reduced supply after the halving and growing demand fueled by ETFs, which reinforce this segment of the cycle’s potential. In this context, the fourth quarter is not just a repetition of past trends: it could mark the peak of a bullish cycle that began three years earlier, offering a final valuation opportunity before the establishment of a more enduring bear market in 2026.
DISCLAIMER:
This content is intended for individuals who are familiar with financial markets and instruments and is for information purposes only. The presented idea (including market commentary, market data and observations) is not a work product of any research department of Swissquote or its affiliates. This material is intended to highlight market action and does not constitute investment, legal or tax advice. If you are a retail investor or lack experience in trading complex financial products, it is advisable to seek professional advice from licensed advisor before making any financial decisions.
This content is not intended to manipulate the market or encourage any specific financial behavior.
Swissquote makes no representation or warranty as to the quality, completeness, accuracy, comprehensiveness or non-infringement of such content. The views expressed are those of the consultant and are provided for educational purposes only. Any information provided relating to a product or market should not be construed as recommending an investment strategy or transaction. Past performance is not a guarantee of future results.
Swissquote and its employees and representatives shall in no event be held liable for any damages or losses arising directly or indirectly from decisions made on the basis of this content.
The use of any third-party brands or trademarks is for information only and does not imply endorsement by Swissquote, or that the trademark owner has authorised Swissquote to promote its products or services.
Swissquote is the marketing brand for the activities of Swissquote Bank Ltd (Switzerland) regulated by FINMA, Swissquote Capital Markets Limited regulated by CySEC (Cyprus), Swissquote Bank Europe SA (Luxembourg) regulated by the CSSF, Swissquote Ltd (UK) regulated by the FCA, Swissquote Financial Services (Malta) Ltd regulated by the Malta Financial Services Authority, Swissquote MEA Ltd. (UAE) regulated by the Dubai Financial Services Authority, Swissquote Pte Ltd (Singapore) regulated by the Monetary Authority of Singapore, Swissquote Asia Limited (Hong Kong) licensed by the Hong Kong Securities and Futures Commission (SFC) and Swissquote South Africa (Pty) Ltd supervised by the FSCA.
Products and services of Swissquote are only intended for those permitted to receive them under local law.
All investments carry a degree of risk. The risk of loss in trading or holding financial instruments can be substantial. The value of financial instruments, including but not limited to stocks, bonds, cryptocurrencies, and other assets, can fluctuate both upwards and downwards. There is a significant risk of financial loss when buying, selling, holding, staking, or investing in these instruments. SQBE makes no recommendations regarding any specific investment, transaction, or the use of any particular investment strategy.
CFDs are complex instruments and come with a high risk of losing money rapidly due to leverage. The vast majority of retail client accounts suffer capital losses when trading in CFDs. You should consider whether you understand how CFDs work and whether you can afford to take the high risk of losing your money.
Digital Assets are unregulated in most countries and consumer protection rules may not apply. As highly volatile speculative investments, Digital Assets are not suitable for investors without a high-risk tolerance. Make sure you understand each Digital Asset before you trade.
Cryptocurrencies are not considered legal tender in some jurisdictions and are subject to regulatory uncertainties.
The use of Internet-based systems can involve high risks, including, but not limited to, fraud, cyber-attacks, network and communication failures, as well as identity theft and phishing attacks related to crypto-assets.

PUMPTOBER: History Repeats Faster🎃 PUMPTOBER: History Repeats Faster 🔁📈
October Bitcoin behavior isn't random — it's a 4-year rhythm becoming more efficient.
⏱️ The Historical Compression:
📍 2017: 5x gain in about 60 days
📍 2021: 2.5x gain in about 45 days
📍 2025: 1.25x potential in 30 days? (€97,300 → €121,625)
🔍 Current Setup:
BTC/EUR is holding strong around €97,300 , positioned at the midline of a multi-year ascending channel. The pattern suggests the same October catalyst, but now with adoption-driven compression — smaller multipliers, faster execution.
🔑 Key Levels:
Support holding: €97,300
First resistance: €103,754
Channel target: €121,625–€123,753
My USDT Chart target: $138,888 (in dollars)
📈 The Maturity Thesis:
As Bitcoin transitions from speculation to adoption, volatility diminishes but velocity increases.
🕰️ The 2017 parabola took 60 days.
⚡ The 2021 move compressed to 45 days.
🔥 If the pattern holds, 2025 could deliver its full wave in just 30 days — by month’s end.
This isn’t about chasing 5x returns. It’s about recognizing that a 25% move in a $116K asset = a $29K gain.
The percentage shrinks. The absolute value doesn’t.
📊 Chart Structure:
Three vertical markers show October 1st across cycles. The curve demonstrates logarithmic decay — expected behavior as market cap expands.
Price is currently testing the middle band, with clear room toward the upper channel boundary.
Professor remains structurally bullish while support holds. The cycle hasn't disappeared — it's evolved.
💡 Thought of the Day
“Bitcoin will not do 5x in a month anymore.
Adoption brings speed over size.
The cycle still beats — it just hits different.”
📌 Disclaimer
This analysis reflects my personal market observations and is not financial advice. I am not a licensed financial advisor. All trading carries risk. You are solely responsible for your own decisions.
One Love,
The FXPROFESSOR 💙

#BTCEUR #1D (Binance) Bull-flag breakout and retestBitcoin looks very good for bullish continuation after regaining 50MA support on daily, against the Euro.
⚡️⚡️ #BTC/EUR ⚡️⚡️
Exchanges: Binance
Signal Type: Regular (Long)
Amount: 12.0%
Entry Targets:
1) 93017.86
Take-Profit Targets:
1) 108422.28
Stop Targets:
1) 85296.36
Published By: @Zblaba
CRYPTOCAP:BTC BINANCE:BTCEUR #Bitcoin #PoW bitcoin.org
Risk/Reward= 1:2.0
Expected Profit= +16.6%
Possible Loss= -8.3%
Estimated Gaintime= 1-2 months

Bitcoin Update August 2025 Rising Wedge Pattern -> Bearish Bias Pair: BTC/EUR – 1D – Binance
Bitcoin has been forming a rising wedge pattern over the past months, which statistically breaks downwards in most cases. The price already failed to hold the lower trendline, which confirms the bearish scenario for now.
Key takeaways from my analysis:
Pattern: Rising wedge → High probability of a downside move
Current situation: Price broke the lower support trendline
Target zones:
Level 1: First major support
Level 2: Strong demand zone / possible bounce area
Sentiment: Many “moon boys” are still expecting a breakout to new highs, but structurally the chart looks weak. If this breakdown continues, those chasing FOMO rallies might get rekt again.
⚠️ Disclaimer: This is not financial advice. Always do your own research and manage your risk.

BTC vs Gold (BTC/XAU) – 1M Chart⚖️ BTC vs Gold (BTC/XAU) – 1M Chart
Observations:
• BTC/XAU is still below macro resistance (~36.0), which has acted as a multi-cycle ceiling since 2021.
• Every prior monthly rejection from this zone led to macro pullbacks in BTC.
• So far, this is the 4th monthly attempt to break through it — still no clean breakout.
RSI: Bearish divergence not obvious here, but clear rejection zone compression = potential energy build-up.
Implication:
• A monthly close > 36.0 BTC/XAU would mark first-ever breakout vs gold, signaling institutional capital may be favoring BTC over gold = massive macro signal.
⸻
💶 BTC vs EUR – 2W Chart
Observations:
• BTC/EUR is pressing into the macro ATH zone (~€104K–€106K), but still hasn’t broken above.
• Multiple rejections at this level since March 2024.
• 2W candles are consolidating tightly under resistance — typical pre-breakout coil if bulls take control.
EMA ribbon still rising steeply = trend support strong.
RSI: No bearish divergence, momentum still above 60 = healthy bullish pressure.
Implication:
• A breakout above ~€106K → confirms Euro ATH breakout, which could front-run or confirm USD ATH breakout.
• Especially powerful if paired with a breakout on the BTC/Gold chart.
⸻
🧠 What This Means for BTC/USDT (Macro Read)
✅ If BTC/EUR closes a 2W or monthly candle above ATH, and BTC/XAU confirms breakout above 36 →
🟢 BTC/USDT will likely follow with ATH breakout and possible parabolic extension.
Think of it as:
• BTC vs fiat (Euro) confirms capital rotation within currency systems.
• BTC vs hard assets (Gold) confirms rotation across store-of-value regimes.
If both flip → USDT-paired BTC becomes the laggard and is next to explode upward.

BTC ToplessWill we just skip 50k in one move or it would take 3-6months xD?
Eitherway, btc is pretty sexy

BTC/EURO did not break out - potentially a big warning sign- follow up on the latest BTC analysis
- this Bitcoin breakout, so far, is rather lackluster and leaves a lot to be desired
- upon breaking an important HTF level, Bitcoin tends to explode and leave sideliners behind but this has not been the case so far
- more importantly, BTC DID NOT break out vs. the euro - something I would consider a red flag
- with 5D volatility extremely low, there is a chance of a long liquidation wipe all the way to 85k before the "real" upsurge happens
- all concerns regarding the validity of this breakout go away the moment BTC makes a higher high above 123 000
Bitcoin: rally to 100k Then drop to high-volume supportBitcoin is setting up for a two-phase move based on current technical structure:
Phase 1 - Rally to 100k (Yellow Line)
Expect initial bounce to test the psychological 100k resistance level
RSI currently at 56.15 provides room for upward movement
This represents a short-term retest of major resistance
Phase 2 - Drop to High-Volume Support Zone
After rejection at 100k, anticipate decline to the high-volume area shown by the blue arrow
This zone represents maximum buyer/seller activity and should provide strong support
RSI would likely reach oversold conditions, creating mean reversion opportunity
Trade Setup:
Entry: Long position at high-volume support zone (arrow end)
Target: Return to current levels or higher
Stop Loss: Below the high-volume support area
Rationale: Volume profile analysis shows this as a key value area where most market participants are active

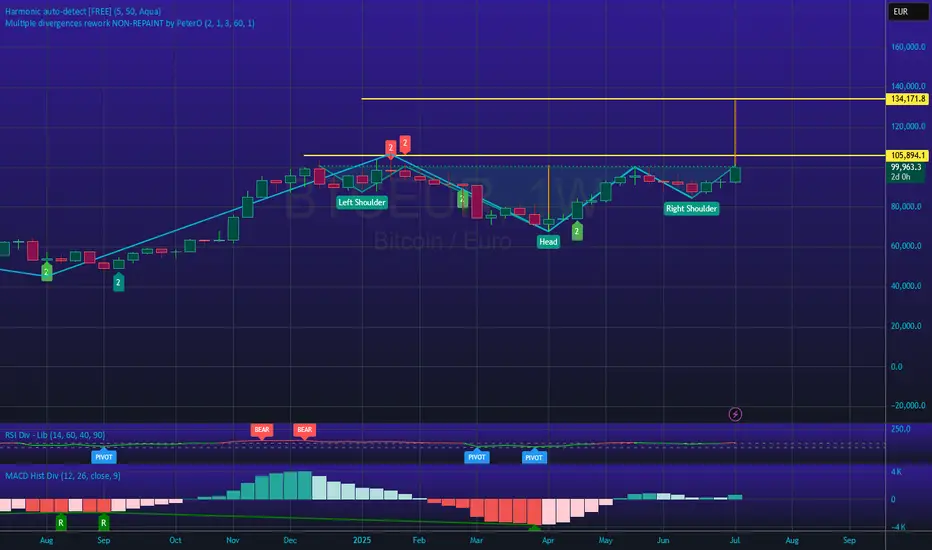
booomwe doing it, inverse head n shoulders breaking ath's it took a few years but it's finally happening
btceur ath not yet reachedbitcoin all time high is not in. If euro will stay strong ATH could be in two months at 112 000€ ~ 130 000 $, then down only bear market for a year

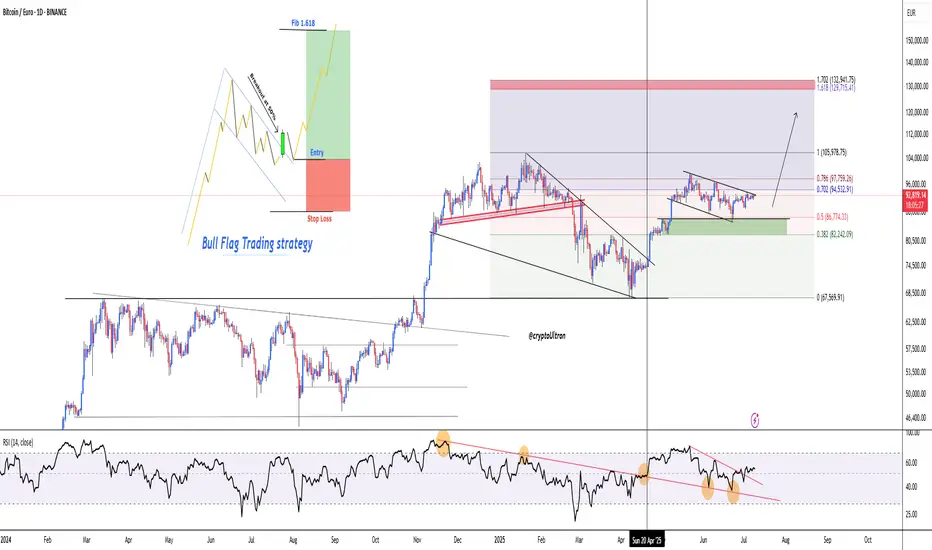
BTCEURO📈 #BTCEUR interesting chart
#BTC has been trading super clean — if you know where to look 👀
The entire first half of 2025 was stealth accumulation, and now we’re stepping into Q3 with a full bull flag structure intact.
This is the calm before expansion.
✅ Bull flag forming after breakout from €67.5K
✅ Strong support zone defended around €86K
✅ RSI broke out of downtrend with hidden bullish divergence
✅ Targets in sight: €105K → €129K–€132K (1.618–1.702 Fib)
We’re still consolidating under key resistance, but the breakout setup is fully intact.
No breakout yet — but when it comes, it could be fast and violent.
Q3 could be massive.
⸻
🔍 Zoomed-Out Breakdown
1. Accumulation Confirmed
• Price has ranged between €82K–€96K all year, forming a macro bull flag
• This follows a strong move from €67.5K → €105K — textbook post-breakout consolidation
2. Bull Flag Structure
• Down-sloping flag with declining volume — classic pattern
• Support held at 0.5–0.618 Fib zone
• RSI bottomed + flipped trend → bullish divergence in play
3. Q3 Timing Makes Sense
• Q1 = rally → Q2 = consolidation → Q3 = expansion?
• Bull cycles often resume in Q3 after long reaccumulations
• Both weekly and 1D structure support this scenario
4. Targets Are Reasonable
• €105K = local top + psychological breakout level
• €129K–€133K = Fib extensions (1.618–1.702) — clean upside targets if breakout confirms
⸻
🧠 But Here’s What Needs to Confirm:
• Daily or 3D close above €96K = breakout confirmation
• RSI must stay above 50 and ideally reclaim 60+
• Volume must spike — no breakout is valid without it
• ⚠️ If price stalls too long below €105K, risk of broader distribution increases