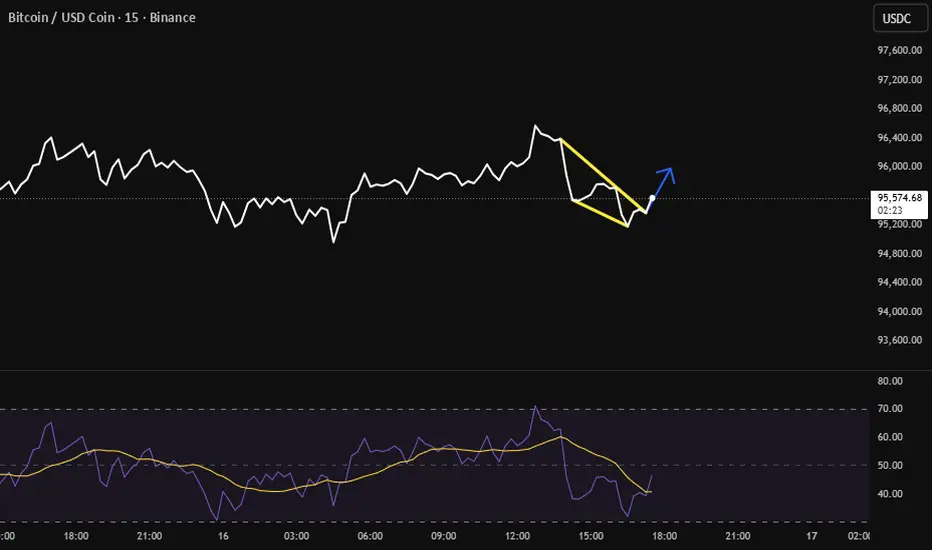
BTC downtrend breakoutThere's a possibility of a breakout from the downtrend that formed from the ATH, it was already tested 3 times. If we accumulate at this level a breakout of this trend is plausible.
Trade ideas

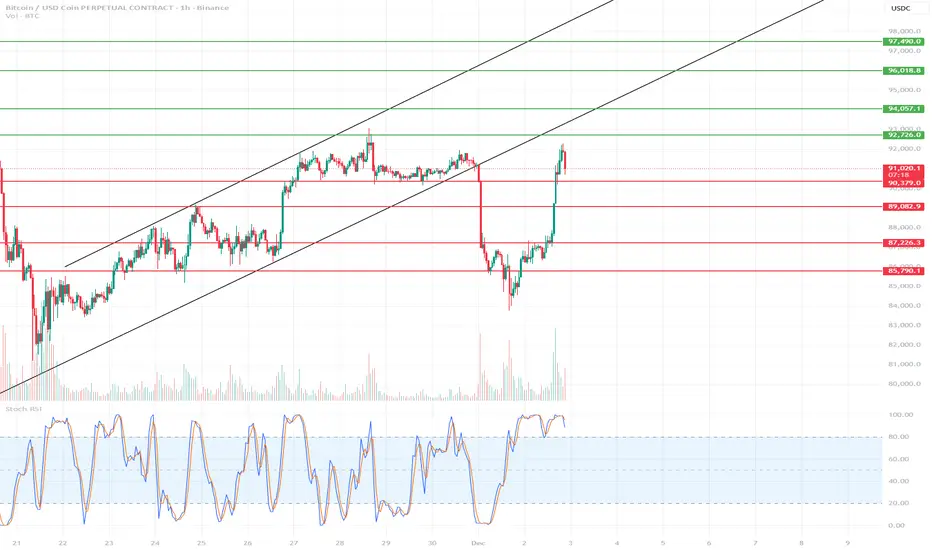
BTC Short-Term Chart 1H🔍 1. Current Market Situation
BTC has made a very strong rebound from around ~87,000 and reached the key resistance zone of 92,700–93,200, where the first signs of a slowdown are currently visible.
The Stoch RSI on the 1-hour timeframe is heavily overbought, which usually suggests a local correction or at least consolidation.
🔴 2. Key Resistance Levels (Short-Term)
92,726 → current resistance; the price has rebounded precisely from this zone.
94,057 → next strong resistance if BTC breaks above 92.7k.
96,018–96,866 → strong supply zone; only after breaking this zone will the uptrend resume in full force.
🟢 3. Major Supports (Short-Term)
90,379 – 90,990 → nearest intraday support zone
89,082 → strong support that halted the previous decline
87,726 → key to the upward structure
85,790 → critical level, a breakout opens the door to a deeper correction
📉 4. Short-Term Baseline Scenario
Most likely in the coming hours:
✔ Scenario A – correction from the current level (preferred)
Stoch RSI overbought
Price rejected from the 92.7k resistance
Large vertical move → market needs to cool down
Correction Targets:
90,900–90,300 → first TP/buy zone
89,100 → deeper correction but still healthy.
Long signal:
Return of h1 candle closes > 91.3k after a pullback.
✔ Scenario B – breakout of 92.7k and continued growth
If BTC breaks and holds above 93,200, upward momentum resumes.
Targets:
94,057
96,000–96,800 (strong supply zone – take profit area)
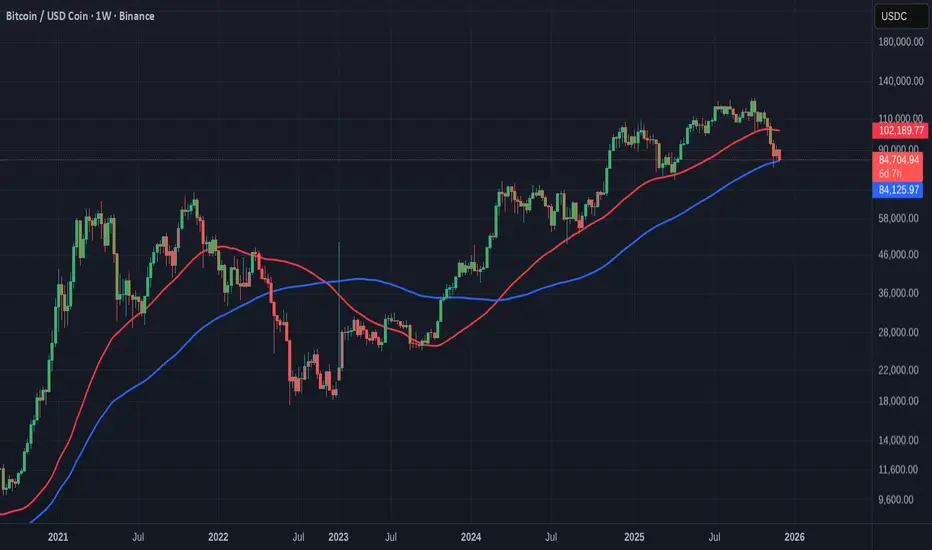
Really Simple Clue to "Is Bitcoin in a BEAR or BULL"
It is as simple as this.
If PA falls below that BLUE 100 WEEK SMA, Bitcoin is in a BEAR
While we remain above it, we have Hope of returning back to a BULL RUN
The RED line is the 50 Week SMA, which was the first warning Shot.......
We will find out this month I hope.........................
Bitcoin Analysis 4H TimeframeOn the 4H chart, price is currently testing a key ascending trendline after several valid touches in previous swings. The recent structure shows weakening bullish momentum, and if this trendline breaks decisively, Bitcoin may enter a deeper corrective phase.
At the moment, two main scenarios are likely:
Scenario 1
A clear breakdown of the trendline leads to a direct continuation of the bearish move toward the major support zone around 84,600. This level has acted as an important demand area in the past and remains the primary downside target.
Scenario 2
Price may first push higher, forming a corrective move or retest toward the broken trendline. If this area confirms as resistance, a rejection from that point could trigger the next leg down, with 84,600 still being the main target for the correction.
As long as price fails to reclaim and hold above the trendline, the overall bias remains bearish and the probability of a move toward 84,600 stays elevated.

Long trade 📘 BTCUSDT.P – Trade Journal Entry
🟦 Trade summary
Pair: BTCUSDT.P
Trade Type: Buyside Trade
Date: Sat 22nd Nov 25
Time: 9:30 pm
Session: Tokyo Session PM
Timeframe: 15 min
🟩 Trade parameters
Entry: 86,169.4
Profit Level: 91,000.0 (+5.60%)
Stop Level: 82,523.8 (–4.02%)
Risk-to-Reward: 5.46 R
🟨 Market context and structure
The market was in a 3-session decline (Tokyo → London → NY), forming an extended liquidity run to the downside. Repeated sell-side sweeps occurred near 85.0–85.6k, creating inducement for a buyside reversal. Descending channel/compression structure developed leading into NY PM. THE NY PM session formed the first bullish displacement after the sweep, confirming the intraday shift.
🟪 Liquidity
Sell-side liquidity was taken below the Asian + London lows.
The final low sweep occurred just before NY PM delivery.
Multiple FVGs (Fair Value Gaps) printed on the bullish expansion up from 85.5k → 86.5k.
A clean FVG retest + orderblock interaction created your entry model.
Liquidity Path:
Model: Sell-side sweep → Displacement → FVG → OB retest → Buyside target (91k)
🟫 Whykoff Aligment
Phase BTC Price Action
Phase B Wide, aggressive markdown with sweeps
Phase C Final sell-side sweep into NY PM
Phase D Rally through structure + LPS retest
Phase E Expansion toward buyside inefficiencies
We assume BTC now reflects a Phase C → D transition into markup.
🟩 Volume and confirmation
NY PM shows volume expansion only on bullish candles. Retracements back into the FVG show volume contraction, confirming programmatic buy-side control.
🟥 Outlook/Continuation
Holding above 86.3–86.5k = continuation probable. Potential upside magnet sits around 92.2–93k premium where macro inefficiencies remain open. Invalidation: Return below 85.6k kills the intraday buyside premise.

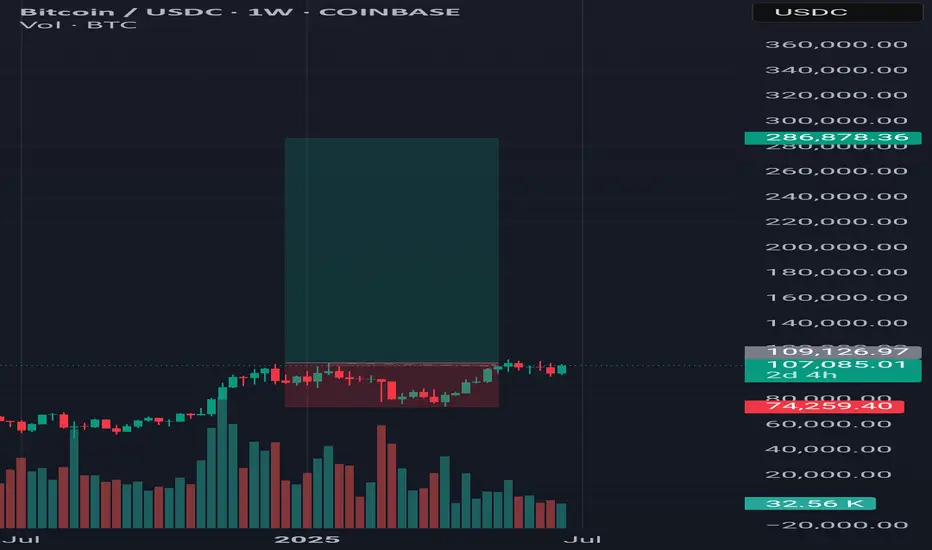
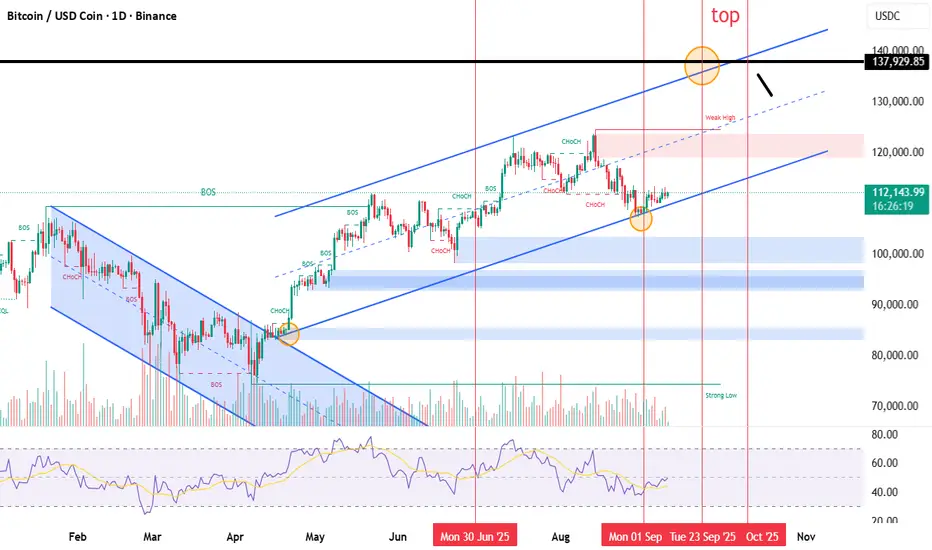
BTC Next weekly targetsMy last TA was on point at the top. However, the initial target isn't met yet. As we broke the weekly trend already, I expect a kind of a pullback to the supply (re-distribution area) and then back down.
Acceptance above the supply area would invalidate the idea. For now, I expect a little relief bounce to that area from here of from lower down before the next level gets revisited.
BTC Neutral Technical Assessment
Price has broken below the long-term rising wedge/rising channel structure. Statistically, a breakdown from this formation often leads to deeper retracements within the previous upward leg. The market is currently sitting around the 50% Fibonacci retracement; a sustained move below this level opens the path toward the 61.8%, 78.6%, and lower support zones.
Market structure continues to show weakening momentum with a sequence of lower highs and lower lows on the higher timeframe. As long as price does not reclaim the previous channel and confirm a new higher high, the technical outlook remains neutral to slightly bearish.
If no bullish reaction appears at the current support area, the next logical targets lie in the deeper retracement zones. This could indicate a mid-cycle correction or potentially the end of the current bullish phase, depending on how price behaves at lower levels.
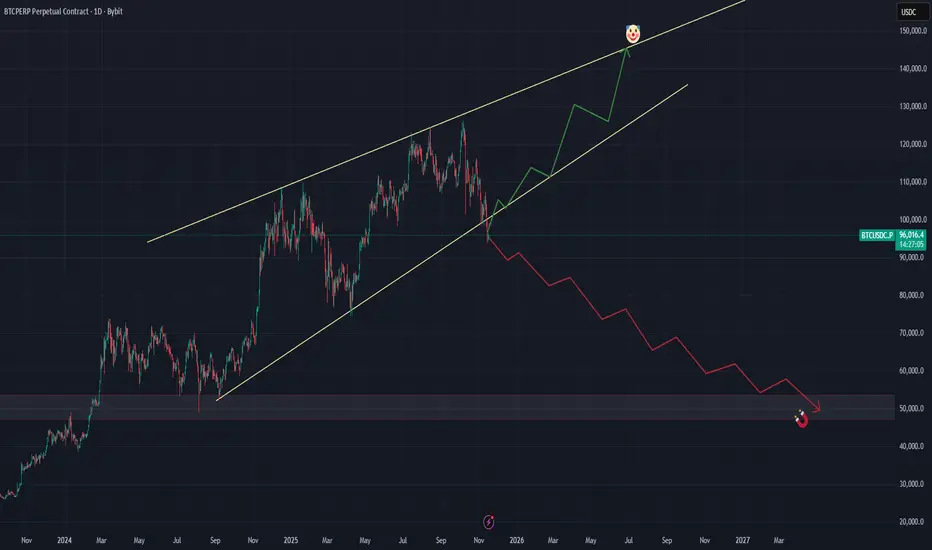
BTC will rebound soonI drew the trend lines, you can see that it's currently in the downtrend following the upper trend line and soon going up. In a Weekly chart it's obvious to see the large ascending range.

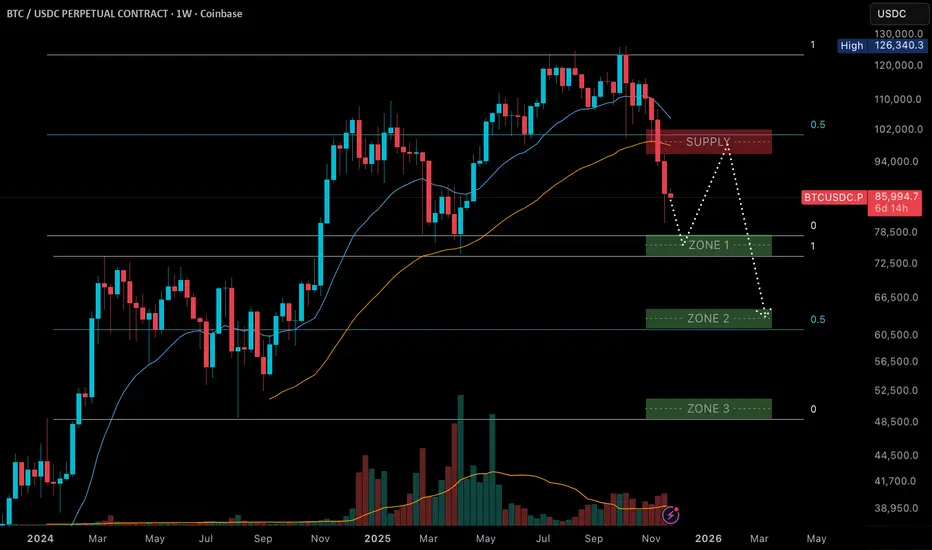
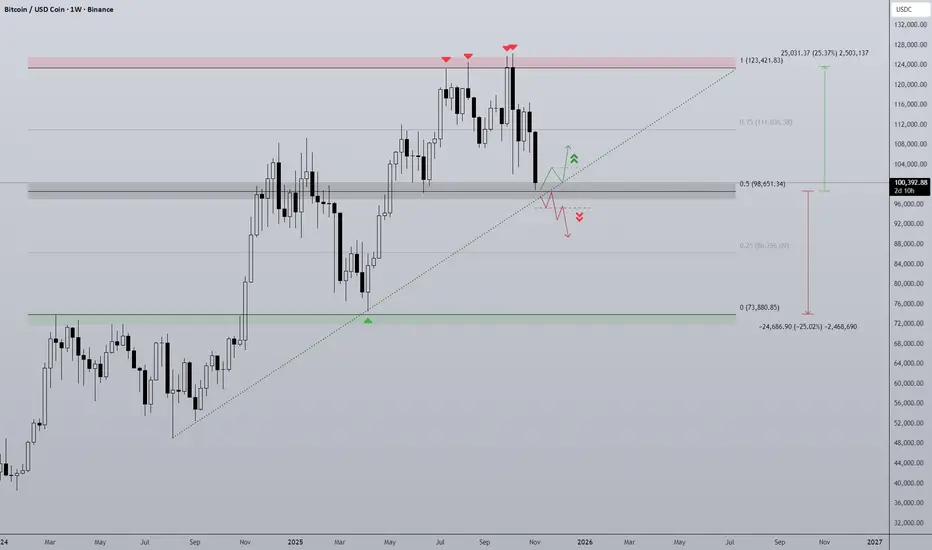
BTC Line In The Sand Bitcoin has had a turbulent Q4 so far and finds itself at ~$100,000 at the start of November.
The chart clearly defines the structure of the move since the beginning of 2024. Once breaking above last cycles ATH of ~$69,000 BTC's price has moved in relatively typical fashion for a bullrun uptrend. The tariff war marking the range low back in April and the highs have been capped at ~$125,000, on 4 separate weeks this area has rejected and remains major resistance.
As of now BTC is retesting the midpoint as support as it did back in June. Where this time is different is the momentum difference, since the first test of range highs the trend has gone into a choppy phase with lower lows being printed. This distribution pattern is vastly different and quite bearish. Another element to this is the diagonal support trendline that intersects the midpoint at roughly current price, losing this trendline would be added confluence that the bullish trend is over.
Should midpoint and diagonal support be lost the bottom half of the range comes into play, a 25% range that would open the door to a full retrace of this cycles progress back to 2021's ATH.
A strong bounce at midpoint keeps the uptrend alive at least in the short term but BTC would need to finally break range high.
Long trade
4Ht TF
📘 Trade Journal Entry
Pair: BTCUSDC.P (Bitcoin Perpetual Mix Contract)
Direction: Buyside Trade
Date: Sat, 18th Oct 2025
Time: 8.00 AM
Session: London to New York Session AM
Timeframe: 4-Hour
🔹 Trade Details
Entry: 107,571.0
Profit Target: 111,494.0 (+7.22%)
Stop Level: 106,095.5 (–0.88%)
Risk-Reward Ratio (RR): 8.4
🔹 Technical Context
Price rebounded from the Fibonacci 0.75 retracement zone, forming a clean swing low around 107,044 before reversal.
Kaufman Adaptive Moving Average (KAMA) starting to turn upward — confirmation of shifting short-term bias.
RSI is recovering strongly from oversold territory (~30) and now trading above 61, supporting bullish momentum.
Structure shift after consecutive higher-lows — potential CHOCH confirmation and accumulation phase breakout.
The previous range deviation and liquidity sweep below the 0.75 fib provide a solid accumulation context.
1Hr Timeframe (Discount range observed)
🔹 Narrative
This buyside setup forms after extended downside liquidity collection beneath the major swing low. The market structure indicates accumulation and early-stage reversal, supported by RSI divergence and EMA/KAMA realignment. A continuation toward the 111–112K zone remains the primary trajectory unless rejection occurs near 109.8K resistance.

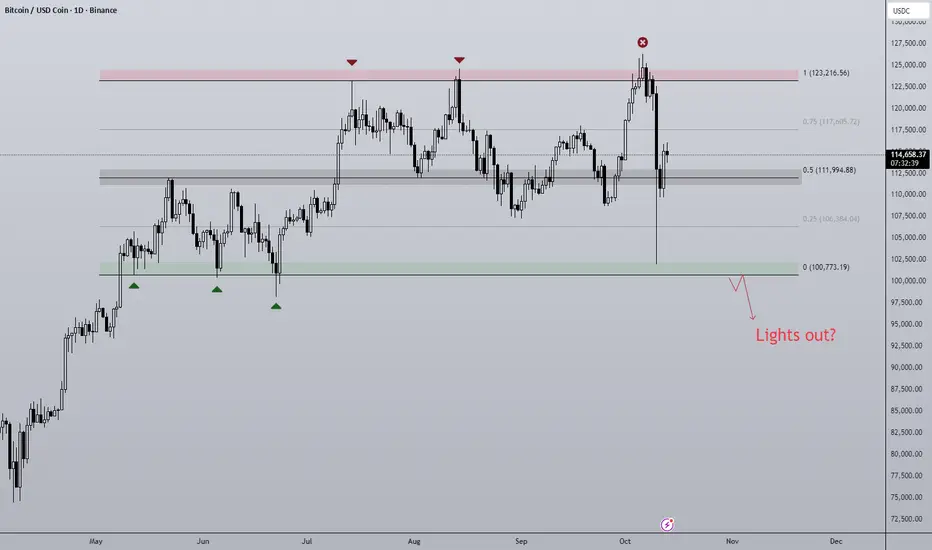
Post Flash-Crash BTC Despite such a large sell-off event, has the outlook on BTC actually changed? Structurally BTC remains very much rangebound with two clearly definable halves of the range. That is until Fridays move off the back of a Tariff Tweet from President Trump causing a liquidation event similar to that of April earlier this year and the Covid crash of 2020.
Bitcoin was less effected when compared to altcoins as is usually the case, some majors dropping as much as 80% in a single 1h candle! An entire bear market in an afternoon. Bitcoin on most exchanges fell roughly 20% on the news and eventually found support at range lows ($100,000), a significant amount of this drop got bought up and so BTC finds itself hovering around range midpoint.
To me this is a no trade zone initially, there is no clear directional bias that is actionable at this time but I am looking for clues as to where price may be going next:
- Should BTC stay above midpoint the next clear resistance level is 0.75 ($117,605). On the lower time frames the trend is bearish, 0.75 would be a good place for the bears to defend.
- A loss of the midpoint would open the door to backfilling the wick, this could get ugly as on the higher time frames a new lower low and price acceptance lower would signal a bearish shift in structure. Calls for "the top is in" will get much louder and so will the 4 year cycle theory comparisons.
- A V-shaped recovery and move straight to the highs would be max pain after such a brutal move down. Although IMO it's the least likely I would not rule it out.
Is the Bitcoin market bearish?📊 Bitcoin Market Psychology Analysis
Market psychology analysis is one of the most fascinating and practical approaches to understanding Bitcoin's current position! 🎯
🎭 Market Psychology Cycle Phases:
1. Hope Phase 🟦
Likely the current point for many assets
· 📈 Description: After a panic-driven crash, the market stabilizes and consolidates within a relatively stable range
· 💰 Price hasn't returned to previous lows and shows occasional small positive breakouts
· 😌 Sentiment: Fatigue from the downturn, but quiet hope for gradual improvement
· 👴 Experienced investors accumulate while newcomers remain cautious
· 📊 Indicator: Moderate trading volume typically
2. Optimism & Belief Phase 🟩
· 🚀 Description: Price begins breaking key resistance levels
· 📰 Media gradually starts paying attention again
· 😨 Sentiment: FOMO (Fear Of Missing Out) among experienced investors
· 😞 Regret over selling at the bottom
· 📈 Indicator: Beginning of increasing trading volume
3. Greed & Euphoria Phase 🟨
· 📈 Description: Full-blown bullish phase - price rises consistently and rapidly
· 🗞️ Positive news dominates everywhere
· 👥 Friends and acquaintances talk about massive profits
· 💭 Sentiment: Belief that "this time it's different" and "price only goes up"
· 💸 Greed for more profits and borrowing to buy
· 📊 Indicator: Very high trading volume and positive media coverage
4. Denial Phase 🟧 - Danger Point!
· 📉 Description: Price falls from the peak
· 🤦 Many investors consider this just a "temporary correction"
· 🔮 Expect a return to the peak
· ❌ Sentiment: Strong denial
· 🛒 Buying during the decline hoping for recovery
· 📊 Indicator: Trading volume remains high
5. Fear, Panic & Capitulation Phase 🟥
· 🚨 Description: Sharp and rapid decline
· 📉 Price experiences consecutive breakdowns
· 😱 Sentiment: Intense fear, panic selling
· 💔 Acceptance of heavy losses - absolute despair
· 📊 Indicator: Very high selling volume
6. Apathy & Depression Phase ⬜
· 😴 Description: Market remains stagnant with low volatility for extended periods
· 💤 Prices are low and boring
· 🚫 Sentiment: Complete disinterest in the market
· 👋 Most people have accepted defeat and exited the market
· ☠️ Talk of "Bitcoin's death" resurfaces
· 📊 Indicator: Very low trading volume and minimal media attention
---
💡 Golden Insight:
Understanding these phases can help you make the best trading decisions! ✨
---
📌 Market Psychology + Technical Analysis = Trading Success 🚀
---
💬 Let's Interact!
I'd love to hear your thoughts! 👇
· 🤔 Which phase do you think we're currently in?
· 📊 What's your market outlook for the coming months?
· 💭 Share your technical analysis perspective
· 🎯 Have you used market psychology in your trading strategy?
· 📉 What indicators do you find most reliable?
· 💡 Any successful trades based on market sentiment?
· 🔮 Where do you see Bitcoin in the next 6 months?
Let's learn from each other! Share your comments and analysis below 👇
Your experience and insights are valuable - let's build our trading knowledge together! 🌟
Feel free to ask any questions or share your trading experiences! 💪

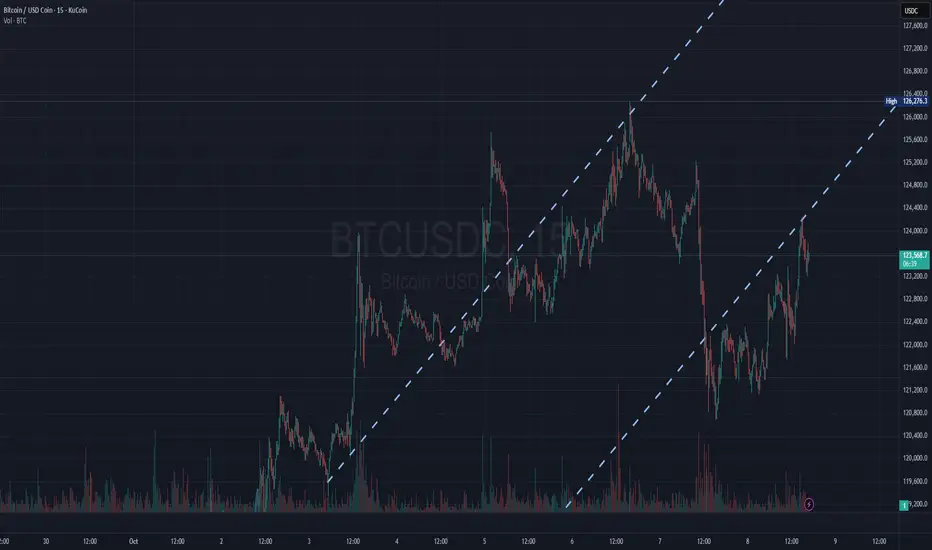
We are looking to go higher stillBitcoin is climbing a clean rising channel 📈 — higher highs and higher lows forming a short-term bullish structure. Watch for a breakout above 126K or a breakdown below 122K to confirm the next move. #BTC #CryptoTrading #TrendChannel
Breakdown:
The lower dashed line marks support, where buyers have repeatedly stepped in.
The upper dashed line marks resistance, where the price has pulled back each time it reached that boundary.
The volume shows spikes on upward moves, confirming buying interest within this range.
If BTC holds above the mid-channel zone (~123K–124K), it is likely to continue toward the upper boundary (~126K).
A close below the lower line (~121K) would signal potential short-term weakness and channel breakdown.
Long trade
Trade Journal Entry
Pair/Asset: BTCUSDC (Bitcoin / USDC, Perp)
Trade Type: Buyside trade
Date: Monday, 29th Sept 2025
Session: Tokyo Session AM (4:00 AM)
Trade Details
Entry: 112,051.5
Profit Level (TP): 115,828.0 (+3.41%)
Stop Level (SL): 111,561.0 (-0.97%)
Risk–Reward (RR): 8.42
Technical Narrative
Structure & Context:
BTC was in a clear downtrend but found demand at ~111,000–112,000.
A consolidation phase formed before a sharp, impulsive move upward (accumulation confirmed).
Multiple FVGs (fair value gaps) printed on the way up, acting as support levels.
Entry Justification:
Long taken on breakout above consolidation and demand validation.
Entry at 112,051.5, just above liquidity sweep low.
Confluence: bullish displacement + FVG alignment + demand retest.
Target Rationale:
TP aimed at 115,828, near the previous structural high / liquidity pocket.
Price path shows strong imbalance magnets above (113.2K → 115.7K)
Scaling partials around 114.6K–115.0K is recommended before final TP.
Risk Management:
SL set at 111,561, just under the structural low, keeping tight invalidation.


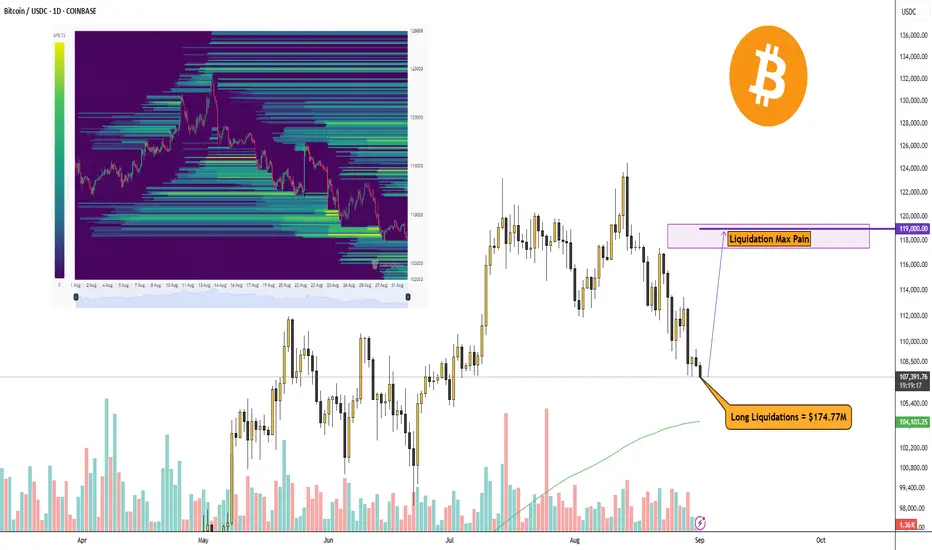
Bitcoin up or down?Bitcoin has corrected a bit more, and it looks like the main liquidations of long traders are done.
Right now, there’s a huge volume of Liquidation Max Pain at the $119,000 level, give or take. It’s the perfect time to buy Bitcoin.
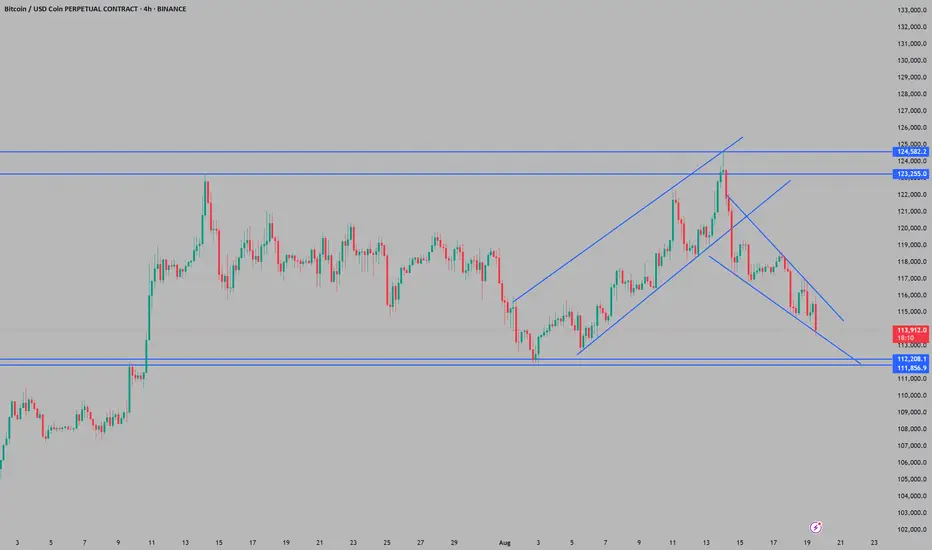
Bitcoin underperforms during unsettled conflictsSupport and Resistance Levels:
Major support appears to be around 111k–112k, which has held previously after a strong upward move.
Resistance levels marked at 123k and 124k indicate prior highs and significant selling pressure.
Price Action & Structure:
The price recently had formed an ascending channel, which was broken to the downside, suggesting the bullish momentum has faded.
Currently, price is inside a descending channel, moving lower after the recent drop from the highs. This typically indicates continued bearish pressure in the short term.
Trend:
With the breakdown of the ascending channel and price forming lower highs and lower lows, the short-term trend is bearish.
The price is approaching the major support zone (near 112,000). If this holds, a bounce is possible; if it breaks, further downside could occur.
Outlook:
Bearish bias short-term: Price is trending downward inside the channel.
Key zones to watch: The 111k–112k area for support. Bulls need to defend this level; failure likely leads to deeper corrections.
If the price recovers and breaks above the descending channel, it would be the first sign of potential reversal or consolidation.
Summary
Right now, Bitcoin’s 4H chart suggests weakness, with sellers in control short-term. Watch for reactions at the 111-112k zone—this will likely decide the next directional move. Bulls have to defend this area, or further decline is likely. Bulls should wait for signs of strength or a channel breakout before re-entering aggressively.
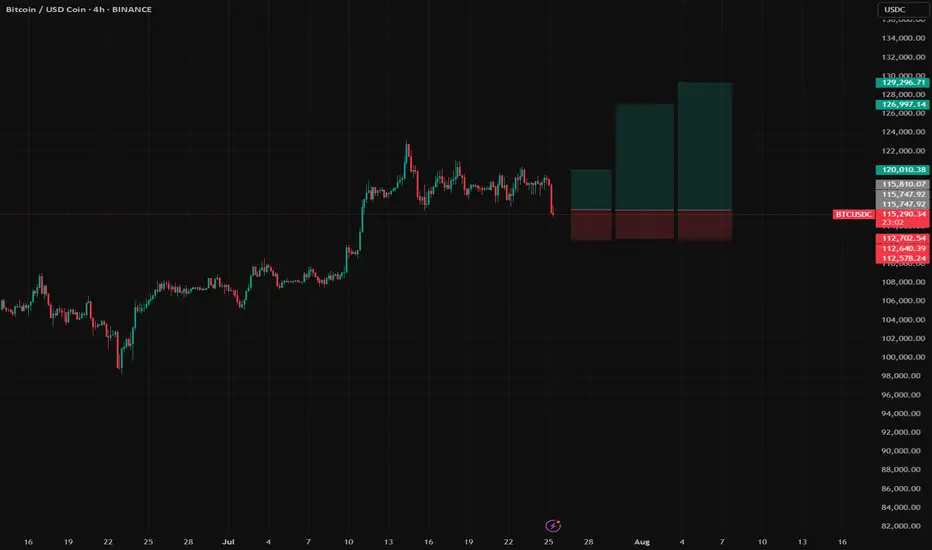
BTC Long Setup | Multi-target Swing Trade with Reasonable SL📝 Description:
Buy Bitcoin (BTC) based on continuation correction structure.
Entry: 115,800
Stop-Loss: 112,600
Risk: 1% per trade (position size adjusted accordingly, no leverage used trade spot only!)
🎯 Take-Profit Levels:
*Watch for a strong red candle at each TP zone.
If it happen, take full profit.
If not, let the position run and watch it again at the next target.
TP1: 120,000
TP2: 126,990
TP3: 129,296
RRR (Risk-Reward Ratio) across targets:
• TP1 = 1:1.3
• TP2 = 1:3.69
• TP3 = 1:4.36
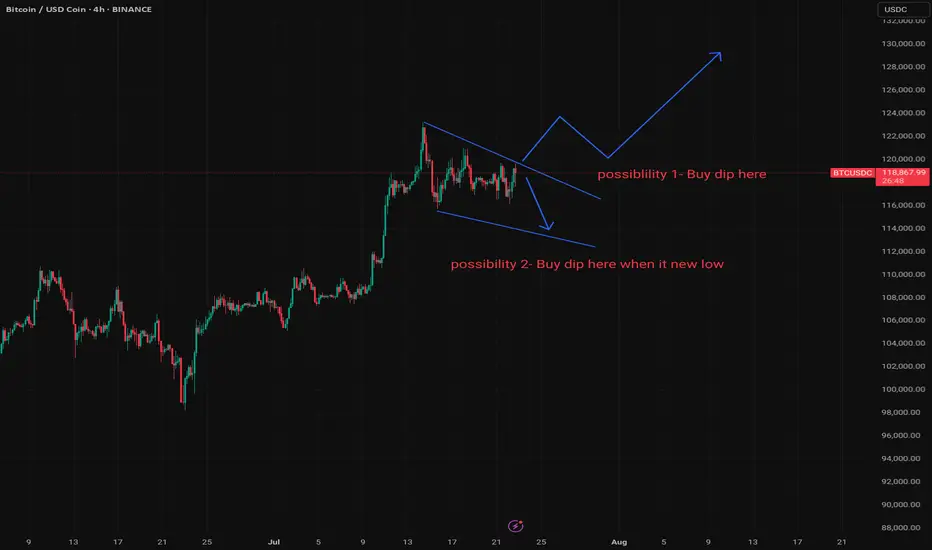
BTC Decision Point – Trade the Plan.BTCUSDC Outlook – Standby Mode Until Confirmation
BTC is currently forming a wedge on the 4H timeframe, typically a bullish continuation structure. However, now is NOT the time to enter. Patience is key — wait for price confirmation.
📌 First Plan (Possibility 1):
If price clearly breaks out to the upside, wait for a pullback
Drop to the 1H or 15min chart
Plan a long entry after price pulls back and forms a supportive structure and Stoploss below that pull back structure a little bit.
📌 Second Plan (Possibility 2):
If price breaks below the support line and forms a new low, do NOT panic sell
Switch to the 15min timeframe — it will likely appear as a downtrend. Wait for the first bullish impulse that may signal a potential reversal.
Enter only after price action confirms a shift from bearish to bullish trend (with green impulse) and Stoploss below that green impulse a little bit.
⛔ Conclusion: This is not an entry zone yet. Wait for clarity and confirmation from lower timeframes before taking action.
Long trade
15min TF
BTCUSD Perpetual – 15-Minute Chart Analysis
Key Trades Highlighted
Trade #1:
Type: Buyside trade
Entry: 114,171.5
Profit Level: 118,677.0 (+3.97%)
Stop Level: 113,635.5 (–0.47%)
Risk/Reward: 8.63
Entry Time: Thu 10th July 25, 5:15 pm (NY Session PM)
Target Reached: Fri 11th July 25, 5:30 pm
Trade Duration: ~24 hrs 15 min
Trade #2:
Type: Buyside trade
Entry: 116,411.5
Profit Level: 121,406.0 (+4.29%)
Stop Level: 115,751.0 (–0.57%)
Risk/Reward: 7.56
Entry Time: Tue 15th July 25, 11:30 am (NY Session AM)
Chart Structure & Technicals
Trend: Strong bullish impulse, minor retracement, continuation attempt.
Moving Averages:
EMA (blue): 117,873.4 (dynamic support/resistance)
WMA (yellow): 117,858.0 (price riding above, confirming bullish momentum)
Key Levels:
Resistance: 121,406 – 121,390 zone (Profit Target)
Support: 116,416 – 116,411 zone (entry confluence for current trade), 115,751 (stop)
Major Swing Low: 113,635 (protective stop on previous trade)
Volume/Orderflow Insights
Impulse up from below 114k, pausing at 121k resistance.
Volume is considered likely to increase at key support zones (116,400–116,000) and around target/profit-taking regions.
Actionable Trade Ideas
If Long:
Stay in: As long as price holds above the 116,411–116,416 support, with stops below 115,751.
Targets: 121,406 (major), consider partials at prior swing highs or if momentum stalls.
If Not In:
Re-entry Zone: Watch for bullish reaction at 116,416–116,000; enter on confirmation (engulfing, break of LTF structure).
Invalidation: Clean 15-min close below 115,751, or signs of heavy sell pressure.
If Short Bias:
Wait for a break and retest below 115,751 for a possible short to 114,700, but primary bias remains bullish above this zone.
Summary Table
Trade Direction Entry Stop Target R: R Duration Status
#1 Long 114,171.5 113,635.5 118,677.0 8.63 24h 15m Closed TP
#2 Long 116,411.5 115,751.0 121,406.0 7.56 In Progress Active trade
Outlook
Maintain bullish bias as long as 116,400 holds.
Look for trend continuation toward 121k+ on breakout.
Monitor for reversal signals if price fails to reclaim/hold above WMA or EMA.

Btc have big long chanceI want to get an optimistic scenario from Bitcoin, which can increase up to five times as far as the history of Hawings.
🇮🇷Long Live Iran🇮🇷