2025 BITCOIN TARGETS: Reality Check
Forecasting is easy. Being right is hard.
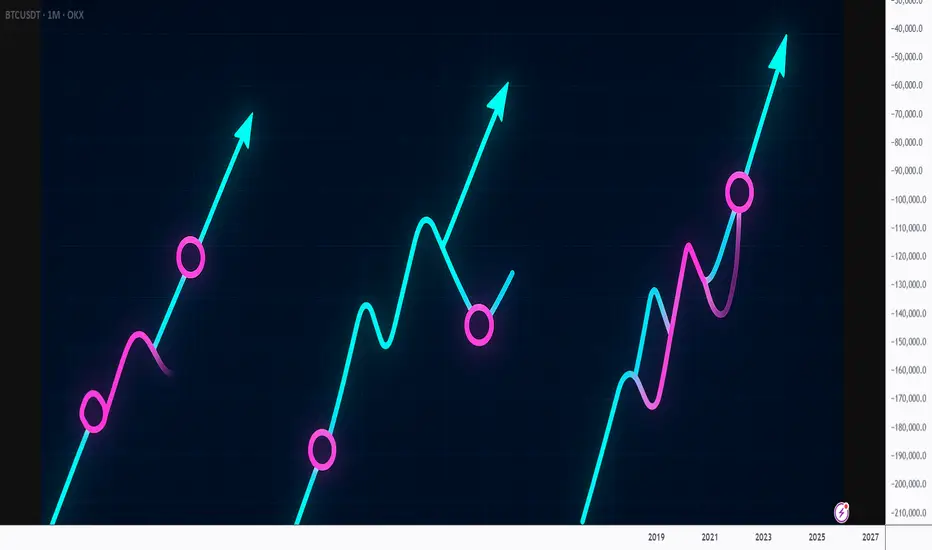
1. When Targets Turn Into Illusions
Look at this chart.
Bitcoin at $90,000. Sixteen days left in 2025.
And every “expert” target — JPMorgan, VanEck, Standard Chartered, Tom Lee, Kiyosaki, BlackRock, Cathie Wood —
all of them missed. Every single one.
Why?
Because it’s almost impossible to stay objective when you own the asset you’re predicting.
When you hold a position, your mind paints infinity.
You stop seeing the market — you start seeing your hopes.
You stop analyzing — you start believing.
These price targets were never forecasts.
They were wishful thinking, dressed up as analysis.
2. My Position — Stay Sane
In my posts, I always try to remain objective and grounded.
I don’t trade emotions.
I observe, analyze, and share what I actually see — not what I want to see.
And here’s what I see now:
Those bullish targets might still be achieved one day —
but not by the end of 2025.
Not even by the end of 2026.
According to my cycle analysis, the next real bull market peak will come around 2029.
And even then, it’s hard to name a precise number.
But if history repeats — and each new cycle doubles the previous one —
then levels like $250k, $275k, or even $300k are possible.
Still, even those words must be questioned.
Because the market has one constant lesson — humility.
And those who sound most confident are usually the first to be wrong.
3. Why Bitcoin Will Keep Growing Anyway
Despite all the chaos and uncertainty, one thing remains clear:
Bitcoin will keep growing in the long run.
The reasons are structural, not emotional:
mining difficulty keeps rising,
competition among miners is increasing,
the industry is expanding,
institutional interest is growing,
the circulating supply is shrinking,
the market is becoming more concentrated, leveraged, and volatile.
We’re witnessing moves that a few years ago were unimaginable.
A $20,000 daily swing is no longer shocking — it’s the new normal.
Just look back at October 11th — Bitcoin dropped $20,000 in a single day.
That’s a record.
And it will be broken again.
Because the game keeps escalating.
Bitcoin won’t die.
Unlike thousands of altcoins that fade into oblivion,
Bitcoin has too many players, too much capital, too much gravity to disappear.
4. Where We Are Now
Let’s be honest —
we’re not even halfway through this bear market.
Not even close.
Maybe 20% of the way.
The real pain is still ahead — disappointment, capitulation, and exhaustion.
And not only among retail traders.
Funds, miners, corporations — all of them will face it.
Every cycle demands maximum rejection.
It needs the crowd to give up.
That’s how markets reset.
Bear markets are not crashes — they’re slow, grinding declines that strip away hope.
They don’t destroy capital first — they destroy conviction.
5. The Bicycle Metaphor
If you plan to stay in this market the whole way down,
I’ll compare you to a man riding a bicycle downhill.
He tells himself:
“Yes, I’m going down, but I’ll keep pedaling.
When others quit, I’ll be ahead.”
But the truth is —
when he reaches the bottom,
and the next uphill begins,
he’ll have no strength left to climb.
He’ll be burned out — mentally, financially, emotionally.
He won’t make it up the next mountain.
6. What’s Happening Now
Right now, we’re in a correction phase.
The impulse move is over.
The small bounces you see — they’re not a reversal,
just temporary relief before the next leg down.
This is not the start of a new bull market — it’s a pause between declines.
The macro setup doesn’t support growth yet.
The structure isn’t there.
The market simply isn’t ready.
Every cycle gets heavier.
Each one demands more pain, more time, more cleansing.
7. The Bottom Line
I have no illusions.
No fantasies about instant rallies to $300k.
Only realism and patience.
The market will sort itself out.
But by the time the next real bull run begins,
most of those who are still “pedaling downhill” now
won’t have the energy — or the faith — to climb again.
Best regards, EXCAVO
Market insights

Bitcoin - Bear flag, 74k confirmed! (warning, must see)Bitcoin has just completed its bearish flag formation. What now? The probability of going down is now around 70%, while the probability of going up is only 30%. Many times we see a bullish breakout of a bear flag. How does it look? Something like that:
We see that for a bullish breakout, the bulls need to completely go above the flag's resistance, which is much harder than simply going down, especially in a strong bear market, like in this Bitcoin's case.
Bitcoin's price and development are completely controlled by the banks and huge institutions that control this planet. To make money, you have to identify their actions on the chart.
On the chart we can also see a completely unfilled FVG (Fair Value GAP). Precisely between 90600 and 92060. There is a possibility for Bitcoin to partially or completely fill this GAP before starting the upcoming drop! Longs are riskier at this point, because we want to trade with the bearish trend. But if the price increases in the short term, we can have a much better entry point for our short position on futures. It's also a possibility to retest the long-term blue trendline from the all-time high.
From the Elliott Wave point of view, this bear flag seems to be a complex corrective pattern. To be honest, I don't see any signs of strength, such as an impulse wave or a leading diagonal wedge pattern. I am currently bearish on Bitcoin, and I expect a pretty significant drop in the coming weeks! Especially January is statistically an extremely weak month for Bitcoin.
Write a comment with your altcoin + hit the like button, and I will make an analysis for you in response. Trading is not hard if you have a good coach! This is not a trade setup, as there is no stop-loss or profit target. I share my trades privately. Thank you, and I wish you successful trades!

BTC/USDT - Major Rejection from Supply Zone📝 Description 🔹 Setup Overview WHITEBIT:BTCUSDT
BTC/USDT has faced a strong rejection from the upper resistance / supply zone near the recent highs. Price has broken below the rising trendline, signaling a shift in short-term market structure from bullish to bearish. Failure to reclaim the trendline keeps sellers in control.
📌 Trading Plan📉 Bearish Scenario (Primary Bias )
Sell Zone: Below the broken trendline & previous support
Target 1: 89,030 (1st Support)
Target 2: 87,520 (2nd Support – liquidity area)
Confirmation: Weak bullish candles + rejection from trendline retest
#BTCUSDT #BitcoinAnalysis #CryptoTrading #BTC #PriceAction #TechnicalAnalysis #CryptoMarket #TrendlineBreak #TradingView #Kabhi_TA_Trading #SellBTC
⚠️ Disclaimer
This analysis is for educational purposes only.
Crypto markets are highly volatile — always manage risk and use stop-losses.
👍 Support the Analysis❤️ LIKE if this helped💬 COMMENT your BTC view
🔁 SHARE with fellow traders
Your support keeps the analysis coming! 🙏

Bitcoin - Sell this upcoming pump! New Bear Flag - Target 74k!I am currently bullish on Bitcoin in the short term, and I believe Bitcoin will hit 96k, probably this week. The current price is around 91k, so this is definitely a good opportunity to sell or open a short position at 96k on futures because later this month/in January Bitcoin will most likely continue in a downtrend and hit 74k!
74k (74,508) is a significant swing low from April 2024. There is no doubt that a lot of retail traders have their stop losses placed exactly below this swing low. This acts like a strong magnet for huge institutions, hedge funds, and big banks (market makers). It's no longer a secret that Bitcoin's development and Bitcoin's price are completely controlled by these lizards. But let's take a look at the short-term prediction.
What we can see on the daily chart or on the 12h chart is a bear flag formation. This bear flag is so nice and almost textbook perfect! Inside the bear flag we have a WXY corrective pattern (3x ABC or 3x WXY). I think that this is a strong indication that the downtrend we see from the all-time high (126k) will likely continue in the next weeks.
Write a comment with your altcoin + hit the like button, and I will make an analysis for you in response. Trading is not hard if you have a good coach! This is not a trade setup, as there is no stop-loss or profit target. I share my trades privately. Thank you, and I wish you successful trades!

Why Most Traders Misread Trends!!! (Fix It in 10 Seconds)Every trader talks about trends.
Few actually understand how to read them.
Most traders think a trend is defined by:
- a diagonal line
- a moving average
- or a breakout
But the truth is much simpler... and far more powerful:
A trend is defined by the quality of its pullbacks.
📚Here’s the 10-second method professionals use:
1️⃣ Shallow Pullbacks = Strong Trend
When pullbacks barely retrace and reverse quickly,
it means one side is overwhelming the other.
Momentum is healthy.
Continuation is likely.
A shallow pullback tells you:
➡️ “Don’t fade this. Follow it.”
2️⃣ Deep Pullbacks = Weakening Trend
When price retraces deep into the previous leg,
momentum is slowing and imbalance is shrinking.
Buyers are less aggressive.
Sellers are gaining confidence.
A deep pullback tells you:
➡️ “Trend still alive, but the engine is cooling.”
3️⃣ Chaotic Pullbacks = Trend Is Dying
If pullbacks become wide, choppy, overlapping, messy,
the trend is no longer in control.
It’s not a trend anymore.
It’s a negotiation.
A chaotic pullback tells you:
➡️ “Stop trading the trend. Wait for structure.”
📚Final Thought
The market isn’t random ... it’s rhythmic.
And pullbacks are the rhythm.
Once you learn to read that rhythm, you’ll stop fighting trends…
and start flowing with them.
⚠️ Disclaimer: This is not financial advice. Always do your own research and manage risk properly.
📚 Stick to your trading plan regarding entries, risk, and management.
Good luck! 🍀
All Strategies Are Good; If Managed Properly!
~Richard Nasr
Bitcoin - Can the ascending triangle be broken?Introduction
Bitcoin is currently consolidating within a well-defined structure after weeks of volatile movement. Despite several failed attempts to break higher, the market continues to compress just beneath a major resistance zone. This type of tightening price action often signals a larger move approaching, as liquidity begins to build on both sides of the range. The chart highlights two key elements that will likely determine BTC’s next direction: the ascending triangle formation and the liquidity level resting below current price. Understanding how price reacts to these areas will be essential for anticipating the next significant impulse.
Ascending Triangle
BTC is forming an ascending triangle pattern, characterized by rising lows meeting a relatively horizontal zone of resistance. This resistance band, highlighted on the chart, has repeatedly capped upward attempts. Each time BTC pushes into the zone, it is met with selling pressure, but the higher lows reveal that buyers are steadily gaining ground. This pattern typically suggests accumulation and a potential bullish breakout once enough pressure builds.
If BTC can break above the upper boundary of this triangle with strength and volume, the move would likely target higher liquidity pools above recent highs. Such a breakout often leads to an impulsive leg upward, as trapped short positions are forced to cover and momentum buyers join in. For now, the ascending trendline remains a key structural support that defines the bullish side of this pattern.
Liquidity Level
Below the current range lies a clear liquidity zone, created by a cluster of equal lows and untested downside levels. This area is marked on the chart and represents where stop-loss orders and resting liquidity are likely positioned. Markets often revisit such zones before making a decisive breakout, particularly in triangle structures where liquidity builds on both sides.
A sweep of this liquidity, combined with a tap into the ascending trendline, would be a textbook setup for buyers to step back in. If BTC dips into this zone and rebounds strongly, it would further strengthen the market structure and increase the likelihood that the eventual breakout takes place to the upside. However, if this liquidity level fails and price breaks below the trendline, the bullish structure would be invalidated, opening the door for a deeper move down.
Final Thoughts
BTC is approaching a decision point, with price tightening inside an ascending triangle while liquidity pools gather below. As long as the ascending trendline continues to act as support, the market maintains a bullish bias, and a breakout above the resistance zone becomes increasingly likely. Still, a liquidity sweep to the downside before any major rally remains a strong possibility. Traders should pay close attention to how BTC reacts if it dips into the liquidity zone, as this response will reveal whether buyers are prepared to defend the structure. A clean breakout above the resistance band would confirm the next bullish leg, while a breakdown below the ascending trendline would signal weakness and shift the outlook.

Trading Plan - What should be included and how to improve it. I have been failing same like many traders are failing these days for same reason. Not having a plan and clearly defined when to trade , when not to trade and didn't have set barriers when to stop. Always wanted to make more. Yes it sounds boring and restrictive. But you will either lean on plan or on impulses.
Everything start with visualization of how your trade setup should looks like. You should know what exactly you are looking for and describe it as much as possible for example:
🧩 Basic Concept
Im looking for the fake break out of the range. Whether we call it manipulation or Stop hunt. It really doesn't matter. The idea is that once big candle is created it creates fomo and break out traders are entering continuation. I trade against them.
📍 Bullish continuation setups
Model 1 - Entry after manipulation - 50% target
Model 2 - Entry on pullback on level between 61.8 - 80% 📍 Bearish Continuation setups
Model 1 - Entry after manipulation - 50% target
Model 2 - Entry on pullback on level between 61.8 - 80% pullback This is your strategy, your pattern you are looking for in the specific situations and market conditions.
📍 Trading plan
is how, when and where , you are going to execute it. It's also good to describe your step by step process, so you remind it to yourself. I suggest to read it before every trading session. Especially beginners or if you adopted a new strategy. Describe every trade element as much as possible. With experiences you will be improving and shaping it. It has to be as simple as possible. 📍 Trading Pairs - If you are day trader / Intra week trader focus on 8 pairs maximum, You dont need more - DXY, EUR, GBP, CHF, BTC, ETH, SOL, XAU
📍 Market Bias - Describe how you analyze your Bias - Trend
Do you have HTF Trend / Liquidity ?
Internal LQ - Discount / Premium
External LQ - Significant HL taken
Monday, Friday, Weekly CLS Range
Key Level ? - If NO - NO trade
Liquidity Sweep + SMT
CIOD - Close - Model 1- 50% TP
📍 Down Trend - Trade Stop hunts above the highs
📍Up Trend - Trade Stop Hunt below the lows 📍 TF Alignment CLS Range + Entry - Structure of my Top Down analysis
Weekly / Daily Range - CLS Range
H4 / H1 / M30 / M15 - Entries
Don't overcomplicate it this works 📍 Setup Qualifications - If one of criteria is not met = No trade
High volatility Stop hunt
Stop run out of CLS range - 0.15%
Rejection from Key Level
CIOD on the LTF Model 1
Correct times - NY, LO , PM Sessions
📍 Entry Model 1
CIOD - the next candle below / above open
if the engulfing candle is too big, wait for a pullback
If range is too big take TP at 50%
Look for correlated pairs
If within HTF trend, target full range.
📍Bullish Scenario LTF Change in order flow is important aspect of the trade if you dont wait patiently for the candle close on the right timeframe, setup is invalid. 📍Bearish Scenario
as you can see price action never looks completely same you need to practice your eyes to see it, profiles, levels and what is happening on the edge of the range. Another and not less important part is knowing when not to trade. Also Im not perfect and even I have quite good plan sometimes I dont follow so reminding these mistakes and reading them in my trading plan is great way to eliminating them next time.
🧪 Low Probability Conditions
Day and Day before NPF, FOMC or CPI
Last and First day of a New Month
Dont buy or sell in the direction of overextended markets
An HTF objective has been met
Price tripped between two Key Levels
🧪 Don't trade IF
- Equal highs / Lows around your SL
- If stop run is to shallow
- Candle didn't closed yet
- If you didn't catch the initial move - don't fomo
- No room for at least 2RR
🧪 Recent Mistakes
- Trading within wrong market conditions
- Entering before CIOD confirmed
- Shallow manipulations
- Now waiting for the PWL / PDL Work on constant improvement, not by adding indicators or by looking for new strategy, commit to the one and master it . 1 Kick - 10 000 times
⁉️ This is questions Im asking myself when going thru past trades. It will help you improve as a trader and shape your trading plan.
- Was there a type of trade that did/didn’t work well?
- Was there a particular market that I did/didn’t trade well?
- Was there a particular day/time that I did/didn’t trade well?
- Did I enter trades too soon?
- Did I enter trades too late?
- Did I take profits too soon?
- Did I take profits too late?
- Did I put my stops loss too tight?
- Did I use an unnecessarily big stop loss?
- Did I take take any trades with poor Risk:Reward ratio?
- Did I risk too much?
- Did I risk too little?
- Did I deviate from my trading model?
- Did I deviate from my plan?
I promised myself I’d become the person I once needed the most as a beginner. Below are links to a powerful lessons I shared on Tradingview. Hope it can help you avoid years of trial and error I went thru.
📊 Sharpen your trading Strategy
⚙️ 100% Mechanical System - Complete Strategy
🔁 Daily Bias – Continuation
🔄 Daily Bias – Reversal
🧱 Key Level – Order Block
📉 How to Buy Lows and Sell Highs
🎯 Dealing Range – Enter on pullbacks
💧 Liquidity – Basics to understand
🕒 Timeframe Alignments
🚫 Market Narratives – Avoid traps
🐢 Turtle Soup Master – High reward method
🧘 How to stop overcomplicating trading
🕰️ Day Trading Cheat Code – Sessions
🇬🇧 London Session Trading
🔍 SMT Divergence – Secret Smart Money signal
📐 Standard Deviations – Predict future targets
🎣 Stop Hunt Trading
🧠 Level Up your Mindset
🛕 Monk Mode – Transition from 9–5 to full-time trading
⚠️ Trading Enemies – Habits that destroy success
🔄 Trader’s Routine – Build discipline daily
💪 Get Funded - $20 000 Monthly Plan
🛡️ Risk Management
🏦 Risk Management for Prop Trading
📏 Risk in % or Fixed Position Size
🔐 Risk Per Trade – Keep consistency
David Perk aka Dave FX Hunter ⚔️
INTERVIEW: EXCAVO View 12/12/25In my previous post, I invited you to ask any questions you had about the current market, the cycle structure, Bitcoin dominance, altcoins, timing, and everything in between.
You asked - and here are the detailed answers.
This is the continuation of our interview series.
I have taken every question from the comments, grouped them under your usernames, and provided full, transparent explanations based on my current market view.
Let's dive in.
@just5
Q:
Why do you say the bear market started in November? If it started earlier, why not in October?
Where does the 126k top come from?
Why is Bitcoin dominance so high?
Why haven't many altcoins (ETH, SOL) broken their previous highs? How far can they fall?
Your analysis is based on past cycles and fractals. Do you admit you can be wrong?
A:
I do not define the beginning of a bear market strictly by the date of the absolute top. For me, the trigger is the structure on the weekly timeframe. The formal high was reached in October, but the signal that confirmed the start of the bear phase was the first strong red weekly candle, which appeared in November. That is why I mark November as the beginning of the bear market.
The 126k level is not something random - the market simply traded there (around 126,250 USD depending on the exchange). So the level itself is not in question.
As for Bitcoin dominance - it is very simple. We have one main instrument in the market: BTC. It defines the weather for the entire crypto market.
When BTC rises, some alts rise and others lag.
When BTC falls, everything falls - especially assets with weaker liquidity or fundamentals.
Historically, people traded a lot of alt/BTC pairs. Many even believed altcoins were created mainly to accumulate more BTC. Today this logic still works: liquidity and attention gravitate toward Bitcoin, which naturally leads to high dominance.
Regarding ETH and SOL: I honestly expected ETH to break its previous ATH. On SOL, I have written a separate idea (I will attach the link) where, back when ETH was around $1700 and SOL was around $150, I already said that between these two I prefer ETH because cycles matter. Above $200-250 on SOL and $4900-5000 on ETH there is a large liquidity cluster. The market will eventually go there, but the question is when. This expectation kept many people in top altcoins without taking profit.
How far can altcoins fall?
My baseline scenario is a 50-60% correction from their peaks, and that is the minimum. Crypto cycles often surprise with deeper drawdowns.
Regarding the fractal and cycle approach - yes, my view is based on previous cycles. But of course, I admit that I can be wrong. If I am wrong, I will acknowledge it publicly. TradingView does not allow deleting ideas, everything stays visible, so everyone can judge my track record objectively.
@louistran_016
Q:
If the 41% drop (126k -> 75k) happened in 2 months, why would the move to 60k take another 10 months?
Is the 60k downside target too high?
Is September 2026 too late for a market bottom?
If the previous bottom in 2022 was at the 100-month EMA (around 16k), should not the next bottom be around 44k?
A:
I never said the drop to 60k must take 10 months. The chart is not obligated to move like "stick down -> stick up". We have only two axes: price and time.
The market can:
drop quickly,
then consolidate,
then spend months accumulating before the next move.
Even if we hit 60k in 3 months, it does not mean the market will immediately reverse. Accumulation can take time.
The 60k target is indeed a "high" bottom for a bear market because it is only about a 50% correction from the peak. I do not exclude deeper scenarios: 60-65-70% drawdowns are normal for crypto. But even 60k is a much better long-term buying zone than 90-100k or current prices.
September 2026 is not "too late" in my view. It aligns well with the classical cycle structure: distribution -> decline -> depression -> accumulation.
Regarding the 44k idea based on the 100-month EMA:
It is absolutely possible. I do not rule it out. But tactically, I first target the 60-64k zone and then will reassess whether deeper levels become realistic.
@ikkie
Q:
Many people are calling this a bear market. Is that a bad sign?
A:
What I actually see is many influencers publicly questioning whether this is a bear market because they did not exit in time, and now it is hard for them to admit it to their audiences.
The fact that many people call it a bear market is completely normal. The real question is not how people label the market, but what you do with your money.
Being out of the market is also a position, sometimes the best one.
When price enters a transition phase, staying flat can be a very strong decision.
@luaselene
Q:
What about ETH?
A:
ETH has a large liquidity zone above $4900-5000. I expect this region to be taken in one of the future bullish phases, but not in the near future. More realistically, this is a 2026-2027 story. Within the current part of the cycle, I do not expect ETH to sustainably break the ATH.
@mpd
Q:
I expect a retest of 100k before a crash to 35k. Thoughts?
A:
A very realistic scenario.
A retest of 100k is the perfect psychological trap:
it attracts the last wave of euphoric buyers,
it loads the market with long positions (usually with leverage),
and then the market can wipe them out with a deeper drop, even toward your 35k target.
Crypto loves this pattern: round number -> FOMO -> leverage -> liquidation.
@KoDPrey
Q:
Why should the drop to 70k lead to a long correction instead of being a quick liquidity sweep before a move to 150-200k?
Why do you think this cycle repeats previous ones?
Can BTC dominance reach 70% in a bear market?
Aren't we in the middle of a bull market?
If you were wrong on PORTAL longs, can you also be wrong about the entire cycle?
A:
I do not think the drop to 70k must be a simple wick with an instant reversal. Historically, Bitcoin cycles include a depression phase where people lose hope, liquidity gets washed out, and even long-term holders capitulate.
After this phase, a move toward 150-200-250k makes much more structural sense.
A simple "drop -> instant all-time-high" scenario resembles the old "supercycle" meme. Possible? Maybe. Likely? In my view - not now.
This cycle is indeed different:
almost no broad altseason,
many more participants, institutions, and countries involved,
much more infrastructure that can liquidate traders' positions,
more derivatives, more leverage, more points of failure.
But Bitcoin's macro-cycle structure is still fractally consistent.
The shapes and speeds change - the logic does not.
Can Bitcoin dominance hit 70%?
Yes. In crypto anything is possible. I consider this scenario totally realistic, even within a bear market.
Are we in the middle of a bull market?
In my view - no. I do not think we are anywhere near the middle of a bull run.
Regarding PORTAL: yes, I was wrong. And not only there, I have been wrong many times. But even with those mistakes, I closed my positions, exited both spot and margin, and avoided much deeper drawdowns.
Of course I can be wrong about the cycle. I am sharing my view, not claiming infallibility. My win rate is far from perfect, and every idea remains public on TradingView. Anyone can check them later.
@houari14
Q:
What do you think about the USDT Dominance index (USDT.D)? Is it reliable?
A:
Honestly, I barely use USDT.D in my analysis. Yes, it shows whether market participants prefer sitting in stablecoins or taking risk, but for me it is not a primary metric.
I focus more on:
BTC price,
market structure,
dominance of BTC itself,
volume behavior,
and how major altcoins react.
@anatta_
Q:
How far can BTC fall in this bear market?
How long will the bear market last?
If BTC holds 80-85k for a few months, can it start a new bull cycle?
A:
I expect at least a 50% correction from the top. Realistically, 60-65-70% drawdowns are absolutely possible. More than 75% I do not consider my baseline, but in crypto nothing is impossible.
Regarding duration:
My estimation is that the bear market should end toward late 2026. Around September 2026 I expect a major bottom, a zone where long-term accumulation becomes attractive.
If BTC holds 80-85k for a few months, yes, theoretically it could trigger a new bullish phase, especially if a strong new narrative appears. But I am not betting on that scenario. I prefer staying out of the market until the cycle structure becomes clear.
@tommayhew
Q:
Is there a connection between the recent Cloudflare security incident and the crypto drop?
A:
The timing was surprising, and it is natural to link the two events. But at this moment I do not see solid evidence that the incident caused the market drop. Maybe more information will appear later, but for now I treat it as a coincidence rather than a catalyst.
@simplejoe1
Q:
We already have ETFs and a pro-BTC U.S. president. Could this be the absolute top?
A:
ETFs and a pro-Bitcoin president do not automatically guarantee continuous growth, nor do they define the market top.
The president also has:
his own memecoin, check how its chart looks,
his own crypto-investing fund, check its token too.
These examples show that one person, even the U.S. president, does not determine the entire market. The market is bigger and more complex than a single headline.
Best regards,
EXCAVO
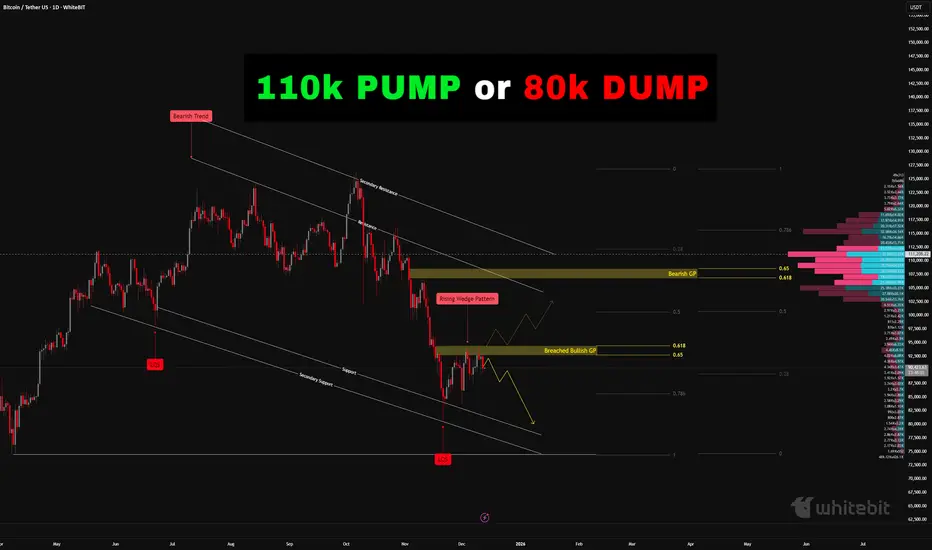
Bitcoin Market Assessment - 110k or 80k incoming?Bitcoin Market Assessment – WhiteBit Chart & Exchange (Daily Time Frame)
Welcome back everyone.
Today we will be evaluating Bitcoin using the WhiteBit chart on the daily time frame.
Market Overview
Bitcoin recently surged to 126k, sweeping liquidity at the highs. Shortly after, the market sold off aggressively partly amplified by tariff news—which reinforced the upper resistance zone and caused price to break back below it.
Price continued to decline sharply, reaching 80.3k, where millions in positions were liquidated.
Current Technical Structure
1. Breached Bullish Golden Pocket
Price has broken below the bullish Golden Pocket (0.618–0.65).
Once breached, this zone typically flips into resistance, which is what we’re seeing now.
2. Rising Wedge on the 4H
On the 4-hour chart, price is forming a rising wedge, a pattern that often precedes continuation to the downside.
This wedge aligns directly with the breached Golden Pocket, forming a strong confluence of resistance.
3. Trend Context
Price action is still within a high-time-frame bearish trend, and the recent push upward appears to be a standard bearish pullback rather than a shift in structure.
These combined factors suggest the possibility of a deeper move down.
Downside Levels of Interest
0.786 Fibonacci Retracement (~85.6k)
Next discount zone and logical target if the bearish structure continues.
80k Psychological Level
A major high-volume and psychological area. If 85.6k breaks, a retest of 80k becomes probable.
Bears are clearly targeting this zone.
Volume Profile Insight
Using the anchored volume tool, a significant cluster of volume sits around 111k—just above the key 110k level and very near the bearish Golden Pocket (0.618–0.65).
This area has not yet been retested.
On higher time frames, the bearish Golden Pocket often acts as the ideal retracement zone before price continues lower. This creates a compelling upside target if the bearish scenario invalidates.
Market Tone
Momentum remains weak on the bullish side, with sellers maintaining control.
As long as price remains below the breached Golden Pocket, the market structure continues to favor the downside.
Scenario Summary
Bullish Scenario
Price breaks above and closes above the breached bullish Golden Pocket (0.618–0.65 zone).
Sustained strength above this level opens the door for:
- 110k retest, aligning with major volume at 111k
- Potential wick or extension into the bearish Golden Pocket
This would temporarily invalidate short-term bearish momentum.
Bearish Scenario (Primary)
Breached Golden Pocket continues acting as strong resistance.
Rising wedge breaks down.
Price targets:
- 0.786 Fib at 85.6k
- 80k psychological level if 85.6k fails
- Overall bearish trend remains intact, with bulls showing weakening momentum.
Thank you all so much for reading.
BTC has made a lot of reactions take place this year, from record breaking highs to record breaking liquidations of 19 Billion in just a few hours!
It is important to be cautious, risk only what you can afford to lose and ensure you take on proper risk management.
Make sure to follow and comment below what you think! If you would like any guides, or assessments of specific crypto currencies done, let me know!
Volume Do Not Predict Price! - It Explains It!Most traders look at volume the wrong way.✖️
They expect volume to tell them where price will go next.
But volume’s real job is much more important:
Volume explains why price moved the way it did.
If you learn to read volume correctly, price action becomes clearer, not noisier.
1️⃣ Price Up + Rising Volume = Commitment
When price moves higher and volume expands, it means buyers are committed, not just reacting.
This is not random buying.
This is participation.
📈Rising volume during an impulse confirms that the move is supported by real interest, not just thin liquidity.
Strong trends are built on expanding volume.
2️⃣ Price Up + Falling Volume = Warning
When price continues higher but volume dries up, something changes.
The move still exists... but conviction doesn’t.
This often signals:
- exhaustion
- a potential pause
- or an upcoming correction
That’s when professionals stop chasing and start managing risk.
3️⃣ Sideways Price + Rising Volume = Accumulation or Distribution
This is where most traders get confused:
Price isn’t moving much, but volume is increasing.
That’s not boredom.
That’s positioning.
Large players don’t chase price.
They build positions quietly while price looks “dead.”
Breakouts that follow these zones tend to be fast and decisive, because the work was already done.❗️
4️⃣ Breakouts Without Volume Are Suspect
A breakout candle looks exciting.
But without volume, it’s just a move, not a decision.
Low-volume breakouts often lead to:
- fakeouts
- traps
- fast reversals
🏹Volume doesn’t need to explode... but it needs to confirm participation.
💡The Big Picture
Volume is not a signal by itself. It’s context.
Price tells you what happened, while Volume tells you how serious that move really was.
✔️When price and volume agree, trades feel easy.
✖️When they disagree, something important is hiding underneath.
⚠️ Disclaimer: This is not financial advice. Always do your own research and manage risk properly.
📚 Stick to your trading plan regarding entries, risk, and management.
Good luck! 🍀
All Strategies Are Good; If Managed Properly!
~Richard Nasr

The Real Bitcoin Bottom: It’s in the Power BillThe Cost of Mining 1 BTC – Autumn 2025 Deep Dive
First of all, I want to say that I already made a similar publication in 2020 about the cost of Bitcoin, and we reached these levels (the chart is below).
Introduction: The Bitcoin mining industry in Autumn 2025 stands at a crossroads. Network difficulty has soared to all-time highs, squeezing miner profit margins as hashpower races ahead of price. The hashprice – the daily revenue per unit of hashing power – has slumped to record lows around $54 per PH/s-day (down from ~$70 a year ago). Analysts expect this metric to languish between $50 and $32 until the next halving in 2028, underscoring how challenging the economics have become. In this environment, understanding the cost to mine 1 Bitcoin is more crucial than ever. Below, we present a detailed comparison of popular ASIC miners and analyze which rigs remain profitable (or not) at current prices. We’ll also explore how the cost of production acts like a magnetic price level for BTC – often drawing the market down to this “floor” before a rebound – and what that means for investors now.
Cost to Mine 1 BTC by ASIC Miner Model (at $0.03–$0.10/kWh)
To quantify Bitcoin’s production cost, we compare leading ASIC miners from Bitmain, MicroBT, Canaan, Bitdeer, and Block. Table 1 below shows key specs and the estimated cost to mine one BTC under different electricity prices (from very cheap $0.03/kWh to pricey $0.10/kWh):
Key Takeaways:
Electricity price is the dominant factor in mining cost. At an ultra-cheap $0.03/kWh (possible in regions with subsidized power or stranded energy), even older-generation miners can produce BTC for well under $30k per coin. In our table, all models have a cost per BTC between ~$21k and $27k at $0.03/kWh – a fraction of Bitcoin’s current ~$90k–$95k market price.
At a mid-tier rate of $0.05/kWh (typical for industrial miners in energy-rich areas), the top machines still show healthy margins. Bitmain’s flagship S21 XP leads with roughly $36k cost per BTC, while other new-gen rigs fall in the ~$39k–$45k range. These figures imply profit margins of 50–60% for efficient miners at $0.05 power.
At a pricey $0.10/kWh (common for retail electricity or high-tariff regions), mining costs skyrocket. Only the very latest ASIC (S21 XP) stays comfortably below the current BTC price, at around $72k per coin. Most other models hover in the $78k–$90k range, meaning their operators are earning little to no profit at spot prices. In fact, at $0.10/kWh, a miner like the Avalon A15 Pro would spend about $89k to generate one BTC – essentially breakeven with Bitcoin at ~$90k. This illustrates why high-power-cost miners struggle or shut off during downturns.
Profitable vs. Unprofitable: Current Market Reality
Which miners are still profitable at today’s rates? Given Bitcoin’s price in the low $90,000s and typical industrial electricity around $0.05–$0.07/kWh, the newest generation ASICs remain comfortably profitable, while older, less efficient models are on the edge. For example:
Latest-gen winners: The Bitmain S21 XP – with industry-best ~13.5 J/TH efficiency – can mine a coin for roughly $36k at $0.05/kWh, leaving a huge cushion against price. Even at $0.07/kWh (a common hosting rate), its cost per BTC would be on the order of ~$50k, still well below market price. Other 2024–2025 flagship units (Whatsminer M60S++, Bitdeer A2 Pro, Block’s Proto) likewise have breakeven power costs around $0.12–0.13/kWh; they remain viable in most regions except the very expensive ones.
Older-gen on the brink: By contrast, an earlier-gen workhorse like the Antminer S19 XP ( ~21.5 J/TH) or similarly efficient rigs from 2021–2022 generation become marginal at moderate power rates. An S19 XP mining at $0.08/kWh sees its cost per BTC climb to roughly ~$94k (near current price), and at $0.10 it exceeds $110k (mining at a loss). Many such units are only profitable in locales with <$0.05 power. This is why we’ve seen miners with older fleets either upgrade or retire hardware as the margin for profitability narrows.
The efficiency gap: The spread between best-in-class and older miners translates directly into survivability. A miner burning 30–40 J/TH can only stay online if they have extremely cheap electricity or if BTC’s price is far above average production cost. As of Q4 2025, Bitcoin’s price is indeed high, but so is the network difficulty – meaning inefficient gear yields so little BTC that electricity costs outweigh revenue in many cases.
According to one industry report, the cost of mining 1 BTC varies widely across companies – from as low as ~$14.4k for those with exceptional power contracts (e.g. TeraWulf’s U.S. facilities) to as high as ~$65.9k for others like Riot Platforms, even before accounting for overhead. (Riot’s effective cost was brought down to ~$49.5k after cost-cutting measures.) This huge range shows how electricity pricing and efficiency determine which miners thrive. In early 2025, the situation became so extreme that CoinShares analysts found the average all-in production cost for public mining companies spiked to ~$82,000 per coin – nearly double the prior quarter (post-halving impact) – and up to $137,000 for smaller operators
ixbt.com
. At that time Bitcoin was trading around $94k, meaning many miners, especially smaller ones, were underwater and operating at a loss. In high-cost regions like Germany, the breakeven cost even hit an absurd ~$200k per BTC, making mining there utterly unviable.
Bottom line: At current prices, only miners with efficient rigs and reasonably cheap power are making money. Those with older equipment or expensive electricity have minimal margins or are already in the red. This dynamic naturally leads to miners shutting off machines that don’t profit, which in turn caps the network hashrate growth until either price rises or difficulty drops. It’s a self-correcting mechanism – one that ties directly into Bitcoin’s production cost acting as a market floor.
Production Cost as Bitcoin’s “Magnetic” Price Level
There’s a saying in the mining community: “Bitcoin’s price gravitates toward its cost of production.” In practice, the production cost often behaves like a magnet and a floor for the market. When the spot price climbs far above the cost to mine, it invites more hashing power (and new investment in miners) until rising difficulty pulls costs up. Conversely, if price falls below the average production cost, miners start to capitulate – selling coins and shutting rigs – until the difficulty eases and the market finds a bottom. This push-pull keeps price and cost loosely tethered over the long run.
Notably, JPMorgan’s research this cycle highlighted that Bitcoin’s all-in production cost (now around ~$94,000) has “empirically acted as a floor for Bitcoin” in past cycles. In other words, the market has rarely traded for long below the prevailing cost to mine, because at that point fundamental supply dynamics kick in. As of late 2025, they estimate the spot price is hovering just barely above 1.0 times the cost (~1.03x) – near the lowest end of its historical range. This implies miners’ operating margins are razor-thin right now, and any extended move significantly below ~$94k would likely trigger miner capitulation and supply contraction. In plainer terms: downside from here is naturally limited – not by hope or hype, but by the economics of mining. If BTC dropped well under the cost floor, many miners would simply turn off machines rather than mine at a loss, removing sell pressure and helping put in a price bottom.
History supports this magnetic pull. In previous bear markets, Bitcoin has tended to retest its production cost during the worst of capitulations. For example, during the late-2018 crash and again in the 2022 downturn, BTC prices plunged to levels that put numerous miners out of business. But those phases were short-lived. Prices found support once enough miners quit and difficulty adjusted downward, allowing the survivors to breathe. The market “wants” to stay near the cost of production, as that is a sustainable equilibrium where miners neither drop like flies nor earn excessive profits. Whenever price strays too high above cost, it usually invites a surge in competition (hashrate) that raises the cost floor; when price sinks too low, hashpower falls until cost drops to meet price. It’s an elegant economic dance built into Bitcoin’s design.
Why Price Often Meets Cost Before Rebounding
If Bitcoin production cost is a de facto floor, why do we often see price fall all the way down to it (or even briefly below it) before the next big rally? The answer lies in miner psychology and market cyclicality:
Miner Capitulation & Shakeouts: Markets are cruel to the over-leveraged and inefficient. During bull runs, miners expand operations, often taking on debt or high operating costs under the assumption of continually high prices. When the cycle turns, Bitcoin’s price can free-fall toward the cost of production, erasing margins. The weakest miners (highest costs or debt loads) capitulate first – selling off their BTC reserves and unplugging hardware. This wave of forced selling can push price right to (or slightly under) the cost floor, marking a final “shakeout” of excess. Only when the weakest hands are flushed does the market rebound. It’s no coincidence that major bottoms often align with news of miner bankruptcies or mass liquidations.
The Iron Law of Hashrate: Miners are competitive and will run at breakeven or even slight loss for some time, hoping for recovery, rather than quit immediately. This means the network can temporarily operate above sustainable difficulty levels. Eventually, however, reality sets in. When enough miners can’t pay the bills, hashrate plateaus or drops, halting difficulty growth or causing it to decline. At that inflection point, the cost of mining stabilizes (or falls), giving relief to the remaining miners. The stage is set for price to rebound off the now-lower equilibrium. In essence, Bitcoin often has to tag its production cost to force a network reset and purge imprudent operators. Only after that cleansing can a fresh uptrend begin with a healthier foundation.
Investor Sentiment at the Floor: From a contrarian market perspective, a convergence of price and production cost typically corresponds with maximum pessimism. If Bitcoin is trading at or below what it “should” cost to make, it signals extreme undervaluation to savvy investors. In late 2022, for instance, estimates of BTC’s cost basis in the $18k–$20k range coincided with the market trading in the mid-$15k’s – a level where miners were going bankrupt and sentiment was in the gutter. Yet those willing to be greedy when miners were fearful reaped the rewards when price recovered. The same pattern could be unfolding now in late 2025: the public is fearful of Bitcoin’s recent pullback, but its cost floor (~$94k) suggests fundamental value support. Smart money knows that when price meets cost, downside is limited and upside potential grows.
Conclusion – Steeling Ourselves at the Cost Floor
In EXCAVO’s signature fashion, let’s cut through the noise: Bitcoin’s production cost is the line in the sand – the magnetized level where price and reality meet. As of Autumn 2025, that line hovers in the mid-$90,000s, and Bitcoin has indeed been gravitating here. The data shows miners barely breaking even on average. This is a make-or-break moment. If you’re bullish because everyone else is, check your thesis – the real reason to be bullish is that BTC is scraping its cost floor, a level from which it has historically sprung back with vengeance. Conversely, if you’re panicking out of positions now, remember that you’re selling into the teeth of fundamental support. The market loves to punish latecomers who buy high and sell low.
Yes, the mining industry is under stress; yes, the headlines scream fear. But those very pressures are what forge the next bull run. Every miner that shuts off today is one less source of sell pressure tomorrow. Every uptick in efficiency raises the floor that much higher, like a coiled spring tightening. Bitcoin has been here before – when production cost and price locked jaws in late 2022, and again in early 2025 post-halving. Each time, the doom and gloom was followed by a dramatic recovery as the imbalances corrected.
Our contrarian take: The cost of mining 1 BTC isn’t just a number on a spreadsheet – it’s the secret pulse of the market. Right now it’s telling us that the bottom is in or very near. Prices might chop around this magnet a bit longer, even dip slightly below in a final fake-out, but odds of a deep crash under the ~$94k cost basis are slim. The longer Bitcoin grinds at or below miners’ breakeven, the more hashpower will fall off, quietly tightening supply. When the spring releases, the next upward leg could be explosive (as even mainstream analysts like JPMorgan are eyeing ~$170k targets).
In summary, Bitcoin tends to revisit its production cost for one last test – and when it holds, it launches. Autumn 2025 appears to be giving us that test. The savvy, data-driven operator will view this not with panic, but with patience and resolve. After all, if you can accumulate Bitcoin near its intrinsic mining value while the herd is fearful, you position yourself on the right side of the trade once the inevitable rebound kicks in. As the saying goes, bears win, bulls win, but miners (and hodlers) who understand the cost dynamics win big in the end. Brace yourself, stay analytical, and remember: Bitcoin’s true floor is built in watts and hashes, and it’s solid as steel.
Best regards EXCAVO

BTCUSDTHello Traders! 👋
What are your thoughts on BITCOIN?
Bitcoin is currently consolidating within a well-defined range between $88,000 and $95,000, while continuing to trade inside an ascending channel.
The lower boundary of this ascending channel aligns closely with the $88,000 support zone, adding confluence and strengthening this area as a key demand region. At the moment, price action is hovering near the channel support, suggesting that selling pressure is weakening.
As long as the price holds above the $88,000 support, we expect some short-term consolidation followed by a bullish push toward the upper range at $95,000.
A clean breakout above $95,000 could open the door for a continuation move toward the upper boundary of the ascending channel, which would act as the next upside target.
A sustained break below the channel support would invalidate this scenario.
Don’t forget to like and share your thoughts in the comments! ❤️

Bitcoin at Critical Resistance — Bull Trap!?Over the past couple of hours, Bitcoin ( BINANCE:BTCUSDT ) has surprised many traders—including myself—with its sharp movements. The potential reason behind this could be an anticipated interest rate cut tomorrow. However, the recent JOLTS Job Openings did not fully align with that expectation.
With our technical analysis tools, we can delve deeper into Bitcoin’s next moves. The key question is whether Bitcoin will maintain its recent bullish momentum or if a reversal is imminent.
It’s important to note that in the next 24 to 48 hours, we may see increased volatility in the financial markets, particularly in crypto. Therefore, it’s wise to practice good risk management—or even consider staying on the sidelines until the market settles.
At the moment, Bitcoin has managed to break through resistance lines, but the volume of this breakout hasn’t been particularly high. Bitcoin is also near a resistance zone($94,850-$93,000), monthly pivot points, and significant levels of Cumulative Short Liquidation Leverage($98,260-$94,600), all of which add to the complexity.
High sell orders: $96,000-$94,800
From a classical technical standpoint, there’s potential for a bearish flag pattern forming. As long as Bitcoin remains below $100,000, this scenario remains plausible.
From an Elliott Wave perspective, it seems that the main Wave B has completed, and we’re likely looking at a ZigZag correction(ABC/5-3-5). This correction might complete either at the resistance zone($94,850-$93,000) or near the daily 50_SMA(Daily).
Considering that the S&P 500 index ( SP:SPX ) is also showing a bearish trend, it’s more likely that Bitcoin’s main corrective Wave C will complete within these resistance levels.
Also, the USDT.D% ( CRYPTOCAP:USDT.D ) remains a crucial factor. Until it hits around 5.49%, the overall crypto market is likely to remain bearish.
In conclusion, I expect that Bitcoin will continue its downward movement, potentially testing $89,000 and even dropping below $85,000. This could represent a significant bearish phase for Bitcoin.
What are your thoughts? Do you think Bitcoin will maintain this bullish momentum, or are we headed for more downside?
Cumulative Long Liquidation Leverage: $89,430-$88,750
Cumulative Long Liquidation Leverage: $83,900-$82,400
First Target: $90,300
Second Target: $87,503
Stop Loss(SL): $100,020(Worst)
Points may shift as the market evolves
💡 Please respect each other's opinions and express agreement or disagreement politely.
📌Bitcoin Analysis (BTCUSDT), 4-hour time frame.
🛑 Always set a Stop Loss(SL) for every position you open.
✅ This is just my idea; I’d love to see your thoughts too!
🔥 If you find it helpful, please BOOST this post and share it with your friends.

Why the Reaction Matters More Than the Level!!!Most traders spend their time hunting for the perfect level.✖️
Support. Resistance. Demand. Supply.
They draw the zone… and assume price must react.
But professionals know something crucial:
The level itself is not the edge.
The reaction is.
Here’s why.
1️⃣ Levels Are Common Knowledge
Everyone sees the same support.
Everyone sees the same resistance.
If levels alone were enough, everyone would be profitable.
A level is just a location.📍
It doesn’t tell you who is in control.
2️⃣The Reaction Reveals Intent
What matters is how price behaves at the level.
Ask yourself:
- Does price reject immediately or hesitate?
- Are candles impulsive or overlapping?
- Does price leave the level with strength or drift away slowly?
A strong reaction tells you:
➡️ One side stepped in aggressively.
A weak reaction tells you:
➡️ The level exists… but conviction doesn’t.
3️⃣ Clean Rejections Beat Perfect Levels
A slightly imperfect level with a violent reaction
is far more valuable than a textbook level with no follow-through.
Professionals wait for:
- sharp rejections
- momentum expansion
- structure confirmation
They don’t assume... they observe.
4️⃣ Failed Reactions Are Warnings
When price reaches a level and does nothing…
that silence is information.
Failed reactions often lead to:
- level breaks
- deeper moves
- trend continuation
The market is telling you:
➡️ “This level no longer matters.”
📚The Big Lesson
Levels tell you where to look.
Reactions tell you what to do.
If you shift your focus from drawing levels to reading behavior at levels,
your trading instantly becomes clearer and more objective.
⚠️ Disclaimer: This is not financial advice. Always do your own research and manage risk properly.
📚 Stick to your trading plan regarding entries, risk, and management.
Good luck! 🍀
All Strategies Are Good; If Managed Properly!
~Richard Nasr
Why Risk–Reward Matters More Than Win Rate!!One of the biggest myths in trading is this:
“I need to win more trades to be profitable.”
✖️You don’t...
Some of the most profitable traders in the world win less than 50% of their trades.
So what’s the real edge?
👉 Risk–reward.
1️⃣ Win Rate Without Risk–Reward Is Meaningless
A trader who wins 70% of the time but risks 3 to make 1 is still bleeding slowly.
Meanwhile, a trader who wins only 40% of the time
but risks 1 to make 3 can grow consistently.🪜
Win rate tells you how often you’re right.
Risk–reward tells you how much it matters when you are.
2️⃣ Risk Defines the Trade Before Entry
Professionals don’t start with targets.
They start with invalidation.
They ask:
- Where is my idea wrong?
- Where does structure break?
- Where must I be out?
Only after risk is defined, do rewards become meaningful.🏆
If you don’t know where you’re wrong,
you don’t know what you’re trading.
3️⃣ Good Risk–Reward Creates Emotional Stability
When your risk is small and predefined:
- losses feel normal
- hesitation disappears
- overtrading drops
Why?
Because no single trade can hurt you badly❗️
Risk–reward doesn’t just protect your account.
It protects your mindset.
4️⃣ Risk–Reward Is What Builds Consistency
Consistency doesn’t come from winning streaks.
It comes from surviving losing streaks.📉
Proper risk–reward ensures:
- drawdowns stay shallow
- confidence stays intact
- discipline stays repeatable
That’s how traders last long enough to let probabilities work.
📚The Big Lesson
✔️You don’t need to be right more often.
✖️You need your winners to matter more than your losers.
When risk is controlled and reward is logical, trading stops feeling like gambling and starts feeling like execution.
⚠️ Disclaimer: This is not financial advice. Always do your own research and manage risk properly.
📚 Stick to your trading plan regarding entries, risk, and management.
Good luck! 🍀
All Strategies Are Good; If Managed Properly!
~Richard Nasr

Bitcoin falling trendline soon will break and Bulls will lead Bitcoin is currently trading within an ascending channel, encountering resistance near both the channel's upper boundary and a significant historical descending trendline. While this confluence of resistance has prompted a short-term pullback, the overall structure suggests a potential breakout attempt in the near term.
A decisive move above the falling trendline would signal a shift in market structure, likely invalidating the bearish momentum and transitioning the market into either a consolidation range or a renewed bullish phase .
Following a confirmed breakout, the technical setup would support the potential for further upward movement, with progress expected to become more sustained once this key resistance zone is cleared.
So get Ready also other paths mentioned on the chart too what may happen in your view comment below !!
DISCLAIMER: ((trade based on your own decision))
<<press like👍 if you enjoy💚

BTCUSDT: Buyers Regain Control — $96,000 in FocusHello everyone, here is my breakdown of the current BTCUSDT setup.
Market Analysis
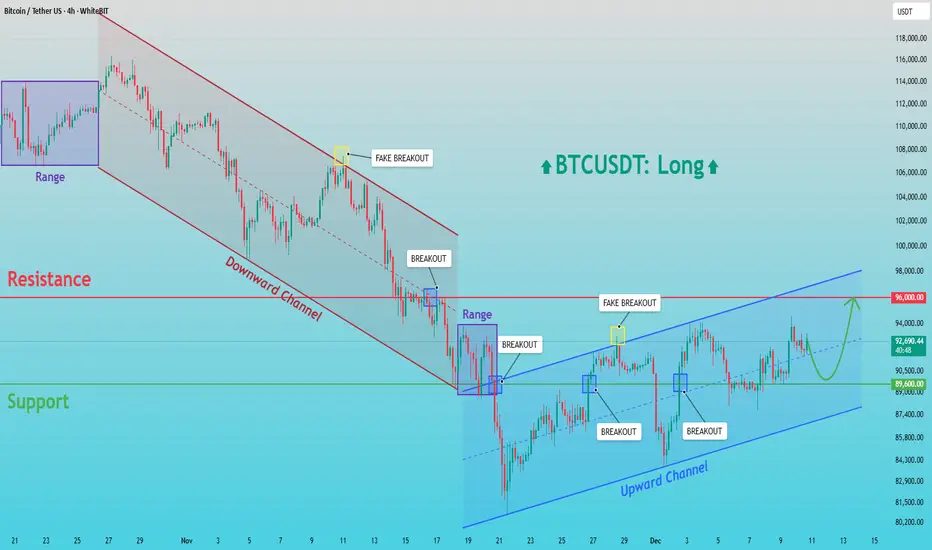
Bitcoin is transitioning from a broader bearish phase into a developing bullish structure. After a prolonged decline inside a well-defined downward channel, BTC formed a base near the $89,600 support zone, where strong buyer interest appeared. Multiple breakouts and fake breakouts around this level confirmed accumulation and growing bullish pressure. Following this reversal, price broke out of the bearish channel and entered a new ascending channel, forming higher highs and higher lows.
Currently, BTCUSDT is consolidating inside this upward structure and trading below the key $96,000 resistance, which remains the major obstacle for buyers. Several false breakouts near this resistance indicate that sellers are still active in this area. However, as long as price holds above the $89,600 support, the bullish structure remains valid and buyers stay in control.
My Scenario & Strategy
My scenario is bullish as long as BTCUSDT stays above the $89,600 support zone and continues to respect the ascending channel structure. I expect the price to gradually build momentum and attempt a retest of the $96,000 resistance. A clean and confident breakout above this level would confirm further upside continuation and open the way for higher targets.
However, if the price fails to break $96,000 and shows strong rejection, a short-term pullback toward the lower channel support may occur. For now, the market favors buyers, with $96,000 as the key upside objective.
That's the setup I'm tracking. Thank you for your attention, and always manage your risk.
Bitcoin Pullback to Resistance — Next Drop Loading?As I expected , Bitcoin( BINANCE:BTCUSDT ) has begun its decline from the resistance zone($94,850-$93,000) and has reached its target.
Currently, Bitcoin is moving near the resistance zone($90,900-$90,100), the Cumulative Short Liquidation Leverage($91,840-$90,110), and other resistance lines.
From an Elliott Wave perspective, it appears that Bitcoin has completed its five-wave downward sequence and is now in the process of forming the corrective waves upward, likely within the resistance zone($90,900-$90,100).
Moreover, since the USDT.D% ( CRYPTOCAP:USDT.D ) has successfully broken the upper line of its falling wedge pattern, we can anticipate further increases in USDT.D%, which could put additional downward pressure on Bitcoin.
Additionally, considering that the S&P 500 index( SP:SPX ) is likely to resume a bearish trend, and given Bitcoin’s correlation with the SPX, a further decline in Bitcoin is not unexpected.
In conclusion, based on the above analysis, I expect that Bitcoin will at least test the support lines and, if those are broken, it may continue to decline toward the Cumulative Long Liquidation Leverage($87,000-$85,663). If the momentum of breaking these support lines is strong, we can expect even more significant downward movement.
Do you think Bitcoin can go below $87,000?
First Target: Support lines
Second Target: Cumulative Long Liquidation Leverage($87,000-$85,663)
Stop Loss(SL): $92,000(Worst)
Points may shift as the market evolves
💡 Please respect each other's opinions and express agreement or disagreement politely.
📌Bitcoin Analysis (BTCUSDT), 1-hour time frame.
🛑 Always set a Stop Loss(SL) for every position you open.
✅ This is just my idea; I’d love to see your thoughts too!
🔥 If you find it helpful, please BOOST this post and share it with your friends.

BTCUSD: Buyers in Control - Resistance Retest AheadHello everyone, here is my breakdown of the current BTCUSDT setup.
Market Analysis
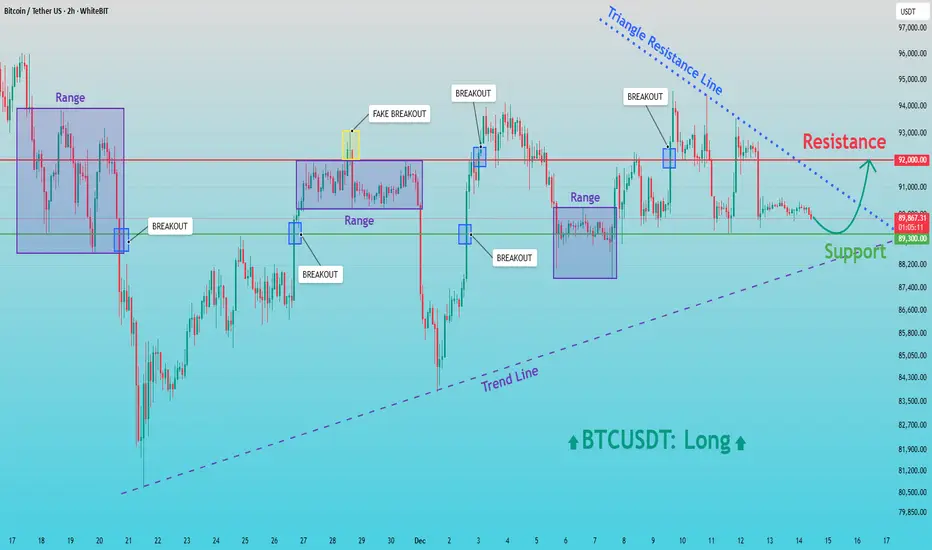
BTCUSDT is currently trading within a broadly bullish structure, supported by a rising trend line that has been respected after the major sell-off and subsequent recovery. Following the strong decline, price formed a base near the lower levels and initiated a reversal, creating higher lows and shifting market control back to buyers. After the initial rebound, Bitcoin entered multiple Range phases, where price consolidated and built liquidity. Each range was followed by a breakout, confirming sustained buying interest. Some of these moves included fake breakouts, which briefly trapped participants before price continued to respect the broader bullish structure.
Currently, BTCUSDT is holding above the key Support Zone around 89,300, which has repeatedly acted as a demand area. Price is also compressing under a descending Triangle Resistance Line, while the rising trend line continues to support the market from below. This creates a tightening structure, suggesting that a decisive move is approaching. The 92,000 Resistance level remains the main barrier overhead, where sellers have previously stepped in and rejected higher prices.
My Scenario & Strategy
My scenario remains bullish as long as BTCUSDT holds above the 89,300 Support Zone and continues to respect the ascending trend line. I expect buyers to defend this area and gradually build pressure toward the upper resistance. A clean breakout above the 92,000 Resistance, especially with strong momentum, would confirm bullish continuation and open the path for a move toward higher levels, aligned with the broader trend.
However, if price fails to break the triangle resistance and loses the 89,300 Support, a deeper pullback toward the trend line could occur before buyers attempt another recovery. Until such a breakdown happens, the structure favors buyers. For now, the market remains constructive, with support holding and resistance at 92,000 as the key level to watch.
That’s the setup I’m tracking. Thank you for your attention, and always manage your risk.
BTC/USDT | Hold 90K or Prepare for a Heavy Flush? Let's See!CRYPTOCAP:BTC pushed into $94,700, tapped the target perfectly, and then slipped into a sharp correction. Right now Bitcoin is trading around $90,000, and the entire market is focused on a single decision level. If BTC can stabilize above $90,000 within the next 24 hours, the bullish structure stays alive and we can look for a continuation toward $97,000 and then $100,000.
If BTC fails to hold $90,000, the door opens for a deeper decline and the first downside target becomes the $78,000 demand zone. This is the point where the next major direction gets decided.
Please support me with your likes and comments to motivate me to share more analysis with you and share your opinion about the possible trend of this chart with me !
Best Regards , Arman Shaban
Emotional Patterns: What Your Trades Reveal About YouTrading feels technical on the surface, yet the deeper layer is psychological. Charts highlight opportunities, but the way you behave inside those opportunities shapes the outcome. Each trade reflects how you respond to pressure, uncertainty, and risk. Over time, these reactions create emotional patterns that influence results more than strategy.
One early pattern appears after a loss. A losing trade often triggers frustration, and that frustration pushes traders into fast entries aimed at regaining control. The decision becomes driven by emotion rather than process, and this behaviour can quickly lead to a cycle of overtrading.
Winning streaks create a different pattern. Confidence expands, and many traders begin increasing size, loosening rules, or entering before confirmation because recent success feels reassuring. This overextension usually leads to sharp setbacks when the market shifts.
Another frequent pattern is hesitation. Traders with inconsistent execution tend to freeze at key moments. They wait for additional confirmation, delay entries, or watch clean setups move without them. The pause often comes from the memory of previous mistakes rather than a lack of technical understanding.
Entries reflect trust in the system. Exits reflect trust in personal decision-making. Closing a trade too early often shows discomfort with open profit. Holding a losing trade too long often comes from discomfort with accepting a loss. These behaviours reveal the trader’s relationship with risk far more clearly than any written reflection. The chart becomes a mirror.
Recognising emotional patterns provides clarity. When recurring behaviours appear—chasing, hesitating, forcing trades, avoiding losses—they become easier to interrupt. Once a pattern is visible, it starts losing influence.
Structure then supports the change: rules, checklists, routines, and clear confirmation criteria. These elements stabilise execution and reduce the impact of emotional impulses.
A strategy defines potential entries, but emotional patterns determine whether the trader can execute consistently enough to benefit from it. Awareness strengthens decision-making. When you understand what your trades reveal about your behaviour, you can adjust it and bring execution closer to intention.
This is where consistency begins.

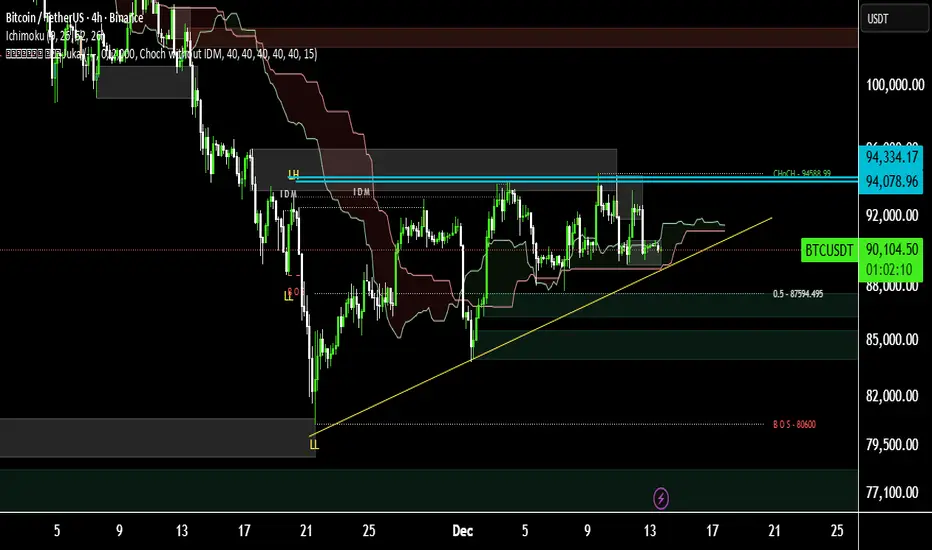
Bitcoin Testing Dynamic Support on 4H TimeframeOn the 4 hour timeframe Bitcoin is facing a key resistance at 94334 USD and is currently moving along a dynamic support line.
If this support is broken the next strong support is located around 84000 USD which could be suitable for swing trading and potential long setups.
BTC Breaks Wedge Structure, Bearish Pressure IncreasingBTC Breaks Wedge Structure, Bearish Pressure Increasing
Over the past month, Bitcoin has been consolidating within a large wedge pattern, creating a complex and somewhat misleading structure.
The recent breakout has clarified the pattern as bearish, significantly increasing the probability of further downside.
This shift in momentum may also be influenced by recent MicroStrategy-related news, particularly discussions about its potential removal from the US100 benchmark.
Growing concerns around MicroStrategy’s business model,given its extreme sensitivity to Bitcoin’s price fluctuations, have raised uncertainty in the market.
As one of the largest Bitcoin holders, any negative sentiment surrounding MicroStrategy can directly impact BTC price action.
If Bitcoin continues to hold below the broken wedge structure, bearish continuation becomes more likely. In that scenario, downside targets come into focus at:
82,000
76,400
You may find more details in the chart!
Thank you and Good Luck!
PS: Please support with a like or comment if you find this analysis useful for your trading day
