Bitcoin - Bear flag, 74k confirmed! (warning, must see)Bitcoin has just completed its bearish flag formation. What now? The probability of going down is now around 70%, while the probability of going up is only 30%. Many times we see a bullish breakout of a bear flag. How does it look? Something like that:
We see that for a bullish breakout, the bulls need to completely go above the flag's resistance, which is much harder than simply going down, especially in a strong bear market, like in this Bitcoin's case.
Bitcoin's price and development are completely controlled by the banks and huge institutions that control this planet. To make money, you have to identify their actions on the chart.
On the chart we can also see a completely unfilled FVG (Fair Value GAP). Precisely between 90600 and 92060. There is a possibility for Bitcoin to partially or completely fill this GAP before starting the upcoming drop! Longs are riskier at this point, because we want to trade with the bearish trend. But if the price increases in the short term, we can have a much better entry point for our short position on futures. It's also a possibility to retest the long-term blue trendline from the all-time high.
From the Elliott Wave point of view, this bear flag seems to be a complex corrective pattern. To be honest, I don't see any signs of strength, such as an impulse wave or a leading diagonal wedge pattern. I am currently bearish on Bitcoin, and I expect a pretty significant drop in the coming weeks! Especially January is statistically an extremely weak month for Bitcoin.
Write a comment with your altcoin + hit the like button, and I will make an analysis for you in response. Trading is not hard if you have a good coach! This is not a trade setup, as there is no stop-loss or profit target. I share my trades privately. Thank you, and I wish you successful trades!
Market insights

BTC Breaks Wedge Structure, Bearish Pressure IncreasingBTC Breaks Wedge Structure, Bearish Pressure Increasing
Over the past month, Bitcoin has been consolidating within a large wedge pattern, creating a complex and somewhat misleading structure.
The recent breakout has clarified the pattern as bearish, significantly increasing the probability of further downside.
This shift in momentum may also be influenced by recent MicroStrategy-related news, particularly discussions about its potential removal from the US100 benchmark.
Growing concerns around MicroStrategy’s business model,given its extreme sensitivity to Bitcoin’s price fluctuations, have raised uncertainty in the market.
As one of the largest Bitcoin holders, any negative sentiment surrounding MicroStrategy can directly impact BTC price action.
If Bitcoin continues to hold below the broken wedge structure, bearish continuation becomes more likely. In that scenario, downside targets come into focus at:
82,000
76,400
You may find more details in the chart!
Thank you and Good Luck!
PS: Please support with a like or comment if you find this analysis useful for your trading day

2025 BITCOIN TARGETS: Reality Check
Forecasting is easy. Being right is hard.
1. When Targets Turn Into Illusions
Look at this chart.
Bitcoin at $90,000. Sixteen days left in 2025.
And every “expert” target — JPMorgan, VanEck, Standard Chartered, Tom Lee, Kiyosaki, BlackRock, Cathie Wood —
all of them missed. Every single one.
Why?
Because it’s almost impossible to stay objective when you own the asset you’re predicting.
When you hold a position, your mind paints infinity.
You stop seeing the market — you start seeing your hopes.
You stop analyzing — you start believing.
These price targets were never forecasts.
They were wishful thinking, dressed up as analysis.
2. My Position — Stay Sane
In my posts, I always try to remain objective and grounded.
I don’t trade emotions.
I observe, analyze, and share what I actually see — not what I want to see.
And here’s what I see now:
Those bullish targets might still be achieved one day —
but not by the end of 2025.
Not even by the end of 2026.
According to my cycle analysis, the next real bull market peak will come around 2029.
And even then, it’s hard to name a precise number.
But if history repeats — and each new cycle doubles the previous one —
then levels like $250k, $275k, or even $300k are possible.
Still, even those words must be questioned.
Because the market has one constant lesson — humility.
And those who sound most confident are usually the first to be wrong.
3. Why Bitcoin Will Keep Growing Anyway
Despite all the chaos and uncertainty, one thing remains clear:
Bitcoin will keep growing in the long run.
The reasons are structural, not emotional:
mining difficulty keeps rising,
competition among miners is increasing,
the industry is expanding,
institutional interest is growing,
the circulating supply is shrinking,
the market is becoming more concentrated, leveraged, and volatile.
We’re witnessing moves that a few years ago were unimaginable.
A $20,000 daily swing is no longer shocking — it’s the new normal.
Just look back at October 11th — Bitcoin dropped $20,000 in a single day.
That’s a record.
And it will be broken again.
Because the game keeps escalating.
Bitcoin won’t die.
Unlike thousands of altcoins that fade into oblivion,
Bitcoin has too many players, too much capital, too much gravity to disappear.
4. Where We Are Now
Let’s be honest —
we’re not even halfway through this bear market.
Not even close.
Maybe 20% of the way.
The real pain is still ahead — disappointment, capitulation, and exhaustion.
And not only among retail traders.
Funds, miners, corporations — all of them will face it.
Every cycle demands maximum rejection.
It needs the crowd to give up.
That’s how markets reset.
Bear markets are not crashes — they’re slow, grinding declines that strip away hope.
They don’t destroy capital first — they destroy conviction.
5. The Bicycle Metaphor
If you plan to stay in this market the whole way down,
I’ll compare you to a man riding a bicycle downhill.
He tells himself:
“Yes, I’m going down, but I’ll keep pedaling.
When others quit, I’ll be ahead.”
But the truth is —
when he reaches the bottom,
and the next uphill begins,
he’ll have no strength left to climb.
He’ll be burned out — mentally, financially, emotionally.
He won’t make it up the next mountain.
6. What’s Happening Now
Right now, we’re in a correction phase.
The impulse move is over.
The small bounces you see — they’re not a reversal,
just temporary relief before the next leg down.
This is not the start of a new bull market — it’s a pause between declines.
The macro setup doesn’t support growth yet.
The structure isn’t there.
The market simply isn’t ready.
Every cycle gets heavier.
Each one demands more pain, more time, more cleansing.
7. The Bottom Line
I have no illusions.
No fantasies about instant rallies to $300k.
Only realism and patience.
The market will sort itself out.
But by the time the next real bull run begins,
most of those who are still “pedaling downhill” now
won’t have the energy — or the faith — to climb again.
Best regards, EXCAVO

Why Risk–Reward Matters More Than Win Rate!!One of the biggest myths in trading is this:
“I need to win more trades to be profitable.”
✖️You don’t...
Some of the most profitable traders in the world win less than 50% of their trades.
So what’s the real edge?
👉 Risk–reward.
1️⃣ Win Rate Without Risk–Reward Is Meaningless
A trader who wins 70% of the time but risks 3 to make 1 is still bleeding slowly.
Meanwhile, a trader who wins only 40% of the time
but risks 1 to make 3 can grow consistently.🪜
Win rate tells you how often you’re right.
Risk–reward tells you how much it matters when you are.
2️⃣ Risk Defines the Trade Before Entry
Professionals don’t start with targets.
They start with invalidation.
They ask:
- Where is my idea wrong?
- Where does structure break?
- Where must I be out?
Only after risk is defined, do rewards become meaningful.🏆
If you don’t know where you’re wrong,
you don’t know what you’re trading.
3️⃣ Good Risk–Reward Creates Emotional Stability
When your risk is small and predefined:
- losses feel normal
- hesitation disappears
- overtrading drops
Why?
Because no single trade can hurt you badly❗️
Risk–reward doesn’t just protect your account.
It protects your mindset.
4️⃣ Risk–Reward Is What Builds Consistency
Consistency doesn’t come from winning streaks.
It comes from surviving losing streaks.📉
Proper risk–reward ensures:
- drawdowns stay shallow
- confidence stays intact
- discipline stays repeatable
That’s how traders last long enough to let probabilities work.
📚The Big Lesson
✔️You don’t need to be right more often.
✖️You need your winners to matter more than your losers.
When risk is controlled and reward is logical, trading stops feeling like gambling and starts feeling like execution.
⚠️ Disclaimer: This is not financial advice. Always do your own research and manage risk properly.
📚 Stick to your trading plan regarding entries, risk, and management.
Good luck! 🍀
All Strategies Are Good; If Managed Properly!
~Richard Nasr

The Dark Side Of Christmas for Bitcoin!!!!!!Christmas buying pressure on Bitcoin is not always bullish.
When everyone expects holiday gains, the market often prepares for something else.
Is this seasonal optimism creating opportunity, or quietly building a selloff?
Hello✌️
Spend 3 minutes ⏰ reading this educational material.
🎯 Analytical Insight on Bitcoin:
Apart from the fundamental explanations regarding Bitcoin’s decline, which this entire article focuses on, the price has recently approached the top of the descending channel, and if the weekly support I have marked on the chart breaks, I expect at least an additional 4% drop, with a target around $82,600.
Now , let's dive into the educational section,
🎄 Overall Market Environment During Christmas
During the Christmas period, the market often enters a phase that looks calm on the surface but carries hidden selling pressure underneath, and this contradiction causes many traders to misread what is really happening.
Reduced participation from large players makes the balance between supply and demand much more fragile than usual, allowing price to react faster to emotions.
In this environment, Bitcoin tends to be more vulnerable to corrections rather than strong bullish continuation.
🧠 Crowd Psychology And Misleading Expectations
When bullish expectations turn into a common belief, the market often chooses a different path because most potential buyers are already positioned.
This collective mindset causes traders to ignore early signs of weakness and react later than they should.
Christmas often creates this exact situation, where optimism replaces realistic analysis.
💸 Converting Bitcoin Into Real Liquidity
During this period, many people prefer to convert part of their Bitcoin holdings into dollars or gold to cover expenses related to celebrations, gifts, and travel.
This behavior is not driven by fear of the market but by real-life liquidity needs.
When this decision happens on a large scale, it creates steady and continuous selling pressure.
📉 Why Selloffs Often Appear Sudden
Seasonal selling usually starts quietly and without panic, but once price reaches sensitive levels, the impact becomes visible as sharp drops.
Traders waiting for classic confirmations often realize the shift only after most of the move has already occurred.
This delay makes the decline feel more sudden than it actually is.
😰 The Hidden Role Of Fear In Decisions
During Christmas, many traders are uncomfortable holding open positions through holidays, which creates a hidden layer of fear that directly influences selling behavior.
This fear usually activates before sharp drops, not after them.
The market senses this hesitation and uses it as fuel.
🧯 Short Market Behavior Summary
Christmas is more about releasing pressure than building new trends.
Understanding this mental phase can help avoid emotional decisions.
🛠 TradingView Tools And Features For This Phase
Volume Profile helps identify areas where price lacks real trading activity, making fast drops more likely.
Session Breaks highlight periods of reduced participation where sudden moves become more dangerous.
VWAP provides a clear view of how far price is trading from market equilibrium.
Market Structure allows traders to detect weak and misleading breakouts.
🎯 Three Key Recommendations For Traders
In this environment, trading less is often a smarter decision than staying constantly active.
Capital protection should have higher priority than chasing moves.
Always ask yourself whether a trade comes from analysis or from psychological pressure.
✨ Need a little love!
We pour love into every post your support keeps us inspired! 💛 Don’t be shy, we’d love to hear from you on comments. Big thanks , Mad Whale 🐋
📜Please make sure to do your own research before investing, and review the disclaimer provided at the end of each post.

Bitcoin - Can it reclaim $89.000?Bitcoin (BTC) is currently trading in a crucial zone after the recent decline, positioned between a bullish 4-hour FVG around the lower $85,000 region and a 4-hour bearish FVG just below resistance. This BTC technical analysis focuses on whether Bitcoin can reclaim the lost trendline and the associated FVG, or whether the market instead opts for a deeper correction.
Bullish 4H FVG
The bullish 4-hour FVG around approximately $85,500 is holding for now as an important support level. From this zone, BTC recently initiated a modest bounce, indicating that buying interest is still present. As long as price continues to close above this FVG, there remains technical room for a larger recovery move toward the higher resistance zones.
Bearish Scenario
The bearish scenario centers on a rejection within the 4-hour bearish FVG that aligns with the previously broken ascending trendline. If BTC only revisits this area as a retest and is subsequently sold off, it would confirm that former support has turned into resistance. In that case, lower prices become likely again, with potential targets below the recent lows and deeper into the $80,000 range.
Bullish Scenario
The bullish scenario requires a convincing reclaim of both the trendline and the 4-hour bearish FVG above it. If BTC manages to close above this cluster and then successfully retest it as new support, market sentiment would shift back in favor of the bulls. In that case, BTC would likely revisit the recent highs near the major resistance zone. This BTC technical analysis therefore emphasizes that the reaction around the converging trendline and FVG will be decisive for the next larger move.
Conclusion
BTC is currently at an important crossroads between a still-holding bullish 4-hour FVG around $85,500 and a critical 4-hour bearish FVG at the broken trendline. A rejection at the upper levels increases the probability of further downside, while a clear reclaim of both the trendline and the FVG would open the door for a retest of the highs.

Bitcoin Hits Critical Support — Is Another Dump Coming?As I expected in the previous idea , Bitcoin has broken through its support lines and declined to the support zone($86,300-$85,140), reaching its full target in the process.
Currently, Bitcoin( BINANCE:BTCUSDT ) is moving near the support zone($86,300-$85,140), and we need to watch whether it will break through this support or begin to rebound.
Before diving into the analysis, it’s important to note that Bitcoin has a strong correlation with the S&P 500 index( SP:SPX ). Given that the S&P 500 is currently in a downward trend, it’s likely that Bitcoin will also experience further declines.
From an Elliott Wave perspective, it seems that Bitcoin is currently starting a new five-wave downward sequence following the break of its support lines, which could lead to even lower levels.
Looking at recent developments, one reason for Bitcoin’s decline is the selling pressure from long-term holders, which has created a quiet but significant downward pressure and challenged the support levels. Additionally, the state of the U.S. markets, with the S&P 500 index also trending down, contributes to the downward pressure on Bitcoin.
In conclusion, I expect that Bitcoin, upon entering the resistance zone($89,230-$87,720) and touching the resistance lines, will again face downward movement and aim for the support zone($86,300-$85,140). If it breaks that support zone, we could see it moving towards Cumulative Long Liquidation Leverage($85,300-$83,000).
Cumulative Short Liquidation Leverage: $89,000-$88,500
Cumulative Short Liquidation Leverage: $91,830-$90,000
Cumulative Short Liquidation Leverage: $98,400-$97,000
Note: If Bitcoin breaks below the $83,000 mark with strong momentum, we might expect it to reach even lower levels, potentially down to $80,000.
Do you think Bitcoin can break the support zone($86,300-$85,140)?
First Target: $85,540
Second Target: $84,229
Stop Loss(SL): $90,429(Worst)
Points may shift as the market evolves
💡 Please respect each other's opinions and express agreement or disagreement politely.
📌Bitcoin Analysis (BTCUSDT), 4-hour time frame.
🛑 Always set a Stop Loss(SL) for every position you open.
✅ This is just my idea; I’d love to see your thoughts too!
🔥 If you find it helpful, please BOOST this post and share it with your friends.

BTC/USDT - Demand Holding Strong (18.12.2025)📝 Description🔹 Market Structure WHITEBIT:BTCUSDT
BTC has formed a clear Double Bottom pattern inside a strong demand / support zone, signaling potential trend exhaustion on the downside. Price respected the support zone multiple times
Momentum is attempting to shift from sellers to buyers. This structure favors a bullish reversal if confirmation holds.
📌 Trade Plan 🟢 Bullish above the support zone
Entry Idea: Buy on pullback / breakout confirmation above trendline
🟢 1st Resistance: 91,900 – 92,000
🟢 2nd Resistance / Target: 94,100 – 94,200
#Bitcoin #BTCUSDT #CryptoTrading #DoubleBottom #PriceAction #SupportResistance #CryptoAnalysis #TradingView #Kabhi_TA_Trading
⚠️ Disclaimer
This analysis is for educational purposes only.
Crypto markets are volatile — always use proper risk management and a stop-loss.
❤️ Support the Work👍 Like if you see the reversal💬 Comment: Bullish or Fakeout? 🔁 Share with your crypto friends

Why the Market Loves to Trap Traders!!!If trading ever feels personal, it’s not.
The market isn’t hunting you; it’s hunting liquidity.
Understanding this single idea changes how you read charts forever.
1️⃣ The Market Moves Toward Liquidity, Not Logic
Most traders expect price to move because a pattern is “complete” or a level is “perfect.”
In reality, price moves to where orders are sitting.
Where is liquidity usually found?
- Above obvious highs
- Below obvious lows
- Around round numbers
- Near breakout levels everyone is watching
The market goes where the orders are, not where traders hope it goes.
2️⃣ Breakouts Are the Most Common Liquidity Pools
When price approaches a clear resistance, traders place:
- breakout buys above
- stop-losses from shorts just above
That creates a liquidity magnet.
Price spikes above the level, fills those orders…
and often reverses sharply once liquidity is consumed.
That’s not manipulation... that’s mechanics.
3️⃣ Traps Reveal Who’s Really in Control
A trap happens when price:
- breaks a key level
- fails to follow through
- returns back inside the range
This tells you something critical:
➡️ The side that should have won… didn’t.
4️⃣ Professionals Don’t Chase; They Wait
Retail traders react to the breakout.
Professionals wait for the reaction after the breakout.
They ask:
- Did price accept above the level?
- Did momentum expand or fade?
- Did structure shift or snap back?
Patience turns traps into opportunities.
📚The Core Lesson
The market’s job is not to reward anticipation. It’s to test conviction.
Once you stop trading where everyone else enters and start observing who gets trapped,
price action becomes clearer, calmer, and more logical.
⚠️ Disclaimer: This is not financial advice. Always do your own research and manage risk properly.
📚 Stick to your trading plan regarding entries, risk, and management.
Good luck! 🍀
All Strategies Are Good; If Managed Properly!
~Richard Nasr
Bitcoin Pullback to Resistance — Next Drop Loading?As I expected , Bitcoin( BINANCE:BTCUSDT ) has begun its decline from the resistance zone($94,850-$93,000) and has reached its target.
Currently, Bitcoin is moving near the resistance zone($90,900-$90,100), the Cumulative Short Liquidation Leverage($91,840-$90,110), and other resistance lines.
From an Elliott Wave perspective, it appears that Bitcoin has completed its five-wave downward sequence and is now in the process of forming the corrective waves upward, likely within the resistance zone($90,900-$90,100).
Moreover, since the USDT.D% ( CRYPTOCAP:USDT.D ) has successfully broken the upper line of its falling wedge pattern, we can anticipate further increases in USDT.D%, which could put additional downward pressure on Bitcoin.
Additionally, considering that the S&P 500 index( SP:SPX ) is likely to resume a bearish trend, and given Bitcoin’s correlation with the SPX, a further decline in Bitcoin is not unexpected.
In conclusion, based on the above analysis, I expect that Bitcoin will at least test the support lines and, if those are broken, it may continue to decline toward the Cumulative Long Liquidation Leverage($87,000-$85,663). If the momentum of breaking these support lines is strong, we can expect even more significant downward movement.
Do you think Bitcoin can go below $87,000?
First Target: Support lines
Second Target: Cumulative Long Liquidation Leverage($87,000-$85,663)
Stop Loss(SL): $92,000(Worst)
Points may shift as the market evolves
💡 Please respect each other's opinions and express agreement or disagreement politely.
📌Bitcoin Analysis (BTCUSDT), 1-hour time frame.
🛑 Always set a Stop Loss(SL) for every position you open.
✅ This is just my idea; I’d love to see your thoughts too!
🔥 If you find it helpful, please BOOST this post and share it with your friends.

Why the Reaction Matters More Than the Level!!!Most traders spend their time hunting for the perfect level.✖️
Support. Resistance. Demand. Supply.
They draw the zone… and assume price must react.
But professionals know something crucial:
The level itself is not the edge.
The reaction is.
Here’s why.
1️⃣ Levels Are Common Knowledge
Everyone sees the same support.
Everyone sees the same resistance.
If levels alone were enough, everyone would be profitable.
A level is just a location.📍
It doesn’t tell you who is in control.
2️⃣The Reaction Reveals Intent
What matters is how price behaves at the level.
Ask yourself:
- Does price reject immediately or hesitate?
- Are candles impulsive or overlapping?
- Does price leave the level with strength or drift away slowly?
A strong reaction tells you:
➡️ One side stepped in aggressively.
A weak reaction tells you:
➡️ The level exists… but conviction doesn’t.
3️⃣ Clean Rejections Beat Perfect Levels
A slightly imperfect level with a violent reaction
is far more valuable than a textbook level with no follow-through.
Professionals wait for:
- sharp rejections
- momentum expansion
- structure confirmation
They don’t assume... they observe.
4️⃣ Failed Reactions Are Warnings
When price reaches a level and does nothing…
that silence is information.
Failed reactions often lead to:
- level breaks
- deeper moves
- trend continuation
The market is telling you:
➡️ “This level no longer matters.”
📚The Big Lesson
Levels tell you where to look.
Reactions tell you what to do.
If you shift your focus from drawing levels to reading behavior at levels,
your trading instantly becomes clearer and more objective.
⚠️ Disclaimer: This is not financial advice. Always do your own research and manage risk properly.
📚 Stick to your trading plan regarding entries, risk, and management.
Good luck! 🍀
All Strategies Are Good; If Managed Properly!
~Richard Nasr
Market Phases Explained: Accumulation, Expansion, Distribution🔵 Market Phases Explained: Accumulation, Expansion, Distribution, Reset
Difficulty: 🐳🐳🐳🐳🐋 (Advanced)
Markets do not move randomly. They rotate through repeatable phases driven by liquidity, psychology, and participation. Understanding market phases helps traders stop forcing strategies and start trading in alignment with the current environment.
🔵 WHY MARKET PHASES MATTER
Most traders struggle not because their strategy is bad, but because they apply it in the wrong market phase.
Breakout strategies fail in accumulation
Mean-reversion fails during expansion
Trend-following fails in distribution
Reversal trading fails before reset is complete
Market phases explain when a strategy works, not just how .
Price action, indicators, and volume behave differently in each phase.
🔵 THE FOUR MARKET PHASES
Markets move in a repeating cycle:
Accumulation
Expansion
Distribution
Reset
Each phase has unique characteristics, risks, and opportunities.
🔵 1. ACCUMULATION (QUIET POSITIONING)
Accumulation occurs after a decline or prolonged sideways movement.
This is where smart money builds positions quietly.
Key characteristics:
Price moves sideways in a range
Volatility is low
Breakouts frequently fail
Volume is stable or slightly rising
What is really happening:
Large players accumulate positions without moving price too much. Liquidity is absorbed.
Indicator behavior:
RSI oscillates between 40 and 60
MACD hovers near the zero line
Volume spikes are quickly absorbed
Best strategies:
Range trading
Mean reversion
Patience and preparation
🔵 2. EXPANSION (TREND DEVELOPMENT)
Expansion begins when price breaks out of accumulation with conviction.
This is where trends are born.
Key characteristics:
Strong directional movement
Increasing volatility
Pullbacks are shallow
Breakouts follow through
What is really happening:
Accumulated positions are now leveraged. Momentum attracts participation.
Indicator behavior:
RSI holds trend zones (40–80 or 20–60)
MACD expands away from zero
Volume increases during impulse moves
Best strategies:
Trend-following
Pullback entries
Breakout continuation
🔵 3. DISTRIBUTION (QUIET EXITING)
Distribution occurs after an extended trend.
Price may still rise, but momentum starts to weaken.
Key characteristics:
Higher highs with weaker follow-through
Increased wicks and failed breakouts
Volatility becomes unstable
Late buyers get trapped
What is really happening:
Smart money distributes positions to late participants while maintaining the illusion of strength.
Indicator behavior:
RSI diverges or fails to make new highs
MACD histogram shows lower highs above zero
Volume spikes near highs
Best strategies:
Profit protection
Reduced position size
Waiting for confirmation of weakness
🔵 4. RESET (LIQUIDITY CLEARING)
Reset is when the previous trend fully unwinds.
This phase clears excess leverage and weak hands.
Key characteristics:
Sharp moves against prior trend
Stop-loss cascades
Emotional price action
High volatility without clear direction
What is really happening:
Leverage is flushed. Weak positions are forced out.
Indicator behavior:
RSI reaches extreme levels
MACD crosses zero decisively
Volume spikes dramatically
Best strategies:
Capital preservation
Waiting for stabilization
Avoiding prediction
🔵 HOW TO IDENTIFY THE CURRENT PHASE
Ask these questions:
Is price trending or ranging?
Are breakouts succeeding or failing?
Is momentum expanding or contracting?
Are indicators confirming or diverging?
No indicator works in all phases. Phase identification is the real edge.
🔵 COMMON MISTAKES
Forcing trend strategies during accumulation
Chasing breakouts during distribution
Trading reversals before reset completes
Ignoring momentum deterioration
Most losses come from being right about direction but wrong about phase.
🔵 CONCLUSION
Markets move in cycles because human behavior and liquidity move in cycles.
Accumulation builds positions
Expansion rewards patience
Distribution traps late entries
Reset clears the board
When you learn to identify market phases, you stop fighting the market and start working with it.
Which market phase do you find hardest to trade? Accumulation, expansion, distribution, or reset? Share your thoughts below.

Bitcoin (BTCUSDT): Double Top Confirms Short-Term Bearish ShiftHi
Market Structure:
BTC formed a clear double top, signaling exhaustion near recent highs. This structure marked a shift from bullish momentum to short-term bearish control. Following the rejection, price began making lower highs and lower lows, confirming a local downtrend.
Trend & Price Action:
Price is currently trading below a descending trendline, acting as dynamic resistance. Each attempt to move higher has been capped, reinforcing bearish pressure. The recent pullback toward the trendline appears corrective rather than impulsive.
Key Levels:
Resistance Zone: 88,800 – 89,100
Current Price Area: ~86,900
Major Support / Target: 83,500 – 83,000 (demand zone)
Outlook & Strategy:
As long as price remains below the descending trendline, downside continuation toward 83.5k remains the higher-probability scenario. A confirmed breakout above resistance would be required to invalidate the bearish bias.

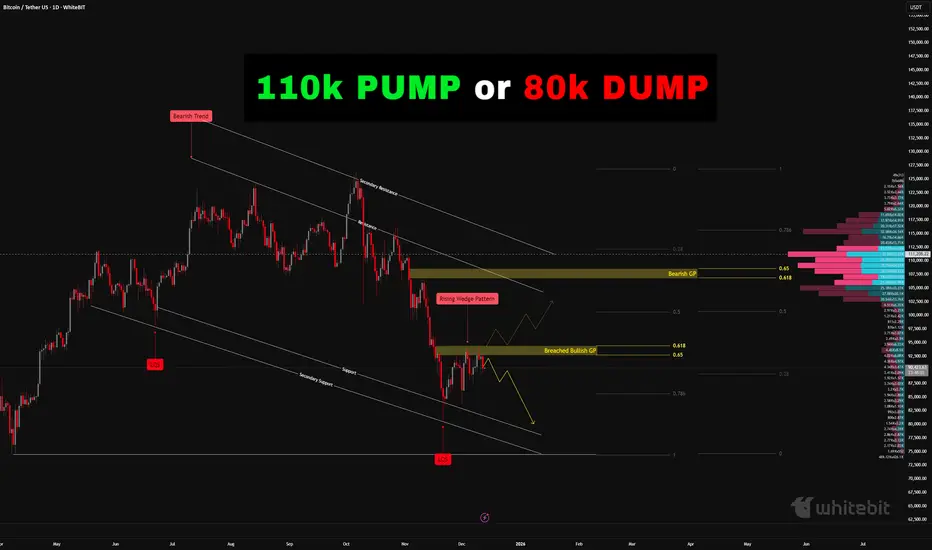
Bitcoin Market Assessment - 110k or 80k incoming?Bitcoin Market Assessment – WhiteBit Chart & Exchange (Daily Time Frame)
Welcome back everyone.
Today we will be evaluating Bitcoin using the WhiteBit chart on the daily time frame.
Market Overview
Bitcoin recently surged to 126k, sweeping liquidity at the highs. Shortly after, the market sold off aggressively partly amplified by tariff news—which reinforced the upper resistance zone and caused price to break back below it.
Price continued to decline sharply, reaching 80.3k, where millions in positions were liquidated.
Current Technical Structure
1. Breached Bullish Golden Pocket
Price has broken below the bullish Golden Pocket (0.618–0.65).
Once breached, this zone typically flips into resistance, which is what we’re seeing now.
2. Rising Wedge on the 4H
On the 4-hour chart, price is forming a rising wedge, a pattern that often precedes continuation to the downside.
This wedge aligns directly with the breached Golden Pocket, forming a strong confluence of resistance.
3. Trend Context
Price action is still within a high-time-frame bearish trend, and the recent push upward appears to be a standard bearish pullback rather than a shift in structure.
These combined factors suggest the possibility of a deeper move down.
Downside Levels of Interest
0.786 Fibonacci Retracement (~85.6k)
Next discount zone and logical target if the bearish structure continues.
80k Psychological Level
A major high-volume and psychological area. If 85.6k breaks, a retest of 80k becomes probable.
Bears are clearly targeting this zone.
Volume Profile Insight
Using the anchored volume tool, a significant cluster of volume sits around 111k—just above the key 110k level and very near the bearish Golden Pocket (0.618–0.65).
This area has not yet been retested.
On higher time frames, the bearish Golden Pocket often acts as the ideal retracement zone before price continues lower. This creates a compelling upside target if the bearish scenario invalidates.
Market Tone
Momentum remains weak on the bullish side, with sellers maintaining control.
As long as price remains below the breached Golden Pocket, the market structure continues to favor the downside.
Scenario Summary
Bullish Scenario
Price breaks above and closes above the breached bullish Golden Pocket (0.618–0.65 zone).
Sustained strength above this level opens the door for:
- 110k retest, aligning with major volume at 111k
- Potential wick or extension into the bearish Golden Pocket
This would temporarily invalidate short-term bearish momentum.
Bearish Scenario (Primary)
Breached Golden Pocket continues acting as strong resistance.
Rising wedge breaks down.
Price targets:
- 0.786 Fib at 85.6k
- 80k psychological level if 85.6k fails
- Overall bearish trend remains intact, with bulls showing weakening momentum.
Thank you all so much for reading.
BTC has made a lot of reactions take place this year, from record breaking highs to record breaking liquidations of 19 Billion in just a few hours!
It is important to be cautious, risk only what you can afford to lose and ensure you take on proper risk management.
Make sure to follow and comment below what you think! If you would like any guides, or assessments of specific crypto currencies done, let me know!
BTCUSDTHello Traders! 👋
What are your thoughts on Bitcoin?
Bitcoin has entered a corrective phase after a strong bearish move and is currently ranging between a clearly defined support and resistance zone. As long as price remains inside this range, no major directional move is expected.
At the moment, price is expected to move toward the upper boundary of the range. Once this area is reached, price behavior should be closely monitored for confirmation.
Bullish case:
If price breaks and holds above the range high, the next upside targets marked on the chart will come into play.
Bearish case:
If price gets rejected from the range high and the lower boundary of the range is broken, bearish continuation is likely, with the next downside target around 73,000.
⚠️ Until a clear breakout occurs, the market remains in a consolidation phase
Please Don’t forget to like and share your thoughts in the comments! ❤️

BTC - Shakeout Complete… Is the Trap Set???Bitcoin just delivered a classic manipulation move into the higher-timeframe demand zone❗️ The sharp sell-off below structure flushed late longs and triggered stops, only to be quickly reclaimed.
That’s not weakness. That’s intent.
📉📈From a structural perspective , this demand zone has already proven itself before. Price reacted strongly from it in the past, and once again, buyers stepped in aggressively after the sweep. This suggests the downside move was more about liquidity than genuine trend reversal.
⁉️ Now comes the key question.
⚔️As long as BTC holds above this demand and continues to build acceptance, the focus shifts to a recovery move back into the prior structure and supply zone above. That area will be the real test, whether this bounce is just a correction, or the start of a larger continuation.
For now, patience is key. Let price show its hand near demand before committing.
Is this the reset before the next leg higher, or just a temporary relief bounce? 🤔
⚠️ Disclaimer: This is not financial advice. Always do your own research and manage risk properly.
📚 Stick to your trading plan regarding entries, risk, and management.
Good luck! 🍀
All Strategies Are Good; If Managed Properly!
~Richard Nasr

The Real Bitcoin Bottom: It’s in the Power BillThe Cost of Mining 1 BTC – Autumn 2025 Deep Dive
First of all, I want to say that I already made a similar publication in 2020 about the cost of Bitcoin, and we reached these levels (the chart is below).
Introduction: The Bitcoin mining industry in Autumn 2025 stands at a crossroads. Network difficulty has soared to all-time highs, squeezing miner profit margins as hashpower races ahead of price. The hashprice – the daily revenue per unit of hashing power – has slumped to record lows around $54 per PH/s-day (down from ~$70 a year ago). Analysts expect this metric to languish between $50 and $32 until the next halving in 2028, underscoring how challenging the economics have become. In this environment, understanding the cost to mine 1 Bitcoin is more crucial than ever. Below, we present a detailed comparison of popular ASIC miners and analyze which rigs remain profitable (or not) at current prices. We’ll also explore how the cost of production acts like a magnetic price level for BTC – often drawing the market down to this “floor” before a rebound – and what that means for investors now.
Cost to Mine 1 BTC by ASIC Miner Model (at $0.03–$0.10/kWh)
To quantify Bitcoin’s production cost, we compare leading ASIC miners from Bitmain, MicroBT, Canaan, Bitdeer, and Block. Table 1 below shows key specs and the estimated cost to mine one BTC under different electricity prices (from very cheap $0.03/kWh to pricey $0.10/kWh):
Key Takeaways:
Electricity price is the dominant factor in mining cost. At an ultra-cheap $0.03/kWh (possible in regions with subsidized power or stranded energy), even older-generation miners can produce BTC for well under $30k per coin. In our table, all models have a cost per BTC between ~$21k and $27k at $0.03/kWh – a fraction of Bitcoin’s current ~$90k–$95k market price.
At a mid-tier rate of $0.05/kWh (typical for industrial miners in energy-rich areas), the top machines still show healthy margins. Bitmain’s flagship S21 XP leads with roughly $36k cost per BTC, while other new-gen rigs fall in the ~$39k–$45k range. These figures imply profit margins of 50–60% for efficient miners at $0.05 power.
At a pricey $0.10/kWh (common for retail electricity or high-tariff regions), mining costs skyrocket. Only the very latest ASIC (S21 XP) stays comfortably below the current BTC price, at around $72k per coin. Most other models hover in the $78k–$90k range, meaning their operators are earning little to no profit at spot prices. In fact, at $0.10/kWh, a miner like the Avalon A15 Pro would spend about $89k to generate one BTC – essentially breakeven with Bitcoin at ~$90k. This illustrates why high-power-cost miners struggle or shut off during downturns.
Profitable vs. Unprofitable: Current Market Reality
Which miners are still profitable at today’s rates? Given Bitcoin’s price in the low $90,000s and typical industrial electricity around $0.05–$0.07/kWh, the newest generation ASICs remain comfortably profitable, while older, less efficient models are on the edge. For example:
Latest-gen winners: The Bitmain S21 XP – with industry-best ~13.5 J/TH efficiency – can mine a coin for roughly $36k at $0.05/kWh, leaving a huge cushion against price. Even at $0.07/kWh (a common hosting rate), its cost per BTC would be on the order of ~$50k, still well below market price. Other 2024–2025 flagship units (Whatsminer M60S++, Bitdeer A2 Pro, Block’s Proto) likewise have breakeven power costs around $0.12–0.13/kWh; they remain viable in most regions except the very expensive ones.
Older-gen on the brink: By contrast, an earlier-gen workhorse like the Antminer S19 XP ( ~21.5 J/TH) or similarly efficient rigs from 2021–2022 generation become marginal at moderate power rates. An S19 XP mining at $0.08/kWh sees its cost per BTC climb to roughly ~$94k (near current price), and at $0.10 it exceeds $110k (mining at a loss). Many such units are only profitable in locales with <$0.05 power. This is why we’ve seen miners with older fleets either upgrade or retire hardware as the margin for profitability narrows.
The efficiency gap: The spread between best-in-class and older miners translates directly into survivability. A miner burning 30–40 J/TH can only stay online if they have extremely cheap electricity or if BTC’s price is far above average production cost. As of Q4 2025, Bitcoin’s price is indeed high, but so is the network difficulty – meaning inefficient gear yields so little BTC that electricity costs outweigh revenue in many cases.
According to one industry report, the cost of mining 1 BTC varies widely across companies – from as low as ~$14.4k for those with exceptional power contracts (e.g. TeraWulf’s U.S. facilities) to as high as ~$65.9k for others like Riot Platforms, even before accounting for overhead. (Riot’s effective cost was brought down to ~$49.5k after cost-cutting measures.) This huge range shows how electricity pricing and efficiency determine which miners thrive. In early 2025, the situation became so extreme that CoinShares analysts found the average all-in production cost for public mining companies spiked to ~$82,000 per coin – nearly double the prior quarter (post-halving impact) – and up to $137,000 for smaller operators
ixbt.com
. At that time Bitcoin was trading around $94k, meaning many miners, especially smaller ones, were underwater and operating at a loss. In high-cost regions like Germany, the breakeven cost even hit an absurd ~$200k per BTC, making mining there utterly unviable.
Bottom line: At current prices, only miners with efficient rigs and reasonably cheap power are making money. Those with older equipment or expensive electricity have minimal margins or are already in the red. This dynamic naturally leads to miners shutting off machines that don’t profit, which in turn caps the network hashrate growth until either price rises or difficulty drops. It’s a self-correcting mechanism – one that ties directly into Bitcoin’s production cost acting as a market floor.
Production Cost as Bitcoin’s “Magnetic” Price Level
There’s a saying in the mining community: “Bitcoin’s price gravitates toward its cost of production.” In practice, the production cost often behaves like a magnet and a floor for the market. When the spot price climbs far above the cost to mine, it invites more hashing power (and new investment in miners) until rising difficulty pulls costs up. Conversely, if price falls below the average production cost, miners start to capitulate – selling coins and shutting rigs – until the difficulty eases and the market finds a bottom. This push-pull keeps price and cost loosely tethered over the long run.
Notably, JPMorgan’s research this cycle highlighted that Bitcoin’s all-in production cost (now around ~$94,000) has “empirically acted as a floor for Bitcoin” in past cycles. In other words, the market has rarely traded for long below the prevailing cost to mine, because at that point fundamental supply dynamics kick in. As of late 2025, they estimate the spot price is hovering just barely above 1.0 times the cost (~1.03x) – near the lowest end of its historical range. This implies miners’ operating margins are razor-thin right now, and any extended move significantly below ~$94k would likely trigger miner capitulation and supply contraction. In plainer terms: downside from here is naturally limited – not by hope or hype, but by the economics of mining. If BTC dropped well under the cost floor, many miners would simply turn off machines rather than mine at a loss, removing sell pressure and helping put in a price bottom.
History supports this magnetic pull. In previous bear markets, Bitcoin has tended to retest its production cost during the worst of capitulations. For example, during the late-2018 crash and again in the 2022 downturn, BTC prices plunged to levels that put numerous miners out of business. But those phases were short-lived. Prices found support once enough miners quit and difficulty adjusted downward, allowing the survivors to breathe. The market “wants” to stay near the cost of production, as that is a sustainable equilibrium where miners neither drop like flies nor earn excessive profits. Whenever price strays too high above cost, it usually invites a surge in competition (hashrate) that raises the cost floor; when price sinks too low, hashpower falls until cost drops to meet price. It’s an elegant economic dance built into Bitcoin’s design.
Why Price Often Meets Cost Before Rebounding
If Bitcoin production cost is a de facto floor, why do we often see price fall all the way down to it (or even briefly below it) before the next big rally? The answer lies in miner psychology and market cyclicality:
Miner Capitulation & Shakeouts: Markets are cruel to the over-leveraged and inefficient. During bull runs, miners expand operations, often taking on debt or high operating costs under the assumption of continually high prices. When the cycle turns, Bitcoin’s price can free-fall toward the cost of production, erasing margins. The weakest miners (highest costs or debt loads) capitulate first – selling off their BTC reserves and unplugging hardware. This wave of forced selling can push price right to (or slightly under) the cost floor, marking a final “shakeout” of excess. Only when the weakest hands are flushed does the market rebound. It’s no coincidence that major bottoms often align with news of miner bankruptcies or mass liquidations.
The Iron Law of Hashrate: Miners are competitive and will run at breakeven or even slight loss for some time, hoping for recovery, rather than quit immediately. This means the network can temporarily operate above sustainable difficulty levels. Eventually, however, reality sets in. When enough miners can’t pay the bills, hashrate plateaus or drops, halting difficulty growth or causing it to decline. At that inflection point, the cost of mining stabilizes (or falls), giving relief to the remaining miners. The stage is set for price to rebound off the now-lower equilibrium. In essence, Bitcoin often has to tag its production cost to force a network reset and purge imprudent operators. Only after that cleansing can a fresh uptrend begin with a healthier foundation.
Investor Sentiment at the Floor: From a contrarian market perspective, a convergence of price and production cost typically corresponds with maximum pessimism. If Bitcoin is trading at or below what it “should” cost to make, it signals extreme undervaluation to savvy investors. In late 2022, for instance, estimates of BTC’s cost basis in the $18k–$20k range coincided with the market trading in the mid-$15k’s – a level where miners were going bankrupt and sentiment was in the gutter. Yet those willing to be greedy when miners were fearful reaped the rewards when price recovered. The same pattern could be unfolding now in late 2025: the public is fearful of Bitcoin’s recent pullback, but its cost floor (~$94k) suggests fundamental value support. Smart money knows that when price meets cost, downside is limited and upside potential grows.
Conclusion – Steeling Ourselves at the Cost Floor
In EXCAVO’s signature fashion, let’s cut through the noise: Bitcoin’s production cost is the line in the sand – the magnetized level where price and reality meet. As of Autumn 2025, that line hovers in the mid-$90,000s, and Bitcoin has indeed been gravitating here. The data shows miners barely breaking even on average. This is a make-or-break moment. If you’re bullish because everyone else is, check your thesis – the real reason to be bullish is that BTC is scraping its cost floor, a level from which it has historically sprung back with vengeance. Conversely, if you’re panicking out of positions now, remember that you’re selling into the teeth of fundamental support. The market loves to punish latecomers who buy high and sell low.
Yes, the mining industry is under stress; yes, the headlines scream fear. But those very pressures are what forge the next bull run. Every miner that shuts off today is one less source of sell pressure tomorrow. Every uptick in efficiency raises the floor that much higher, like a coiled spring tightening. Bitcoin has been here before – when production cost and price locked jaws in late 2022, and again in early 2025 post-halving. Each time, the doom and gloom was followed by a dramatic recovery as the imbalances corrected.
Our contrarian take: The cost of mining 1 BTC isn’t just a number on a spreadsheet – it’s the secret pulse of the market. Right now it’s telling us that the bottom is in or very near. Prices might chop around this magnet a bit longer, even dip slightly below in a final fake-out, but odds of a deep crash under the ~$94k cost basis are slim. The longer Bitcoin grinds at or below miners’ breakeven, the more hashpower will fall off, quietly tightening supply. When the spring releases, the next upward leg could be explosive (as even mainstream analysts like JPMorgan are eyeing ~$170k targets).
In summary, Bitcoin tends to revisit its production cost for one last test – and when it holds, it launches. Autumn 2025 appears to be giving us that test. The savvy, data-driven operator will view this not with panic, but with patience and resolve. After all, if you can accumulate Bitcoin near its intrinsic mining value while the herd is fearful, you position yourself on the right side of the trade once the inevitable rebound kicks in. As the saying goes, bears win, bulls win, but miners (and hodlers) who understand the cost dynamics win big in the end. Brace yourself, stay analytical, and remember: Bitcoin’s true floor is built in watts and hashes, and it’s solid as steel.
Best regards EXCAVO

Risk Management Is Not Protection... It’s Your Edge!!!Most traders treat risk management like a seatbelt.
Something you use just in case.
🧳Professionals treat risk management as their main edge.
Because in trading, you don’t get paid for being right...
you get paid for staying in the game long enough for probabilities to work.
1️⃣ Risk Is Defined Before the Trade Exists
Before you think about entries or targets, one question must already be answered:
Where am I wrong?
If you don’t know where your idea fails,
you’re not managing risk... you’re hoping.
Professionals define risk first.
The trade only exists after invalidation is clear.
2️⃣ Small Risk Creates Big Freedom
When risk is small and predefined:
- hesitation disappears
- emotions calm down
- execution improves
Why?
Because no single trade matters anymore.
You stop needing trades to work, and that’s when trading becomes objective.
3️⃣ Risk Management Turns Losses Into Data
Losses are unavoidable.
Damage is optional.
A controlled loss is not a failure; it’s information.
Every loss tells you:
- the market condition wasn’t right
- the timing was early
- or the structure changed
When risk is managed, losses educate instead of punish.
4️⃣ Consistency Is Built on Risk, Not Wins
Winning streaks feel good.
They don’t build careers.
Surviving losing streaks does.
Proper risk management ensures:
- drawdowns stay shallow
- confidence stays intact
- discipline stays repeatable
That’s how traders last long enough to improve.
💡The Real Truth
You don’t need a better strategy.
You need better control over downside.
Risk management is what allows:
- imperfect strategies to work
- average win rates to grow accounts
- traders to evolve instead of quit
⚠️ Disclaimer: This is not financial advice. Always do your own research and manage risk properly.
📚 Stick to your trading plan regarding entries, risk, and management.
Good luck! 🍀
All Strategies Are Good; If Managed Properly!
~Richard Nasr

BTC – Weak Rebound Below EMAs, Bias Still Toward CorrectionHello everyone, Domic here.
Looking at BTC on the H4 timeframe right now, the overall feeling is not panic — but there is certainly nothing reassuring either. Price is trading around 85,700 USD, sitting firmly below both the EMA34 and EMA89, and that alone already says a lot about the current market condition.
Since mid-month, a lower high – lower low structure has become fairly clear. The rebound we are seeing at the moment is essentially just a technical pullback after the prior sharp sell-off, as price attempts to climb back up and retest resistance. However, BTC has still failed to reclaim the EMA34, which shows that buying pressure is not strong enough to regain short-term control. At this stage, EMA34 acts as an overhead pressure ceiling, while EMA89 remains the key boundary defining the H4 trend. As long as price stays below both of these moving averages, the market should still be viewed from a defensive perspective.
On the macro and news side, BTC is not being driven by any crypto-specific shock, but rather by broader macro conditions and the risk-on / risk-off environment. The Fed continues to signal higher rates for longer, making it difficult for risk assets to attract fresh inflows. US Treasury yields remain elevated, pushing short-term capital toward the USD and bonds instead of crypto. US equities are undergoing a mild correction, and BTC, at this stage, is still moving quite in sync with the broader risk asset complex. In addition, inflows into spot Bitcoin ETFs have cooled significantly compared to the earlier surge, further weakening the price support.
From my perspective, as long as BTC remains below the EMA34, any upward move should still be treated as a rebound into resistance. And while price stays below the EMA89, the H4 trend remains in a corrective state.

BTCUSDTHello Traders! 👋
What are your thoughts on BITCOIN?
Bitcoin is currently consolidating within a well-defined range between $88,000 and $95,000, while continuing to trade inside an ascending channel.
The lower boundary of this ascending channel aligns closely with the $88,000 support zone, adding confluence and strengthening this area as a key demand region. At the moment, price action is hovering near the channel support, suggesting that selling pressure is weakening.
As long as the price holds above the $88,000 support, we expect some short-term consolidation followed by a bullish push toward the upper range at $95,000.
A clean breakout above $95,000 could open the door for a continuation move toward the upper boundary of the ascending channel, which would act as the next upside target.
A sustained break below the channel support would invalidate this scenario.
Don’t forget to like and share your thoughts in the comments! ❤️

BTCUSDT: Sellers Defend Resistance - Support Zone at $85,200Hello everyone, here is my breakdown of the current BTCUSDT setup.
Market Analysis
BTCUSDT previously moved inside a clear downward channel, confirming strong bearish pressure. After reaching the lower boundary, price produced a temporary bounce and broke above the channel, but this move failed to develop into a sustainable bullish trend. Instead, BTC entered a consolidation range below the key 88,000 Resistance Zone, showing clear hesitation from buyers. Following the range formation, price developed a descending triangle structure, with lower highs forming along the Triangle Resistance Line and support being tested near the 85,200 Support Zone. Multiple fake breakouts above resistance and below support indicate liquidity grabs rather than true reversals. Recent price action shows rejection from the Resistance Zone and a failure to reclaim the upper range, suggesting seller dominance is returning.
Currently, BTCUSDT is trading below the 88,000 Resistance Zone and remains capped under the Triangle Resistance Line, keeping bearish pressure intact.
My Scenario & Strategy
My scenario is short-biased as long as BTCUSDT stays below the 88,000 Resistance Zone and the Triangle Resistance Line. I expect price to continue drifting lower toward the Triangle Support Line, with a primary target at the 85,200 Support Zone. A confirmed breakdown below this support would signal continuation of the bearish trend and open the path for deeper downside.
However, if price instead breaks and holds above 88,000 with strong momentum, the short scenario would be invalidated. Until that happens, rallies into resistance are viewed as selling opportunities.
That’s the setup I’m watching. Trade carefully and always manage your risk.

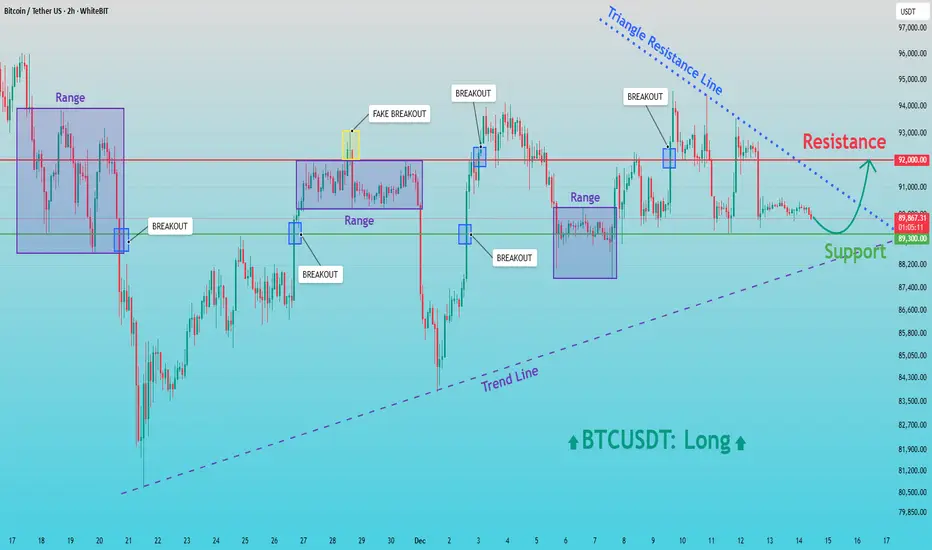
BTCUSD: Buyers in Control - Resistance Retest AheadHello everyone, here is my breakdown of the current BTCUSDT setup.
Market Analysis
BTCUSDT is currently trading within a broadly bullish structure, supported by a rising trend line that has been respected after the major sell-off and subsequent recovery. Following the strong decline, price formed a base near the lower levels and initiated a reversal, creating higher lows and shifting market control back to buyers. After the initial rebound, Bitcoin entered multiple Range phases, where price consolidated and built liquidity. Each range was followed by a breakout, confirming sustained buying interest. Some of these moves included fake breakouts, which briefly trapped participants before price continued to respect the broader bullish structure.
Currently, BTCUSDT is holding above the key Support Zone around 89,300, which has repeatedly acted as a demand area. Price is also compressing under a descending Triangle Resistance Line, while the rising trend line continues to support the market from below. This creates a tightening structure, suggesting that a decisive move is approaching. The 92,000 Resistance level remains the main barrier overhead, where sellers have previously stepped in and rejected higher prices.
My Scenario & Strategy
My scenario remains bullish as long as BTCUSDT holds above the 89,300 Support Zone and continues to respect the ascending trend line. I expect buyers to defend this area and gradually build pressure toward the upper resistance. A clean breakout above the 92,000 Resistance, especially with strong momentum, would confirm bullish continuation and open the path for a move toward higher levels, aligned with the broader trend.
However, if price fails to break the triangle resistance and loses the 89,300 Support, a deeper pullback toward the trend line could occur before buyers attempt another recovery. Until such a breakdown happens, the structure favors buyers. For now, the market remains constructive, with support holding and resistance at 92,000 as the key level to watch.
That’s the setup I’m tracking. Thank you for your attention, and always manage your risk.
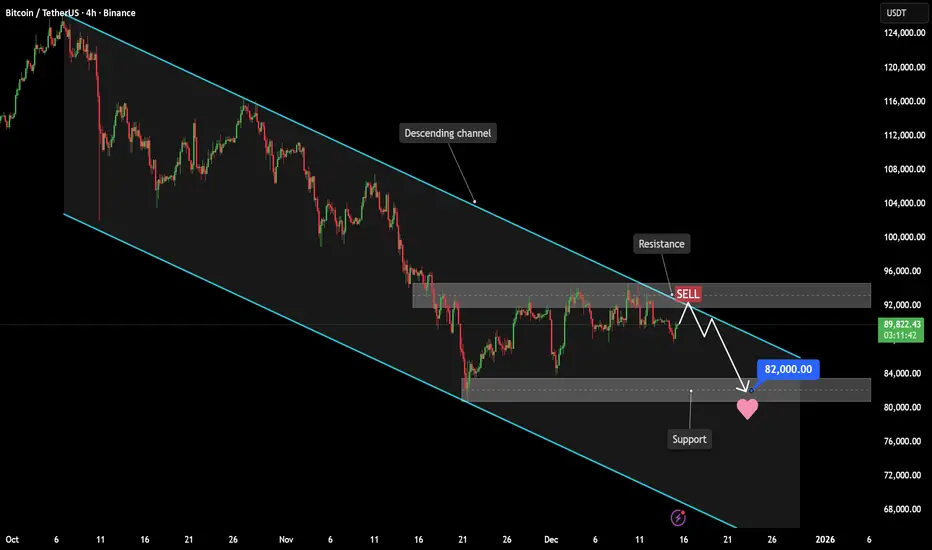
Bitcoin - Downtrend reinforced by technicals and macro sentimentHello everyone,
At the moment, Bitcoin is trading cautiously as capital has yet to decisively return to risk assets. Overall market sentiment remains defensive, with investors continuing to assess macroeconomic conditions and monetary policy. As a result, buying pressure has not been strong enough to reverse the prevailing trend.
From a technical perspective , the H4 chart shows that Bitcoin continues to respect a well-defined descending channel . Market structure remains bearish, with a clear sequence of lower highs and lower lows, confirming that selling pressure is still dominant. Recent rebounds have been purely technical in nature and have repeatedly been rejected near the upper boundary of the channel, signaling that buyers lack control.
Notably, the 92,000–94,000 USD area is acting as a key resistance zone. This region aligns with the upper boundary of the descending channel and a prior distribution area, where price has been rejected multiple times. In the current context, each failed attempt to close decisively above this zone reinforces the view that it is a trend-aligned SELL area , rather than a bullish reversal signal.
On the news front , the crypto market continues to be influenced by a broader risk-off environment, with capital favoring safety and liquidity. The absence of strong positive catalysts makes it difficult for Bitcoin to sustain a meaningful breakout. This cautious investor behavior effectively supports the existing bearish structure, as weak and hesitant demand often allows downtrends to persist.
On the downside, the 80,000–82,000 USD region stands out as an important support area. While price has reacted from this zone in the past, within a broader downtrend it should be viewed primarily as a potential profit-taking target , not a safe BUY zone. Attempting to catch the bottom before the bearish structure is broken carries elevated risk and does not align with disciplined trading.
Overall, both technical structure and the current news backdrop point toward a bearish continuation scenario . Until there is a clear shift in market structure or a meaningful improvement in capital flows, the most rational approach remains to sell rallies in line with the trend , rather than trying to predict a bottom.
In conclusion , Bitcoin remains in a controlled downtrend. Only a decisive break above the descending channel, supported by a more favorable news environment, would justify considering a trend reversal. Until then, patience, discipline, and respect for the dominant trend are essential for capital protection and consistent performance.
Wishing you clear judgment, strong risk management, and disciplined trading in line with the primary trend.