Bitcoin - Sell this upcoming pump! New Bear Flag - Target 74k!I am currently bullish on Bitcoin in the short term, and I believe Bitcoin will hit 96k, probably this week. The current price is around 91k, so this is definitely a good opportunity to sell or open a short position at 96k on futures because later this month/in January Bitcoin will most likely continue in a downtrend and hit 74k!
74k (74,508) is a significant swing low from April 2024. There is no doubt that a lot of retail traders have their stop losses placed exactly below this swing low. This acts like a strong magnet for huge institutions, hedge funds, and big banks (market makers). It's no longer a secret that Bitcoin's development and Bitcoin's price are completely controlled by these lizards. But let's take a look at the short-term prediction.
What we can see on the daily chart or on the 12h chart is a bear flag formation. This bear flag is so nice and almost textbook perfect! Inside the bear flag we have a WXY corrective pattern (3x ABC or 3x WXY). I think that this is a strong indication that the downtrend we see from the all-time high (126k) will likely continue in the next weeks.
Write a comment with your altcoin + hit the like button, and I will make an analysis for you in response. Trading is not hard if you have a good coach! This is not a trade setup, as there is no stop-loss or profit target. I share my trades privately. Thank you, and I wish you successful trades!
Trade ideas

BTC/USDT - Major Rejection from Supply Zone📝 Description 🔹 Setup Overview WHITEBIT:BTCUSDT
BTC/USDT has faced a strong rejection from the upper resistance / supply zone near the recent highs. Price has broken below the rising trendline, signaling a shift in short-term market structure from bullish to bearish. Failure to reclaim the trendline keeps sellers in control.
📌 Trading Plan📉 Bearish Scenario (Primary Bias )
Sell Zone: Below the broken trendline & previous support
Target 1: 89,030 (1st Support)
Target 2: 87,520 (2nd Support – liquidity area)
Confirmation: Weak bullish candles + rejection from trendline retest
#BTCUSDT #BitcoinAnalysis #CryptoTrading #BTC #PriceAction #TechnicalAnalysis #CryptoMarket #TrendlineBreak #TradingView #Kabhi_TA_Trading #SellBTC
⚠️ Disclaimer
This analysis is for educational purposes only.
Crypto markets are highly volatile — always manage risk and use stop-losses.
👍 Support the Analysis❤️ LIKE if this helped💬 COMMENT your BTC view
🔁 SHARE with fellow traders
Your support keeps the analysis coming! 🙏

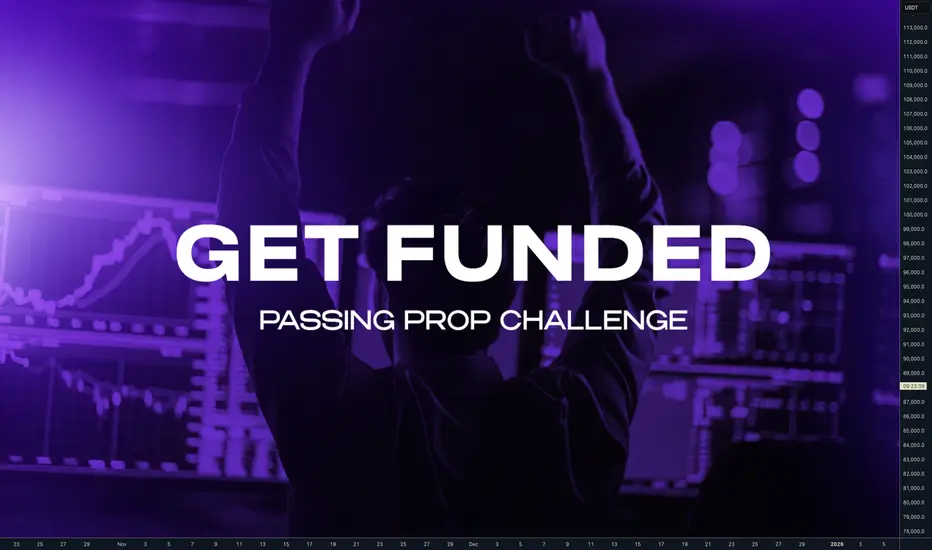
Get Funded and make $20 000 Monthly. Complete plan for 2026.Hey traders let's have a look at prop trading again. It's a great opportunity for the skilled traders who has good strategy, discipline and mastered risk management. Let's start with the numbers which many traders and misunderstood.
📌 Prop firm facts
- $100K account with 10% max drawdown means you got $10K account, not $100K
- Goal of 10% to pass phase 1 while you can risk 10% means 100% gain
- Goal of 5% to pass Phase 2 while you can risk 10% adds another 50% gain.
- You will literally be funded after making 150% not 10% and 5%
⁉️ Does it mean it's impossible to get funded ?
Yes it's possible, next to good strategy you need, discipline and mainly you just need to adjust your risk management. If you make 150% in year as a Hedge fund manager you will be a superstar trader. Yet people still want to pass prop challenge in a less than week or in a few trades which means not sticking to the risk management.
🔗 Click to the picture below to Learn more about Prop Risk management 📌 How to make $20 000 a month ? Magic of 3%
Yes, you actually need to make only a 3% a month. Is it difficult ? No, It's not. You need 3 wins with 1:2 RR while risking 0.5% Risk.
1️⃣Your Ultimate goal - -$100K Funded account - 3% Gain - 80% Profit split = $2400 Payout
2️⃣Let's take it to $20 000 a Month
Don't try to increase your % gains per month, increase your capital under management
- Get another 4 x $ 100K Challenges pass them - You will have $500K AUM:
- $ 500 000 - 3% Gain - 80% Profit split = $12 000
3️⃣Reinvest buy another 3 - 5 challenges aim for $ 1000 000 funded across few solid props firms. 🎯 $ 1000 000 - 3% gain - 80% Profit Split = $24 000 Payout
📌 Have a long term plan
this is not gonna happen in few months. It's a year plan - But you got this... 💪
With approximate cost of $500 - $600 per $100K challenge you will need to spend apron. $5500 to get $1000 000 funding. You will fail some, its unavoidable, so let's count with more might $10K. But still , you can start with first $100K an then reinvest to another challenges. You dont need $10K investment right now. But later this $10K and 3% gain and 80% profit split is $24 000, even more then $20K.
📌 Difficulty is not technical, but in patience
I speak from experiences that my biggest mistakes was trying to pass quickly or when I was in drawdown I started to gamble. Be patient and stick to the rules. If we stick to 3% a month without progressive risk management it would be 4 months to get funded. If you do progressive risk management you can do it faster, and once you are confident you can run multiple challenges at the same time.
📌 Long term plan requires perfect planning
Find 60 minutes just for yourself and this about these questions below, write the answers to to the paper, think about the execution of your project. I know you didn't do it now, but come back to this and do it again. You need to visualize your future successful yourself and remind that visualization every day. I recommend a book - Psycho-cybernetics from Maxwell Maltz it will help you define your self-image of successful trader in the fact this book will change your life.
📌 Essential Rules for Prop Trading
-Its not a straight forward game
-Reduce number of trades - Only A+ Setups
- Grow Your Capital Under management in multiple firms not % gains
- 3% is a golden profit in prop space to live from trading
❌ Dont do this
If you don't trade well on small account, getting prop firm will not change it.
Don't expect it to be a solution to bad financial situation. It's extension. 🧪 Trading is not hard we often overcomplicate it
I believe you already few great trades in a month, but you also have many unnecessary ones, look at your last few month results and check if would be able to make 3% if you excluded those unnecessary trades. I sure you could ant thats what you have to do
Switch from machine gunner to a Sniper.
Write this on a paper and put it somewhere so you see it every day.
🎯 $ 1000 000 - 3% gain - 80% Profit Split = $24 000 Payout
🎯 $ 1000 000 - 3% gain - 80% Profit Split = $24 000 Payout
🎯 $ 1000 000 - 3% gain - 80% Profit Split = $24 000 Payout
$1000 000 Funding !! - Your ultimate goal for 2026 💪
I promised myself I’d become the person I once needed the most as a beginner. Below are links to a powerful lessons I shared on Tradingview. Hope it can help you avoid years of trial and error I went thru.
📊 Sharpen your trading Strategy
⚙️ 100% Mechanical System - Complete Strategy
🔁 Daily Bias – Continuation
🔄 Daily Bias – Reversal
🧱 Key Level – Order Block
📉 How to Buy Lows and Sell Highs
🎯 Dealing Range – Enter on pullbacks
💧 Liquidity – Basics to understand
🕒 Timeframe Alignments
🚫 Market Narratives – Avoid traps
🐢 Turtle Soup Master – High reward method
🧘 How to stop overcomplicating trading
🕰️ Day Trading Cheat Code – Sessions
🇬🇧 London Session Trading
🔍 SMT Divergence – Secret Smart Money signal
📐 Standard Deviations – Predict future targets
🎣 Stop Hunt Trading
🧠 Level Up your Mindset
🛕 Monk Mode – Transition from 9–5 to full-time trading
⚠️ Trading Enemies – Habits that destroy success
🔄 Trader’s Routine – Build discipline daily
🛡️ Risk Management
🏦 Risk Management for Prop Trading
📏 Risk in % or Fixed Position Size
🔐 Risk Per Trade – Keep consistency
Why Most Traders Misread Trends!!! (Fix It in 10 Seconds)Every trader talks about trends.
Few actually understand how to read them.
Most traders think a trend is defined by:
- a diagonal line
- a moving average
- or a breakout
But the truth is much simpler... and far more powerful:
A trend is defined by the quality of its pullbacks.
📚Here’s the 10-second method professionals use:
1️⃣ Shallow Pullbacks = Strong Trend
When pullbacks barely retrace and reverse quickly,
it means one side is overwhelming the other.
Momentum is healthy.
Continuation is likely.
A shallow pullback tells you:
➡️ “Don’t fade this. Follow it.”
2️⃣ Deep Pullbacks = Weakening Trend
When price retraces deep into the previous leg,
momentum is slowing and imbalance is shrinking.
Buyers are less aggressive.
Sellers are gaining confidence.
A deep pullback tells you:
➡️ “Trend still alive, but the engine is cooling.”
3️⃣ Chaotic Pullbacks = Trend Is Dying
If pullbacks become wide, choppy, overlapping, messy,
the trend is no longer in control.
It’s not a trend anymore.
It’s a negotiation.
A chaotic pullback tells you:
➡️ “Stop trading the trend. Wait for structure.”
📚Final Thought
The market isn’t random ... it’s rhythmic.
And pullbacks are the rhythm.
Once you learn to read that rhythm, you’ll stop fighting trends…
and start flowing with them.
⚠️ Disclaimer: This is not financial advice. Always do your own research and manage risk properly.
📚 Stick to your trading plan regarding entries, risk, and management.
Good luck! 🍀
All Strategies Are Good; If Managed Properly!
~Richard Nasr
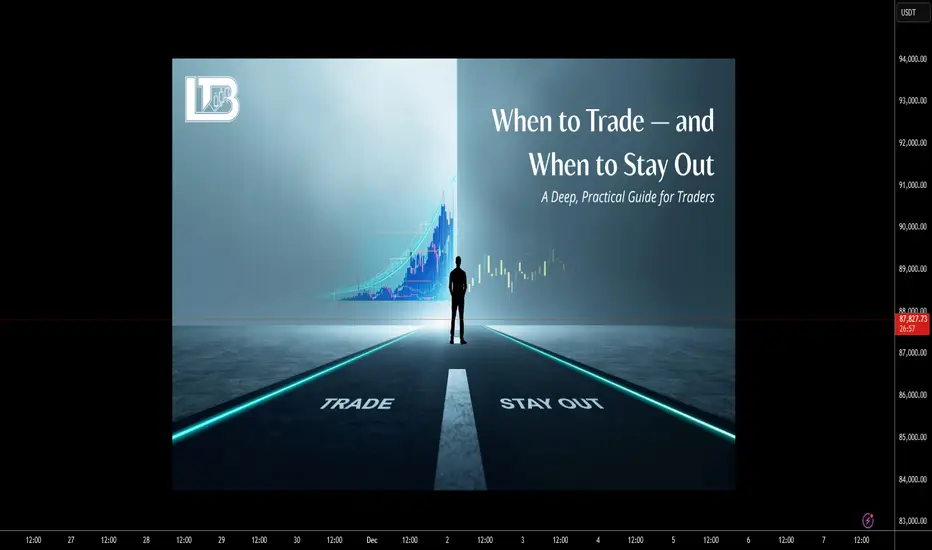
When to Trade — When to Stay OutWhen to Trade — When to Stay Out: A Deep, Practical Guide for Traders
Timing is a core edge. Not every hour, session, or chart condition is trade-worthy. The difference between a profitable trader and an active losing trader is not how many trades they take — it’s which trades they take and when. This article gives you a detailed, systematic framework to decide when to trade and when to stay out, with concrete rules, time windows, checklists and worked examples.
Big-picture logic
Markets are driven by liquidity (where orders sit), volatility (how fast price moves) and participants (who is trading). Good timing aligns these three:
Liquidity concentration (institutions, marketmakers) produces cleaner, higher-probability moves.
Right volatility means enough movement to reach targets but not so much that stop losses are random.
Recognizable market structure (trends, ranges, breaks) allows rules to be applied consistently.
If any of the three is missing, edge declines and risk of random losses rises.
Session windows — when the market is most tradable
Below are standard session definitions in UTC+00:00. Adjust for daylight savings if required (noted where relevant).
Tokyo / Asian Session
⏵ UTC+00:00: 23:00 – 08:00 ( main liquidity often 23:00–02:00 UTC )
⏵ Characteristic: lower liquidity for major FX pairs, choppier price action. Exceptions: JPY crosses, pairs with Asia-led liquidity, and crypto (24/7).
London Session
⏵ UTC+00:00: 07:00 – 16:00 (most active 08:00–11:00 UTC)
⏵ Characteristic: heavy institutional flow, high liquidity. Many clear directional moves begin here.
New York Session
⏵ UTC+00:00: 12:00 – 21:00 (most active 13:00–16:00 UTC)
⏵ Characteristic: continuation or reversal of London moves; major news releases occur here.
Key overlap (best single window)
⏵ London–New York overlap: UTC+00:00 ~12:00–16:00. Highest combined liquidity and volatility; most “clean” trends and reliable breakouts occur here.
Rule of thumb: Prefer intraday trades during the London session and the London–New York overlap. Be selective in Asia unless trading JPY pairs or range-break strategies designed for low liquidity.
Concrete: Best times to trade (prioritized)
Session open impulse — first 60–120 minutes of London or New York sessions.
Overlap window — London + New York overlap (UTC+00:00 ~12:00–16:00).
Post-news verified moves — 10–30 minutes after high-impact macro prints, if market structure becomes clear and isn’t just noise.
Clear breakouts after consolidation during active sessions (volume confirmation, sweep of liquidity, not just a one-bar spike).
When to avoid trading (and why)
Low-volume Asian hours for majors — price tends to chop and give false signals.
Right before major macro releases (NFP, CPI, FOMC) — price can gap or spike unpredictably. Exceptions: defined volatility playbook with strict hedges.
Midday lulls after initial session impulse — often flat ranges and low edge.
On unclear structure / messy price action — wide, overlapping candles, no clear swing highs/lows.
During market holidays or early close days — liquidity is thin; spreads widen.
Pre-trade checklist
Time window OK? (London / NY open or high liquidity event)
Major news? (No significant release within ±30 mins)
Higher timeframe structure clear? (H4 or Daily trend / range)
Trade idea defined (entry, stop, target) — use price levels, not indicators only.
Risk per trade ≤ planned % of account (see position sizing).
Reward : Risk ≥ your minimum (e.g., 1.5–3:1 depending on edge).
Catastrophic stop capability confirmed (can you absorb worst-case slippage?)
Exit rules set (profit-taking scale or full exit)
Trade logged in journal immediately after (reason, setup, time, bias)
Position sizing — exact worked example (step-by-step)
Use a fixed % of equity for risk per trade (commonly 0.5%–2%). Example uses 1% risk.
Assume:
Account size = $10,000.
Risk per trade = 1% of account = $10,000 × 0.01.
We compute digit-by-digit: 10,000 × 0.01 = 100. So maximum $100 risk on this trade.
Generic position-size formula:
Position size (units) = (Account Size × Risk%) ÷ (Stop Distance in price units × Value per price unit per 1 unit)
Always recalc pip/value for cross rates and for instruments (stocks, futures, crypto) — adapt the “value per price unit” accordingly.
Money Management is much more important than a strategy. You should learn Money Management before trying any strategy.
Order types & execution rules
Limit entries at confluence levels (support/resistance + liquidity sweep zone) — better price and less slippage.
Stop orders for breakout entries — use when you want to enter only after momentum confirms.
OCO (One Cancels Other) for scaling / invalidation management — reduces manual errors.
Avoid market entries during major news due to slippage/gap risk, unless your plan accounts for it.
Trade management & exits
Initial target: defined by structure (previous swing, ATR multiples, measured moves).
Scale out: consider taking partial profits at the first reasonable target, let the rest run with a trailing stop.
Stop relocation: only move stop to breakeven after a predefined profit multiple reached (e.g., after +1R or after price clears a new structure). Don’t move stops based on emotion.
If price returns and breaks your entry zone invalidating the setup, exit — the market changed.
Strategy-specific timing tweaks
Trend-following: prefer strong sessions (London/NY) and avoid Asian low-liquidity hours. Enter on retracements that align with higher timeframe trend.
Range / mean-reversion: worst during session opens; best during mid-session lulls, but only if volatility is low and boundaries are clear.
Breakout strategies: require confirmation — e.g., breakout during overlap or accompanied by increased volume / volatility. Avoid breakouts in thin Asian hours.
News scalping: high risk; only for experienced traders with defined entry, strict spread/latency controls, and capital to absorb spikes.
Common mistakes (and how to fix them)
Trading outside your chosen time windows — fix: enforce a trading clock.
Overtrading in chop — fix: increase minimum R:R and wait for clear structure.
Ignoring spreads and liquidity — fix: include spread in stop/target math and avoid thin sessions.
Moving stops prematurely — fix: use rules (e.g., only move after +1R).
Trading news impulsively — fix: have a news plan: either avoid or have a predefined volatility playbook.
Emotional trading (e.g. not closing the position when the price hits stop-loss)
Psychological & routine rules
Trade only when rested and focused.
Limit screen time to your pre-set sessions.
Keep a journal: reason for trade, outcome, lessons. Review weekly.
Daily routine: pre-market scan 30–60 minutes before your active session, post-session journal entry.
FAQ
Q: Can I trade during Asian hours?
A: Yes — but selectively. Prefer JPY pairs, Asia-centric instruments, or strategies built for low volatility.
Q: What if my timeframe and session disagree?
A: Give priority to higher timeframe structure. If H4 / Daily shows trend, trade during active sessions for better fills.
Q: How much should I risk per trade?
A: Conservative traders use 0.5%–1% per trade. More aggressive ones use up to 2%. The key is consistency and drawdown planning.
Focus your trading during high-liquidity windows (London, New York, and their overlap), avoid low-volume and pre-news periods, always validate trades with liquidity + volatility + clear market structure, use strict risk management (e.g., 1% per trade with position sizing), and follow a pre-trade checklist to avoid low-quality setups. Better timing = better edge.
Enjoy!
When Alt Season. Is it even happening ever again?This will be very short. Forget Alts season, it's not happening again here is why. No Lambo.
Social media Crypto gurus calling and hypes random coins every day. People are still hoping their precious alt coin will pump and make them a fortune. this is how looks all influencers accounts.
They are Calling Alt seasons every day since 2023. Did they even held some BTC ?
Back in the days in the bull run you could buy any Alt, next day it was 30% up than 100% and 300% and more in few weeks. You could literally buy anything and it went up.
But these times are gone. Game has changed and played changed.
📌 Number of coins
2017: ~1,300 coins → altseason
2021: ~9,800 coins → altseason
2025: 25,000+ coins + thousands of memes → NO ALTSEASON, only isolated pumps
When there are 25x more coins than in 2017, the same amount of liquidity gets diluted.
Altseason today = micro-seasons inside specific narratives, not a giant synchronized run.
Which is difficult to predict and you will not make it just by making technical analysis, you must pick the right one in the sea of coins. It's literally like buying a lottery ticket.
📌 The players has changed
Altseason used to be simple: money flowed into Bitcoin → profits rotated into large caps → then mid caps → then low caps → and everything exploded together. That era is gone.
📌 No more big money Rotations
Bitcoin buyers are now institutional- Blackrock , Fidelity, Vanguard and other ETFs...
Their clients are not here to sell at some point to rotate to some other Sh...coin.
Saylor is not gonna rotate in to some Sh...coins.
Yes, many people will run this playbook and influencers calling for this even every day since 2023. While it was one bitcoin show. Nothing else. Some promises of the future technology, new financial systems, faster than BTC... Its all BS...It's all small money spread to the sea of thousands and thousands of new coins created daily on Solana. It will not be enough to create such a parabolic moves as Alt season used to be.
📌 Individual pumps
It will be some individual coins pumping out of nowhere which you dont have a chance to predict Like ZEC recently. Of course some of you could argue that you been in this trade. I congratulate you if you did. But you will nor repeat this consistently on next 10 coins and most of people didn't catch this rather they did FOMO buy on the top and they are now 60% down, their investment will not turn in to hope and pray, While this was clean pump and dump and it will slowly die.
📌 Whats gonna happen next?
Lets have a look to the history top 10 coins in 2017. As you can see most of coins are not here anymore or they are simply not performing. They been just used for pump and dump and then slowly died. This is how most of the coins will end. and we can see it already here.Most coins never went above 2021 highs. Imagine holding Cardano
It has never seen ATH since 2021. Whats the chances it will pump when there is new better coins narratives again? This is basically how all alt coins looks like and they will end like most of them in 2017.
📌 Are we in bear markets?
is the BTC top in ? I think so and we will might see 45K as I predicted if you are in the alts is bad news for you, they will go much deeper and most of them will never recover after this shock. If you are Bitcoiner this is godsend. You can accumulate more sats. Because at some point BTC will see a new ATH again and again.
📌 Purpose of the Alts
VC are creating the coins, keeping the 70% of the supply. Makes a story around the coin launch it, advertise via big X influencers to pump by naive investors and then they are dumping it to them. It still repeats over and over.
Dont play this game anymore. New alts, narratives comes every-time, they come and disappear. I got you , your plan is to buy BTC, but first you want to make more money on Alts or meme so you got more BTC , but NO it's not gonna happen. You will only loose money and have less BTC in the end.
Wouldn't you be doing better if you just buying BTC and hold?
I wish you all success in the Crypto investing.
David Perk

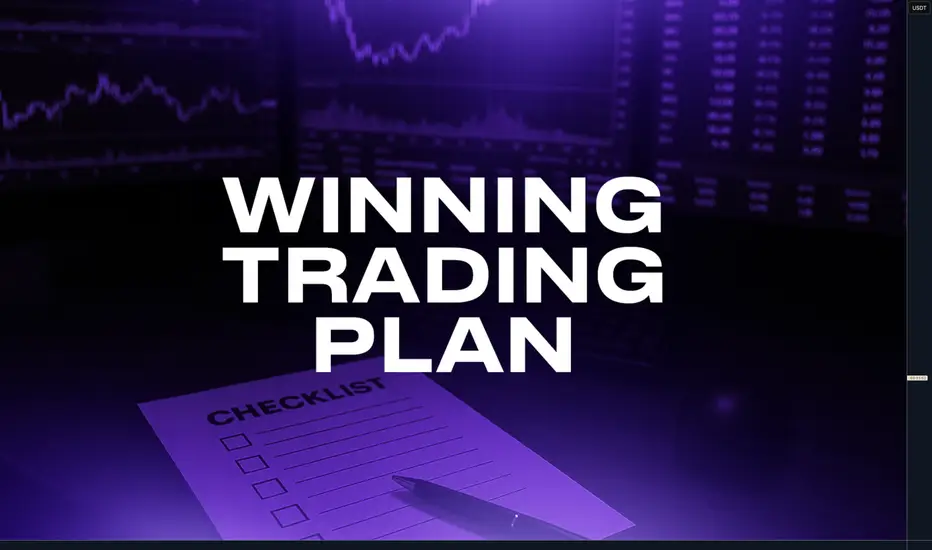
Trading Plan - What should be included and how to improve it. I have been failing same like many traders are failing these days for same reason. Not having a plan and clearly defined when to trade , when not to trade and didn't have set barriers when to stop. Always wanted to make more. Yes it sounds boring and restrictive. But you will either lean on plan or on impulses.
Everything start with visualization of how your trade setup should looks like. You should know what exactly you are looking for and describe it as much as possible for example:
🧩 Basic Concept
Im looking for the fake break out of the range. Whether we call it manipulation or Stop hunt. It really doesn't matter. The idea is that once big candle is created it creates fomo and break out traders are entering continuation. I trade against them.
📍 Bullish continuation setups
Model 1 - Entry after manipulation - 50% target
Model 2 - Entry on pullback on level between 61.8 - 80% 📍 Bearish Continuation setups
Model 1 - Entry after manipulation - 50% target
Model 2 - Entry on pullback on level between 61.8 - 80% pullback This is your strategy, your pattern you are looking for in the specific situations and market conditions.
📍 Trading plan
is how, when and where , you are going to execute it. It's also good to describe your step by step process, so you remind it to yourself. I suggest to read it before every trading session. Especially beginners or if you adopted a new strategy. Describe every trade element as much as possible. With experiences you will be improving and shaping it. It has to be as simple as possible. 📍 Trading Pairs - If you are day trader / Intra week trader focus on 8 pairs maximum, You dont need more - DXY, EUR, GBP, CHF, BTC, ETH, SOL, XAU
📍 Market Bias - Describe how you analyze your Bias - Trend
Do you have HTF Trend / Liquidity ?
Internal LQ - Discount / Premium
External LQ - Significant HL taken
Monday, Friday, Weekly CLS Range
Key Level ? - If NO - NO trade
Liquidity Sweep + SMT
CIOD - Close - Model 1- 50% TP
📍 Down Trend - Trade Stop hunts above the highs
📍Up Trend - Trade Stop Hunt below the lows 📍 TF Alignment CLS Range + Entry - Structure of my Top Down analysis
Weekly / Daily Range - CLS Range
H4 / H1 / M30 / M15 - Entries
Don't overcomplicate it this works 📍 Setup Qualifications - If one of criteria is not met = No trade
High volatility Stop hunt
Stop run out of CLS range - 0.15%
Rejection from Key Level
CIOD on the LTF Model 1
Correct times - NY, LO , PM Sessions
📍 Entry Model 1
CIOD - the next candle below / above open
if the engulfing candle is too big, wait for a pullback
If range is too big take TP at 50%
Look for correlated pairs
If within HTF trend, target full range.
📍Bullish Scenario LTF Change in order flow is important aspect of the trade if you dont wait patiently for the candle close on the right timeframe, setup is invalid. 📍Bearish Scenario
as you can see price action never looks completely same you need to practice your eyes to see it, profiles, levels and what is happening on the edge of the range. Another and not less important part is knowing when not to trade. Also Im not perfect and even I have quite good plan sometimes I dont follow so reminding these mistakes and reading them in my trading plan is great way to eliminating them next time.
🧪 Low Probability Conditions
Day and Day before NPF, FOMC or CPI
Last and First day of a New Month
Dont buy or sell in the direction of overextended markets
An HTF objective has been met
Price tripped between two Key Levels
🧪 Don't trade IF
- Equal highs / Lows around your SL
- If stop run is to shallow
- Candle didn't closed yet
- If you didn't catch the initial move - don't fomo
- No room for at least 2RR
🧪 Recent Mistakes
- Trading within wrong market conditions
- Entering before CIOD confirmed
- Shallow manipulations
- Now waiting for the PWL / PDL Work on constant improvement, not by adding indicators or by looking for new strategy, commit to the one and master it . 1 Kick - 10 000 times
⁉️ This is questions Im asking myself when going thru past trades. It will help you improve as a trader and shape your trading plan.
- Was there a type of trade that did/didn’t work well?
- Was there a particular market that I did/didn’t trade well?
- Was there a particular day/time that I did/didn’t trade well?
- Did I enter trades too soon?
- Did I enter trades too late?
- Did I take profits too soon?
- Did I take profits too late?
- Did I put my stops loss too tight?
- Did I use an unnecessarily big stop loss?
- Did I take take any trades with poor Risk:Reward ratio?
- Did I risk too much?
- Did I risk too little?
- Did I deviate from my trading model?
- Did I deviate from my plan?
I promised myself I’d become the person I once needed the most as a beginner. Below are links to a powerful lessons I shared on Tradingview. Hope it can help you avoid years of trial and error I went thru.
📊 Sharpen your trading Strategy
⚙️ 100% Mechanical System - Complete Strategy
🔁 Daily Bias – Continuation
🔄 Daily Bias – Reversal
🧱 Key Level – Order Block
📉 How to Buy Lows and Sell Highs
🎯 Dealing Range – Enter on pullbacks
💧 Liquidity – Basics to understand
🕒 Timeframe Alignments
🚫 Market Narratives – Avoid traps
🐢 Turtle Soup Master – High reward method
🧘 How to stop overcomplicating trading
🕰️ Day Trading Cheat Code – Sessions
🇬🇧 London Session Trading
🔍 SMT Divergence – Secret Smart Money signal
📐 Standard Deviations – Predict future targets
🎣 Stop Hunt Trading
🧠 Level Up your Mindset
🛕 Monk Mode – Transition from 9–5 to full-time trading
⚠️ Trading Enemies – Habits that destroy success
🔄 Trader’s Routine – Build discipline daily
💪 Get Funded - $20 000 Monthly Plan
🛡️ Risk Management
🏦 Risk Management for Prop Trading
📏 Risk in % or Fixed Position Size
🔐 Risk Per Trade – Keep consistency
David Perk aka Dave FX Hunter ⚔️
Bitcoin Breakdown After Perfect Bounce — Short Setup LoadingAs I expected , Bitcoin bounced from the support zone and reached its targets.
Right now, Bitcoin has rejected from resistance lines and successfully broke both the support line and the support zone($90,650-$90,000).
From an Elliott Wave perspective, it appears that Bitcoin has completed a ZigZag structure, and we should now anticipate the start of a bearish wave sequence.
The S&P 500 index( SP:SPX ) also shows a bearish outlook, and given Bitcoin’s correlation with SPX, further downside in BTC is not surprising.
At the same time, USDT.D%( CRYPTOCAP:USDT.D ) has turned bullish again—at least in the short term—which can add additional pressure on Bitcoin.
I expect Bitcoin to continue its downward movement, at least toward the next support zone($87,140-$85,290) and the lower line of the ascending channel.
Note: It’s better to wait for a bullish correction before entering, and then take a short position according to your own strategy.
Cumulative Short Liquidation Leverage: $98,260-$96,690
Cumulative Short Liquidation Leverage: $93,040-$92,560
Cumulative Long Liquidation Leverage: $94,840-$94,100
Cumulative Long Liquidation Leverage: $83,900-$82,400
Target: $87,733
Stop Loss(SL): $92,723(Worst)
Points may shift as the market evolves
💡 Please respect each other's opinions and express agreement or disagreement politely.
📌Bitcoin Analysis (BTCUSDT), 1-hour time frame.
🛑 Always set a Stop Loss(SL) for every position you open.
✅ This is just my idea; I’d love to see your thoughts too!
🔥 If you find it helpful, please BOOST this post and share it with your friends.
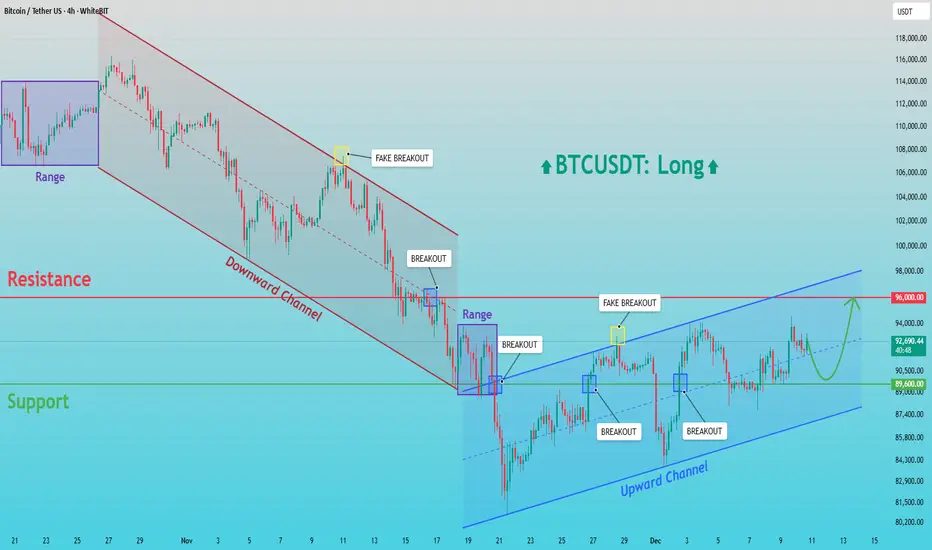
BTCUSDT Long: Demand Line Holds — Path Toward 96,500 Opens UpHello, traders! BTCUSDT is respecting the Triangle Demand Line after completing a full bearish cycle inside the descending channel earlier. Sellers maintained control for an extended period, pushing price steadily lower until it reached the pivot point near 88,800, where buyers finally stepped in and broke the bearish structure. This pivot zone became the foundation for a new bullish sequence, with price forming higher lows along the Triangle Demand Line. After the breakout from the descending channel, BTCUSDT entered a consolidation Range, where multiple fake breakouts occurred on both sides. This range acted as a transition phase before buyers regained momentum. Following the range, price made another bullish attempt, but faced resistance near the 96,500 Supply Zone — an area where sellers have shown strong activity in the past.
Currently, BTCUSDT is moving toward the Triangle Demand Line once again, retesting it as support. As long as buyers defend this trendline and price remains above the Demand Zone at 88,800, the bullish structure stays intact.
My scenario: if the trendline holds, BTCUSDT may bounce and continue moving toward the 96,500 resistance, which remains the main upside target for the current bullish leg. A clean breakout above 96,500 would open the path for stronger continuation. However, if price fails to hold the demand line, a corrective pullback toward the lower demand region becomes possible. For now, the market structure remains bullish while price respects the Triangle Demand Line. Manage your risk!

Bitcoin at Critical Resistance — Bull Trap!?Over the past couple of hours, Bitcoin ( BINANCE:BTCUSDT ) has surprised many traders—including myself—with its sharp movements. The potential reason behind this could be an anticipated interest rate cut tomorrow. However, the recent JOLTS Job Openings did not fully align with that expectation.
With our technical analysis tools, we can delve deeper into Bitcoin’s next moves. The key question is whether Bitcoin will maintain its recent bullish momentum or if a reversal is imminent.
It’s important to note that in the next 24 to 48 hours, we may see increased volatility in the financial markets, particularly in crypto. Therefore, it’s wise to practice good risk management—or even consider staying on the sidelines until the market settles.
At the moment, Bitcoin has managed to break through resistance lines, but the volume of this breakout hasn’t been particularly high. Bitcoin is also near a resistance zone($94,850-$93,000), monthly pivot points, and significant levels of Cumulative Short Liquidation Leverage($98,260-$94,600), all of which add to the complexity.
High sell orders: $96,000-$94,800
From a classical technical standpoint, there’s potential for a bearish flag pattern forming. As long as Bitcoin remains below $100,000, this scenario remains plausible.
From an Elliott Wave perspective, it seems that the main Wave B has completed, and we’re likely looking at a ZigZag correction(ABC/5-3-5). This correction might complete either at the resistance zone($94,850-$93,000) or near the daily 50_SMA(Daily).
Considering that the S&P 500 index ( SP:SPX ) is also showing a bearish trend, it’s more likely that Bitcoin’s main corrective Wave C will complete within these resistance levels.
Also, the USDT.D% ( CRYPTOCAP:USDT.D ) remains a crucial factor. Until it hits around 5.49%, the overall crypto market is likely to remain bearish.
In conclusion, I expect that Bitcoin will continue its downward movement, potentially testing $89,000 and even dropping below $85,000. This could represent a significant bearish phase for Bitcoin.
What are your thoughts? Do you think Bitcoin will maintain this bullish momentum, or are we headed for more downside?
Cumulative Long Liquidation Leverage: $89,430-$88,750
Cumulative Long Liquidation Leverage: $83,900-$82,400
First Target: $90,300
Second Target: $87,503
Stop Loss(SL): $100,020(Worst)
Points may shift as the market evolves
💡 Please respect each other's opinions and express agreement or disagreement politely.
📌Bitcoin Analysis (BTCUSDT), 4-hour time frame.
🛑 Always set a Stop Loss(SL) for every position you open.
✅ This is just my idea; I’d love to see your thoughts too!
🔥 If you find it helpful, please BOOST this post and share it with your friends.

The F1 Mindset Every Trader Needs!!!Most traders behave like they’re trying to win the race on the first lap.
Full throttle. No patience. And then they wonder why they spin out before the finish line.
🏎 But in Formula 1, especially under the lights of Abu Dhabi, the winners don’t drive the fastest…
They manage the race the smartest.
And trading is no different.
Here are the three F1 lessons every trader should master:
1️⃣You Don’t Win by Being Fast => You Win by Being Controlled
F1 drivers don’t go maximum speed all the time.
They manage tyres, fuel, engine temperature, and track conditions.
In trading, your “tyres” are your capital.
Burn them early with emotional trades, and your race is over.
Consistency beats speed.
Control beats excitement.
2️⃣ Your Strategy Is Your Pit Crew
No F1 driver wins alone, they rely on a team that’s fast, disciplined, and precise.
For traders, your “pit crew” is your:
- trading plan
- risk management
- journaling
- strategy rules
- routines
When your system is aligned, your performance becomes predictable.
When it's sloppy, you get undercut by the market every time.
3️⃣ The Race Is Won on Corners, Not Straights
Every driver can accelerate on the straights.
Champions gain their advantage in the corners — the difficult, technical parts of the track.
In trading, the “corners” are:
- drawdowns
- losing streaks
- choppy markets
- hesitation
- volatility spikes
Anyone can trade a trending market.
True professionals shine in difficult conditions.
🏁 Final Lap Insight
The Abu Dhabi Grand Prix doesn’t reward the loudest driver, it rewards the most disciplined.
Trading is exactly the same.
✔ The market is your circuit.
✔ Your account is your car.
✔ Your rules are your race line.
✔ And your mindset determines whether you finish… or crash out on turn one.
Trade like an F1 driver:
calm, calculated, consistent, and always thinking about the full race, not a single lap.
⚠️ Disclaimer: This is not financial advice. Always do your own research and manage risk properly.
📚 Stick to your trading plan regarding entries, risk, and management.
Good luck! 🍀
All Strategies Are Good; If Managed Properly!
~Richard Nasr

BTCUSDT: Failed Recovery Opens Path to 87,000 SupportHello everyone, here is my breakdown of the current BTCUSDT setup.
Market Analysis
BTCUSDT is trading inside a broader ascending channel, but the recent price action shows clear signs of weakness near the upper structure. Price previously attempted a breakout above the 90,000 Resistance Zone, however this move turned into a fake breakout, confirming strong seller pressure in that area. After the rejection, the market shifted into a corrective phase and formed a descending triangle structure, defined by the Triangle Support Line and repeated failures near resistance.
Currently, price is consolidating just below the 90,000 resistance, while gradually sliding along the descending support of the triangle. The 87,000 Support Zone remains the key downside buffer where buyers previously stepped in. The overall structure now suggests that bullish momentum is weakening, and sellers are gaining short-term control as long as price remains below the 90,000 resistance level.
My Scenario & Strategy
My scenario is bearish, as long as BTCUSDT stays below the 90,000 Resistance Zone and continues to respect the descending triangle structure. I expect price to attempt another breakdown toward the 87,000 Support Zone, which aligns with the lower channel support and previously active demand area. A clean break below 87,000 would confirm bearish continuation and open the path toward deeper downside targets.
However, if price once again reclaims the 90,000 resistance with strong volume and holding strength, the bearish scenario would be invalidated and a renewed push toward the upper channel could follow. For now, the market supports a short bias, with the main focus on a potential move toward the 87,000 support area.
That’s the setup I’m tracking. Thank you for your attention, and always manage your risk.

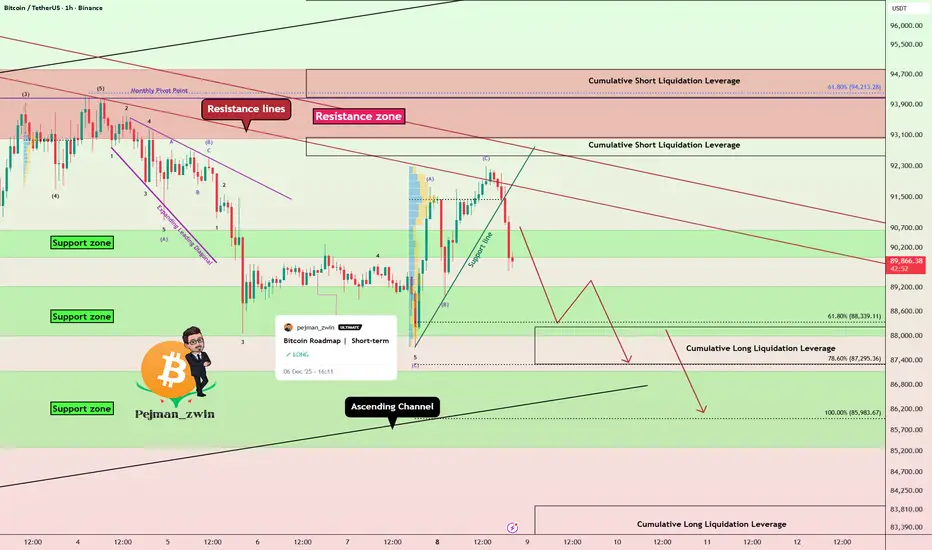
Bitcoin Roadmap | Short-termBitcoin( BINANCE:BTCUSDT ) began to decline from the resistance zone($95,020-$94,840) exactly as expected in my previous idea , successfully reaching all targets.
At the moment, Bitcoin was able to break the support zone($90,650-$90,000). It seems that the pullback to the broken support zone($90,650-$90,000) could be completed with a symmetrical triangle pattern, although given the low trading volume on Saturday and Sunday, this triangle may not function properly.
In terms of Elliott Wave theory, Bitcoin appears to be completing the microwave C of the main wave B, and I expect at least one more impulsive 5-wave move to the upside.
I expect Bitcoin to start rising from the support zone($89,230-$88,000) or the Potential Reversal Zone(PRZ) maximum. A break of the resistance lines could be a good sign for Bitcoin to rise again.
What do you think? Do you believe Bitcoin will dip below $75,000, or will it bounce back?
Cumulative Short Liquidation Leverage: $98,260-$96,690
Cumulative Short Liquidation Leverage: $90,560-$89,990
Cumulative Long Liquidation Leverage: $87,820-$87,290
Cumulative Long Liquidation Leverage: $83,900-$82,400
First Target: $89,911
Second Target: $92,119
Stop Loss(SL): $86,120(Worst)
Points may shift as the market evolves
💡 Please respect each other's opinions and express agreement or disagreement politely.
📌Bitcoin Analysis (BTCUSDT), 1-hour time frame.
🛑 Always set a Stop Loss(SL) for every position you open.
✅ This is just my idea; I’d love to see your thoughts too!
🔥 If you find it helpful, please BOOST this post and share it with your friends.

Emotional Patterns: What Your Trades Reveal About YouTrading feels technical on the surface, yet the deeper layer is psychological. Charts highlight opportunities, but the way you behave inside those opportunities shapes the outcome. Each trade reflects how you respond to pressure, uncertainty, and risk. Over time, these reactions create emotional patterns that influence results more than strategy.
One early pattern appears after a loss. A losing trade often triggers frustration, and that frustration pushes traders into fast entries aimed at regaining control. The decision becomes driven by emotion rather than process, and this behaviour can quickly lead to a cycle of overtrading.
Winning streaks create a different pattern. Confidence expands, and many traders begin increasing size, loosening rules, or entering before confirmation because recent success feels reassuring. This overextension usually leads to sharp setbacks when the market shifts.
Another frequent pattern is hesitation. Traders with inconsistent execution tend to freeze at key moments. They wait for additional confirmation, delay entries, or watch clean setups move without them. The pause often comes from the memory of previous mistakes rather than a lack of technical understanding.
Entries reflect trust in the system. Exits reflect trust in personal decision-making. Closing a trade too early often shows discomfort with open profit. Holding a losing trade too long often comes from discomfort with accepting a loss. These behaviours reveal the trader’s relationship with risk far more clearly than any written reflection. The chart becomes a mirror.
Recognising emotional patterns provides clarity. When recurring behaviours appear—chasing, hesitating, forcing trades, avoiding losses—they become easier to interrupt. Once a pattern is visible, it starts losing influence.
Structure then supports the change: rules, checklists, routines, and clear confirmation criteria. These elements stabilise execution and reduce the impact of emotional impulses.
A strategy defines potential entries, but emotional patterns determine whether the trader can execute consistently enough to benefit from it. Awareness strengthens decision-making. When you understand what your trades reveal about your behaviour, you can adjust it and bring execution closer to intention.
This is where consistency begins.

Lingrid | BTCUSDT Potential Bullish Trend Continuation SetupBINANCE:BTCUSDT is holding above the trendline after defending the higher-low zone, keeping the broader bullish structure intact. The recent pullback swept short-term liquidity before price stabilized near the 89,000 support band, where buyers stepped back in. This behavior suggests the move lower was corrective rather than the start of a reversal.
As long as price remains supported above 89,000 and respects the ascending structure, CRYPTOCAP:BTC has room to grind higher toward the upper resistance cluster around the weekly high near 96,000. A successful push through that zone would signal trend continuation, while short-term consolidations along the trendline remain constructive for further upside.
➡️ Primary scenario: higher lows hold → continuation toward 96,000 resistance area.
⚠️ Risk scenario: loss of 89,000 support invalidates the bullish setup and shifts focus back toward deeper support.
If this idea resonates with you or you have your own opinion, traders, hit the comments. I’m excited to read your thoughts!

BTCUSDT: Buyers Regain Control — $96,000 in FocusHello everyone, here is my breakdown of the current BTCUSDT setup.
Market Analysis
Bitcoin is transitioning from a broader bearish phase into a developing bullish structure. After a prolonged decline inside a well-defined downward channel, BTC formed a base near the $89,600 support zone, where strong buyer interest appeared. Multiple breakouts and fake breakouts around this level confirmed accumulation and growing bullish pressure. Following this reversal, price broke out of the bearish channel and entered a new ascending channel, forming higher highs and higher lows.
Currently, BTCUSDT is consolidating inside this upward structure and trading below the key $96,000 resistance, which remains the major obstacle for buyers. Several false breakouts near this resistance indicate that sellers are still active in this area. However, as long as price holds above the $89,600 support, the bullish structure remains valid and buyers stay in control.
My Scenario & Strategy
My scenario is bullish as long as BTCUSDT stays above the $89,600 support zone and continues to respect the ascending channel structure. I expect the price to gradually build momentum and attempt a retest of the $96,000 resistance. A clean and confident breakout above this level would confirm further upside continuation and open the way for higher targets.
However, if the price fails to break $96,000 and shows strong rejection, a short-term pullback toward the lower channel support may occur. For now, the market favors buyers, with $96,000 as the key upside objective.
That's the setup I'm tracking. Thank you for your attention, and always manage your risk.
EMA 34 & 89 Signal That the Uptrend Is Still Not ConfirmedHello everyone,
BTC is currently in a clear transition phase as the 34 EMA (red) remains below the 89 EMA (blue), or has only barely crossed upward without forming enough separation to confirm a new bullish trend. Price is hovering around 91,000–92,000, sticking closely to the EMA cluster, which at this stage acts more as dynamic resistance than a reliable support. Looking left on the chart, the 92,000 zone corresponds to the previous distribution top — a major supply area filled with trapped orders — making any breakout attempt even more difficult. In other words, BTC is simply retesting the 34–89 EMA cluster combined with old supply, and the probability of a strong immediate reversal is relatively low.
From a macro perspective, the hesitation becomes even more understandable. The Federal Reserve and its rate-cut path remain the biggest variables: markets expect further cuts, but nothing official has been delivered. Without clarity on how dovish the Fed intends to be, major funds are unlikely to aggressively rotate into risk-on assets like crypto. Liquidity inflows also remain muted — no new spot ETF catalysts, no institutional accumulation announcements, and on-chain data shows no strong capital inflow into BTC. As a result, price has enough momentum to retest EMAs, but not enough to break through resistance and establish a sustainable uptrend. Sentiment is also mixed: short-term traders are taking profit into resistance after the recent dump, while buyers prefer to wait for clearer Fed signals, limiting the strength of any chase buying.
Given this backdrop, I still view the current recovery as a technical bounce within a broader weak structure. With the 34 EMA yet to meaningfully separate above the 89 EMA and price still fluctuating around 91–92k, BTC needs one of two conditions to confirm a real breakout: either a strong positive catalyst (aggressive Fed cuts, significant USD weakness, or a clear return of ETF inflows), or a deeper pullback into lower-timeframe demand to build a base first. My preferred scenario is continued choppy movement around the 34 & 89 EMA cluster; and if price keeps rejecting 92k and eventually closes a 4H candle below 90k, the likelihood of revisiting 88k–86k increases before any strong and sustainable rally can take shape.

How to Buy Gold, Which Type to Choose, and Avoid Scammers?!If you want to profit in this inflationary market, you need to know how to buy gold, which type to choose, and how to protect yourself from scammers. Choosing the right type of gold and a reliable source is the key to success. Careful research and safety measures will protect your investment from unnecessary risks.
Hello✌️
Spend 3 minutes ⏰ reading this educational material.
🎯 Analytical Insight on Bitcoin:
From a technical standpoint, Bitcoin needs to fill that unusual gap it sharply created to the downside a few days ago. The price is currently forming a head and shoulders pattern, and everything now hinges on the crucial support level sitting right below its neckline. If this support holds firm, we can expect a rebound and the bullish scenario I've mapped out on the chart becomes likely. However, if it gives way, a further decline toward the next target is the more probable path. I've defined targets for both scenarios. Personally, judging by the technical confluence, I still see a credible chance for a recovery and a move upward.
Now , let's dive into the educational section,
💰 Inflation and Its Impact on Investment
Inflation is the main reason investors are returning to gold.
As currency value declines, safe-haven assets like gold become more attractive.
Investors should understand that gold can preserve wealth in almost any condition, but how you buy it matters a lot.
🏅 The Best Way to Buy Gold
Jewelry gold has high taxes and manufacturing costs, so profits are limited.
Buying physical melted gold is the best option, provided there are no legal restrictions in your country.
In countries where physical melted gold is restricted, reputable non-physical gold can be a suitable alternative, but check the company’s credibility and real gold backing carefully.
Always purchase from certified, reliable companies.
Never put all your investment in one asset; diversification is essential.
🧠 Investor Psychology and Behavior
Greed and fear can disrupt your decisions.
Many people enter the gold market without research and fall victim to fraudulent companies.
Controlling emotional behavior through mental discipline and technical analysis is crucial.
🔍 Practical Tips for Buying Gold
Buy physical melted gold from trusted sources.
For non-physical gold, carefully verify the company’s credibility and backing.
Always limit your investment risk and avoid putting all your funds into a single asset.
Carefully review contracts and purchase terms before committing.
📈 TradingView Tools and Features
Volume Profile: Identify key supply and demand zones in the gold market
Moving Average: Track long-term and short-term trends
RSI: Detect overbought or oversold conditions and market sentiment
Alerts: Set notifications for important price changes
Watchlist: Manage and monitor your assets regularly
💡Summary
Buying physical melted gold from a certified company is the best way to hedge against inflation and protect wealth. In countries with restrictions on physical gold, reputable non-physical gold can be a practical alternative. TradingView tools help make your analysis precise and actionable.
Personally, I expect the global gold ounce price to reach 5000 units by mid-2026, making now a strategic time for careful planning and smart investment.
🏆 3 Important Recommendations
Always diversify your investments across multiple assets to reduce risk.
Buy gold with knowledge and technical analysis, avoiding market-driven emotional decisions.
Thoroughly research any company offering physical or non-physical gold, checking credibility and actual gold backing to prevent scams.
✨ Need a little love!
We pour love into every post your support keeps us inspired! 💛 Don’t be shy, we’d love to hear from you on comments. Big thanks, Mad Whale 🐋
📜Please make sure to do your own research before investing, and review the disclaimer provided at the end of each post.
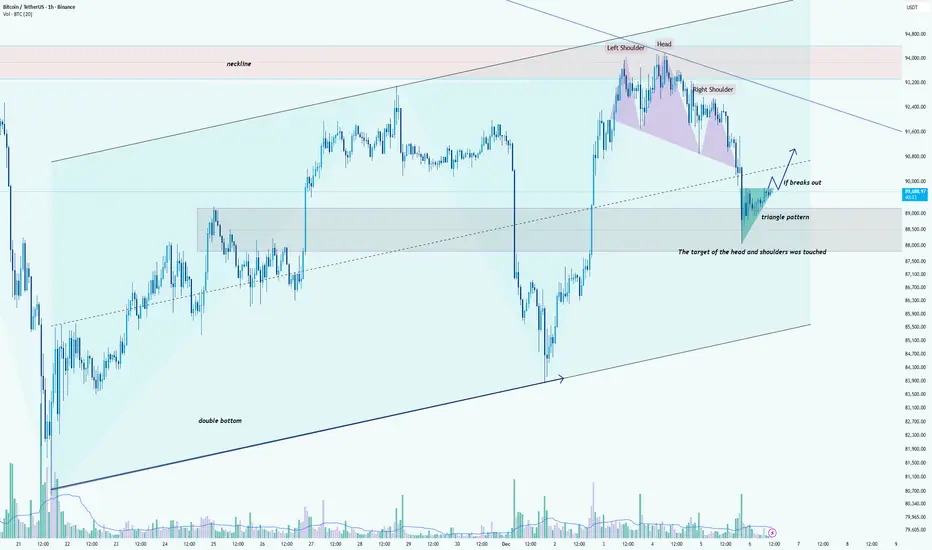
Bitcoin (BTCUSDT) – Intraday Trend & Pattern AnalysisHi!
Bitcoin continues to trade within a broader ascending structure, supported by an established rising trendline that has guided price higher over the past weeks. After forming a double bottom near the lower boundary of this channel, BTC initiated a strong rally toward the major resistance zone around 95,000 USDT, where a clear head-and-shoulders reversal pattern appeared. The neckline later broke, and its measured target has already been fully achieved, confirming the pattern’s validity.
Following the completion of this decline, the price stabilized inside the previous consolidation zone and began forming a triangle pattern, signaling compression and potential trend continuation. BTC is now testing the upper boundary of this triangle. A confirmed breakout above the pattern could trigger a bullish continuation toward 90,500–91,200 USDT, aligning with the dashed trendline and short-term resistance levels.
Failure to break upward may lead to a retest of the triangle’s lower boundary or even the broader demand area around 88,000–88,500 USDT, which previously acted as a reaction zone.
Overall, as long as the price remains above the ascending channel’s main support, the medium-term structure favors buyers. A breakout from the triangle will be the key signal for renewed bullish momentum.
The Transformation Every Trader Must Make!!!Every trader begins with the same goal: “I want to make money.”
But the traders who last, the ones who grow, evolve, and eventually become consistent, go through a quiet transformation:
They shift from thinking about money...
to thinking about probability, structure, and process.
Here’s the transformation in three stages:
1️⃣From Outcome-Driven → Process-Driven
Beginners measure success by whether a trade wins or loses.
Professionals measure success by whether they followed their plan.
- Because a good trade can lose.
- And a bad trade can win.
- Confusing the two destroys growth.
Your job is not to win every trade!
Your job is to execute with integrity.
2️⃣From Prediction → Preparation
Beginners try to guess where the market will go.
They draw a level… then hope.
Professionals don’t predict, they prepare.
They plan both sides:
- If price does X, I do Y.
- If price breaks Z, I step aside.
- If the structure shifts, I adapt.
Prediction feeds the ego.
Preparation feeds the account.
3️⃣From Emotional → Probabilistic Thinking
Beginners think every trade is “the one.”
Professionals think in sample sizes.
- One trade means nothing.
- Five trades mean nothing.
- Fifty trades reveal the truth.
When you think probabilistically:
- Fear shrinks.
- Confidence grows.
- Discipline becomes natural.
Because now you see the market for what it is:
a place where anything can happen, but certain behaviors win over time.
📚 The Real Lesson
Trading becomes easier when you stop trying to force results and start building a process that produces results over the long run.
The market doesn’t reward intensity.
It rewards consistency, clarity, and adaptability.
Your transformation begins the moment you shift from:
“I need this trade to win”
to
“I need to follow my plan.”
That’s when you stop gambling… and start trading.
⚠️ Disclaimer: This is not financial advice. Always do your own research and manage risk properly.
📚 Stick to your trading plan regarding entries, risk, and management.
Good luck! 🍀
All Strategies Are Good; If Managed Properly!
~Richard Nasr
BTCUSDT Bullish channel holding strongAs observed on the chart, Bitcoin is trading within a newly formed ascending channel and is currently testing the lower boundary of this structure. This level represents a strategic support zone within the bullish technical framework, offering a favorable opportunity to consider initiating or adding to long positions with appropriate risk management.
Also if this channel resistance break to the upside then market is again bullish after a while.
DISCLAIMER: ((trade based on your own decision))
<<press like👍 if you enjoy💚

BITCOIN → False breakout of resistance on a downtrend BINANCE:BTCUSDT is consolidating in the range of 86K - 92K, bears are holding resistance amid a global downtrend, traders lack drivers...
Fundamentally, sentiment in the crypto market is weak, and there is increasing talk of a crypto winter, especially among companies that previously actively bought cryptocurrencies for their balance sheets. There is no bullish driver at the moment.
Bitcoin is in a neutral state, with the market holding the price below 93K. The fundamental background is unstable, and technically, the market is in a downtrend. A reversal pattern is forming relative to 92K, and a retest and false breakout of the zone of interest could trigger a decline to the support range.
Locally, we are seeing an upward channel, but this is a correction against the backdrop of the global trend. If the bears keep the price below 92K, the decline may continue. However, a breakout of 94K and a close above that level could trigger an upward momentum...
Resistance levels: 91850, 92700, 93700
Support levels: 88000, 86300
A false breakout and price consolidation in the short zone could cause further sell-offs towards the areas of interest located at the bottom of the trading range.
Best regards, R. Linda!

BTC Pullback: Buying 50-78.6% Discount LevelsAfter the aggressive internal liquidity grab on December 1st, which subsequently manifested as a Daily Bullish Order Block , Bitcoin continued its local bullish structure from the global 78.6% level, which I analyzed in my global overview: Bitcoin: The ATH Was a Trap. Here's the Real Roadmap.
Currently, the asset is correcting on the 4H structure and has reached the top of the Order Block. However, to obtain a better Risk/Reward (RR) in the trade and for general entry feasibility, I always wait for a more favorable price in the Discount Zone , which is located below the 50% Fib level.
No one can know exactly how deep Smart Money needs to return the asset into the manipulation zone to close losing positions used to execute this aggressive liquidity grab. Therefore, I will consider a reversal reaction from each level: 50%, 61.8%, and 78.6% .
✅ Entry Conditions:
The condition for entry will be reaching one of these levels, price finding acceptance above it, and the initiation of bullish order flow on a lower timeframe (1m-5m).
❌ Invalidation:
The invalidation of the long scenario will be a break of the local 78.6% level . In that case, the Bitcoin reversal from the global 78.6% level in continuation of the global uptrend will be in question, though still possible, as this is a level from the highest timeframe, and the second monthly candle could also close with its body above this level.
🎯 Target:
The minimum target in case of a long setup formation from the Discount Zone will be the SUPPLY zone . To confirm that the bull cycle is not over and the asset can potentially form a new ATH, it will first have to overcome this resistance zone.
~~~~~~~~~~~~~~~~~~~~~~~~~~~~~~~~~~~~~~~~~~~~~~~~~~~~~~~~~~~~~~~~~
The principles and conditions for forming the manipulation zones I show in this trade idea are detailed in my educational publication, which was chosen by TradingView for the "Editor's Picks" category and received a huge amount of positive feedback from this insightful trading community. To better understand the logic I've used here and the general principles of price movement in most markets from the perspective of institutional capital, I highly recommend checking out this guide if you haven't already. 👇
P.S. This is not a prediction of the exact price direction. It is a description of high-probability setups that become valid only if specific conditions are met when the price reaches the marked POI. If the conditions are not met, the setups are invalid. No setup has a 100% success rate, so if you decide to use this trade idea, always apply a stop-loss and proper risk management. Trade smart.
~~~~~~~~~~~~~~~~~~~~~~~~~~~~~~~~~~~~~~~~~~~~~~~~~~~~~~~~~~~~~~~~~
If you found this analysis helpful, support it with a Boost! 🚀
Have a question or your own view on this idea? Share it in the comments. 💬
► Follow me on TradingView for timely updates on THIS idea (entry, targets & live trade management) and not to miss my next detailed breakdown.
~~~~~~~~~~~~~~~~~~~~~~~~~~~~~~~~~~~~~~~~~~~~~~~~~~~~~~~~~~~~~~~~~
