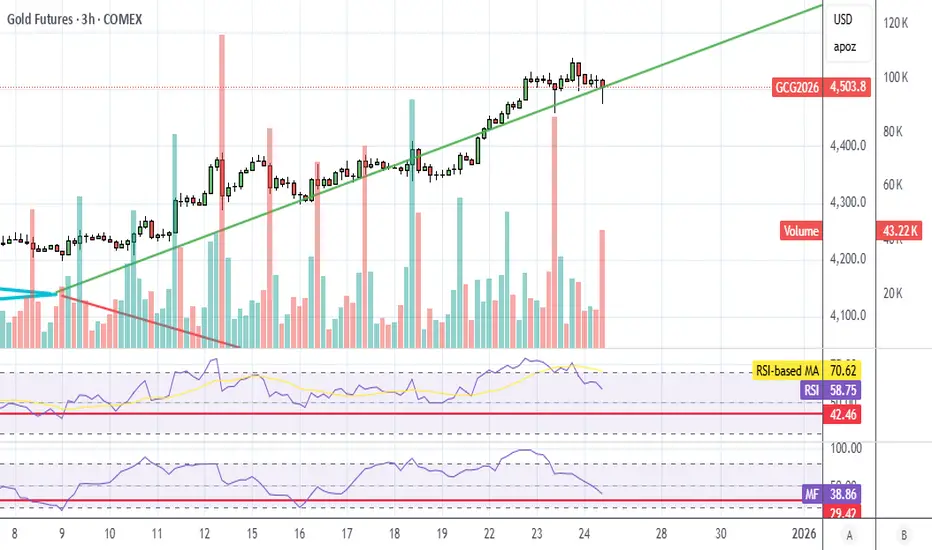
GC UpdateGold hit oversold on RSI, close to it on MFI.
Might take a stab at gold and silver tomorrow.
Gold Futures (Jun 2028)
No trades
Market insights

Unified Support And Resistance Theory: real mechanical levelsBefore we start:
Wave Auction Theory and many preceding posts concerning the levels are now considered legacy. It’s an absolutely working entity, but it’s just a ‘model’.
Volume & signed volume & volume delta would be used interchangeably;
Timeframe = ‘rolling’ amount of data we utilize, e.g. weekly, intra-week.
Resolution = aggregation frequency we use to represent that timeframe, e.g 30m.
E.g a daily (intra-day) timeframe on CME can be represented as 276 5min bars, 46 30min bars, 12 2h bars, or 1380 1min bars, etc. (Yes btw, that's your seasonal windows you heard from me).
Support and resistance levels are exclusively based on (aggregated) tick data, not on orderflow, not on liquidity. Liquidity and CVD based level are structural levels, they form ‘before’ market and limit orders meet, before ticks even emerge. For gaining this information mathematically, you need these 2 scripts: volume analysis & liquidity analysis .
Prerequisites:
Uniform / Sagitta grid , these grid levels would be later referred as anchors or seeds. We would be finding & using only the closest real levels to these anchors.
How levels get positioned & cleared aka consumed aka broken. The same logic would apply to other kinds of levels, not only price-based ones. The main rule stays the same: a level can be positioned with new bars ‘only’ on the same resolution it was located initially.
How to separate (aggregated) tick data into analytical units aka auctions (also briefly mentioned there )
(optional) knowing what Bias-Variance Tradeoff is.
I think USART is not a model, good chances are this is the endpoint source entity. It explains the deepest low-level nature of support & resistance levels, which is tightly linked with information theory. Ironically, the nature of support and resistances is much closer to DSP (Digital Signal Processing) then all this endless variety of custom time-domain filters. Let’s start.
3 Methods of discovering S&R levels
Mathematical method (the blueprint of reality): this is the most general way. Represented by what I called MBAD , QBAD , and PBAD .
- Performs best when market activity is typical or decreased
- Performs ok when market activity is increased
- Performs bad when market activity is extreme
Mechanical method (‘the’ objective reality): these are the real actual levels, this post is focused on them.
- Performs best when market activity is increased
- Performs ok when market activity is extreme
- Performs ok when market activity is typical or decreased
Representation/learning/intuitive/”by feel” method (what objective reality Wants to be): a quick & compressed grasp of reality. An experienced organic would just take a look at the data and ‘feel’ where the levels are. In code, it can be done with a proper clustering algorithm & a couple of other things. The idea is to match the way an organic brain does it. Another script and/or post would be made for this one.
- Performs best when market activity is extreme
- Performs ok when market activity is increased
- Performs bad when market activity is typical or decreased
Also, knowing the 2nd and 3rd method would save you if for some reason your quant math is unavailable atm. Like imagine you rely on MBAD for your objective trading signals, but need to trade / make a decision fast without TV nearby.
Mechanical (real) levels
Signal = information = change
In (aggregated) tick data, supports and resistances are simply locations of change events in (Price & Time & (signed) Volume) field. This is it, the most general and complete definition of what S&R levels really are, mechanically.
These change points carry & reveal & prove information. Imagine a counter example, you have a perfect straight diagonal line (not necessary price movement, any process) that goes on and on forever. There are no distinct points of interest to detect, no S&R levels there, because nothing changes, it just keeps going as it goes. Now once smth changes, e.g it reverses, now we have a point of interest at that reversal.
How to define changes in price, time, volume (necessary for final levels)
Given tick data (aggregated, say 5min chart) has 3 types of fields i.e Price, time, volume delta, we have 3 types of levels as well (we’ll need all the types, but won’t need every individual level).
Choose correct data resolutions first
The mechanical method requires 3 distinct resolutions for each type of level over the same timeframe.
Say our timeframe is intra-week aka inter-day, on CME, we need:
High resolution: last 230 30min bars, for price-based levels. High variance, low bias.
Medium resolution: last 60 2h bars, for time-based levels. Medium variance, medium bias.
Low resolution: last 20 6h bars, for volume-based levels. Low variance, high bias.
^^Me I like to display all 3 resolutions on the same chart
Price-based supports and resistances
^^ When the direction of price movement changes, so simply pivot highs and pivot lows, a couple of examples are marked. Note: when the first or the last datapoint in a triplet is NaN/na, 2 points are enough to detect a pivot high/low. E.g: na, 45, 67: 45 is pivot low; 76, 11, na: 11 is pivot low.
Notice that we use bar highs and lows, these points are recorded by price rule (highest and lowest print of a bar).
Time-based supports and resistances
^^ Basically open-close pairs between the bars: closing print of a bar & opening print of the next following bar. If the previous or next bar is na, like when a session starts/ends. We then use only one print. Study the screenshot pls. After it is clear if a level is becoming resistance or support, we can get rid of one of the prints and choose the final print representing the level: the lowest out of 2 for supports, the highest out of 2 for resistances. Only then levels are considered as formed.
Notice that we use close and open here, these points are recorded by time rule (earliest and latest prints of a bar).
Volume-based supports and resistances
^^ When (inferred or real, depending on asset class) volume delta switches from negative to positive, both bars (say the last with positive delta and the first with negative delta) would provide us 2 levels each: price of the largest sell tick and price of the largest buy tick. This info is unavailable in retail trading platforms, but good news we don’t need it for the assets where we prefer inferred volumes vs the real ones, so equities, bonds, FX. There. Both largest sell tick price and largest but tick price would collapse to bar midrange.
...
The process
Once we know how to locate the levels, we need to pick the ones we need:
Put/imagine the anchors on every finished analytical unit aka auction, and on currently on-going auction. In this post we’d separate market activity into auctions by trading sessions.
Always recall that each anchor has a predetermined lifespan (levels do Not exist 4ever if not-broken):
^^ in mechanical method we don’t use limit levels
After a level is formed (a session is finished):
- Basis lives for 1 more session
- Deviations live for 2 more sessions
- Extensions live for 3 more sessions
- We don’t use limit levels in mechanical method
Look when a new auction opens. We need to find supports below and resistances above.
Find the closest real levels (both positioned and not-positioned ones) to anchors, priority is always: price > time > volume. This way, each anchor would be represented and objectified by 1 or several nearby real mechanical levels. That’s what fibo traders are missing: instead of locating the real price-action based levels ‘nearby’ dem fibo levels, they use the fibo levels like the endpoint truth.
^^ levels for the next sessions
Final hard stop loss & take profit for each level is the level itself +- 1 volatility measure, which is ~ the auction range divided by 3.4641 (aka sqrt12)., of that auction that originated the level. I can explain more how to make it absolutely data-driven and real on request, but it's a negligible improvement.
Improved stop losses: if a level is already positioned (tested), it has a native soft invalidation point. If it’s hit, you can keep the final hard SL but try to exit at breakeven where you’ve entered. It doesn’t mean that the anchor level itself is broken, remember, we can represent each anchor with several real levels nearby.
Improved take-profits: in any doubts, in questionable context etc, 1:1 Risk:Reward is the rule. Because from info perspective, when price leaves the field of a level (remember +- 1 vola measure), it loses contact with it, now it’s outside of the influence area of that level, it means our position also loses the connection with the level from info perspective.
Otherwise, if there’re some supporting factors, you can keep the position, but remember, now you're doing long-n-hold or short-n-hold. One of the supporting factors can be when liquidity and volume imbalance are ‘both’ favoring the hold.
...
∞

Gold target 152k maxGold target 152k max after which don't buy at all or else I feel u will be n trap for very long time.

Gold Update 25DEC2025: Ending Diagonal RechartedNot all our projections play out as we plan
This time Ending Diagonal grew larger but the structure is still valid
as it unfolds in 3-3-3-3-3 sequence
I recharted it for you on 4-hour chart
RSI will be our guide as always:
wave 5 on RSI should be lower than on the price chart
to show Bearish Divergence

GOLDM (GOLD Mini Futures) - ABC correction done?I do mark my counts and analysis mostly on XAUUSD, because that is the tradable instrument and being used across the world.
Just for a change, I tried to plot my counts on INR GOLD Mini Futures today.
CMP: 133250
TF: 1 hour
As you can see, the corrective rise in ABC format seem to have ended at 133500 odd levels today.
The internals are marked for easy understanding.
Invalidation for this view lies at hourly close above 137500
Disclaimer: I am not a SEBI registered Analyst and this is not a trading advise. Views are personal and for educational purpose only. Please consult your Financial Advisor for any investment decisions. Please consider my views only to get a different perspective (FOR or AGAINST your views). Please don't trade FNO based on my views. If you like my analysis and learnt something from it, please give a BOOST. Feel free to express your thoughts and questions in the comments section.

Gold is still Bullish Making higher high and higher low structure, gold has still potential to move upside. Lets see how it works.
Note... This is not financial advice. Trade according to your own research and risk management.

Why is gold fluctuating in futures towards the target of 5120?Since 1975, with the increasing decline in the value of the world's most worthless currency, the dollar, all holders of this worthless fiat have been facing losses day by day against a valuable peak in physical assets!
Currently, the dollar is proud to be at the peak of worthlessness with rulers with a brilliant record of abusing children and girls at a very young age, even less than 5 years old, for sexual slavery, and every day, the yellow pumpkin head with a flat stomach the color of its own impurity, with a speechless tongue, is showing the consequences of accompanying these impurities and its fellow cups.
What makes us think is at what moment in history this swamp will drown all its companions forever. With the hope that this will happen soon!!
Good luck

GC Short Trade IdeaGot levels of resistance here. If we get through the resistance we have a strong high above for a possible short there also.

Gold MCX Future - Intraday Technical Analysis - 23 Dec., 25MCX:GOLD1!
Gold MCX Futures — Chart Pathik Intraday Levels for 23-Dec-2025
(If these levels add value to your trades, a quick boost or comment goes a long way in supporting this free content and keeping our trading community thriving!)
Gold Futures are trading near 136,780, extending a strong uptrend and now pressing into the zero line at 136,744, turning this zone into the key intraday battleground between momentum buyers and profit-taking sellers.
Bullish Structure
Longs remain active above the Long Entry band at 136,086 as long as price holds the Add Long Pos. base at 135,860 on intraday pullbacks.
Targets: 137,931 (Long Target 1 / primary booking zone) and 138,665 (Long Target 2 / extended move if buying pressure sustains).
Control: Stops or trailing risk can sit around 135,633–135,446 (Short Entry and Long Exit) to guard against a deeper mean-reversion after the steep rally.
Bearish Structure
Shorts become attractive only on clear rejection from 136,744–136,780 and especially from the Short Exit at 136,273 if price fails to hold back above the zero line.
Downside focus: 135,577 (Short Target 1) and 134,823 (Short Target 2) if a sharper corrective wave unfolds.
Control: Quick covers are needed if price regains 136,744 after any dip, as that would signal buyers reasserting control towards the higher targets.
Neutral Zone
136,744 is today’s inflection—expect choppy, stop-hunting candles while gold oscillates between roughly 136,273 and 136,780 without decisive 30‑minute closes beyond either side.
Every setup is designed for structure, plan, and logic—let the chart work for you, not your emotions.
Boost or comment if these levels help your preparation—help Chart Pathik keep delivering quality analysis to more intraday traders!

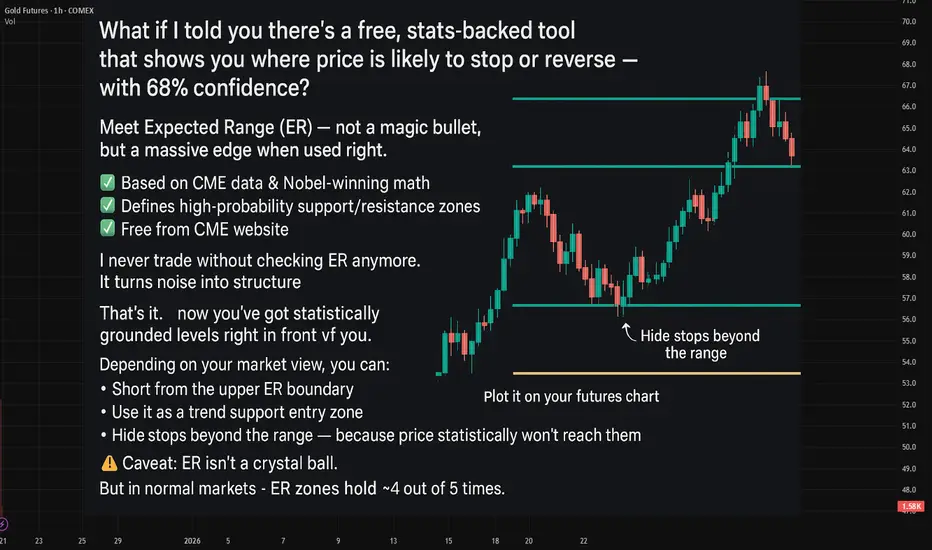
Last week Expected Ranges levels in actionQuick Recap: Last week Expected Ranges levels in action
What is Expected Range Volatility (ER)?
The Expected Range (ER) is a framework that helps traders understand how much an asset is likely to move within a specific timeframe. Based on CME market data and Nobel Prize-winning calculations, price movements within the expected volatility corridor have a 68%-95% probability of staying within those boundaries.
Crude Oil - 6 reactions to levels🔥
EUR - 4 reactions to levels
BTC - 3 reactions
GOLD - 1 reaction to levels
It's really an amazing tool to enhance your market entry💲
!!! - It doesn't guarantee trades every day.
!! it's better to combine it when working with the trend and when there's a clear sideways movement.
How to Trade Breakouts in TradingViewBreakout trading is a strategy that aims to capture strong price movements when markets break through key support or resistance levels, often signaling the start of a new trend or continuation move.
What You'll Learn:
Understanding breakouts as price movements beyond established support or resistance levels
How breakouts can occur at horizontal levels, trendlines, or chart patterns like triangles, rectangles, and flags
Why consolidation patterns often precede strong breakout moves
Recognizing the difference between false breakouts and confirmed breakouts
How to use candle closes beyond key levels as confirmation rather than relying on quick spikes
The critical role of volume in validating breakouts and separating real moves from fakeouts
Why expanding ATR during a breakout confirms increasing volatility and momentum
Understanding the break and close entry method for conservative breakout trades
How to scale into positions by entering partially on the break and adding on continuation
Using the pullback entry strategy to trade retests of broken levels as new support or resistance
Setting stop losses using ATR-based methods or placing them beyond consolidation patterns
Calculating profit targets with measured move techniques by projecting pattern heights
How to mark key levels in TradingView using the horizontal line tool from the left toolbar
Drawing trendlines and connecting swing points for pattern recognition
Accessing built-in pattern recognition tools through the Indicators menu
Practical examples using futures charts across multiple timeframes
This tutorial is designed for futures traders, day traders, and swing traders who want to capitalize on momentum moves and volatility expansion using technical breakout strategies.
The methods discussed may help you identify high-probability breakout setups, manage entries with proper confirmation, and set risk-appropriate stops and targets across multiple markets and timeframes.
Learn more about futures trading with TradingView: optimusfutures.com
Disclaimer
There is a substantial risk of loss in futures trading. Past performance is not indicative of future results. Please trade only with risk capital. We are not responsible for any third-party links, comments, or content shared on TradingView. Any opinions, links, or messages posted by users on TradingView do not represent our views or recommendations. Please exercise your own judgment and due diligence when engaging with any external content or user commentary.
This video represents the opinion of Optimus Futures and is intended for educational purposes only. Chart interpretations are presented solely to illustrate objective technical concepts and should not be viewed as predictive of future market behavior. In our opinion, charts are analytical tools, not forecasting instruments.

Gold Context: Strong Short Covering & The New Money TestFOREXCOM:XAUUSD COMEX_MINI:MGCG2026 COMEX:GC1!
Analysis
1. Market Context (Early US Session)
We are witnessing strong Short Covering in the early US session, continuing the momentum from yesterday where Gold traded above the previous multi-day range.
• The Driver: The vertical nature of the move confirms the exit of old shorts. However, for this to sustain, we must see this emotional energy transition into New Money Buying (Initiative) .
• Observation: If price can hold these higher levels without immediate rejection, it confirms that "New Money" is entering to defend the breakout.
2. Structure & Targets
• Bias: I remain on the Long side at this moment. The breakout above the recent balance suggests the path of least resistance is toward the higher area (ATH).
• Condition: We need to see acceptance, not just a "look and fail." Continued short covering will naturally pull the auction higher.
3. The Risk (Liquidation)
• Support Check: If the buying dries up and we see Long Liquidation , the auction will likely rotate back to test the 4300 support area. This would be a test of the breakout's validity.
Plan & Execution
• Focus: Monitoring for volume and time acceptance at these highs.
• Invalidation: Loss of momentum returning to 4300.
Talk to you for the next update. b]Analysis
1. Market Context (Early US Session)
We are witnessing strong Short Covering in the early US session, continuing the momentum from yesterday where Gold traded above the previous multi-day range.
• The Driver: The vertical nature of the move confirms the exit of old shorts. However, for this to sustain, we must see this emotional energy transition into New Money Buying (Initiative) .
• Observation: If price can hold these higher levels without immediate rejection, it confirms that "New Money" is entering to defend the breakout.
2. Structure & Targets
• Bias: I remain on the Long side at this moment. The breakout above the recent balance suggests the path of least resistance is toward the higher area (ATH).
• Condition: We need to see acceptance, not just a "look and fail." Continued short covering will naturally pull the auction higher.
3. The Risk (Liquidation)
• Support Check: If the buying dries up and we see Long Liquidation , the auction will likely rotate back to test the 4300 support area. This would be a test of the breakout's validity.
Plan & Execution
• Focus: Monitoring for volume and time acceptance at these highs.
• Invalidation: Loss of momentum returning to 4300.
Talk to you for the next update.

Multi Top - Multi Bottom. Go Next Your Golden Shift4500 to take a bag (supply area). 4400 - to jingle that.
GOLD (XAU) Outlook - Prediction (12 NOV)GOLD (XAU) Outlook - Prediction
📊 Market Sentiment
Market sentiment for GOLD remains strongly bullish, primarily driven by central bank accumulation. Since 2023, global central banks led by China have been purchasing gold aggressively, creating a durable demand base. With the FED preparing to initiate QE while inflation remains elevated, I think risk assets like GOLD could outperform as the USD (DXY) weakens. This macro setup continues to support a long term bullish narrative.
📈 Technical Analysis
Price has been retracing since October 20, which I think was a healthy correction following a strong expansion. As mentioned in my previous GOLD outlook, price appeared to be retesting the Weekly Value Gap and accumulating within that zone. In my opinion, this accumulation phase seems to have ended, and the market looks ready to continue higher.
📌 Game Plan - Prediction
Price has broken out of the accumulation zone and started expanding upward. I plan to enter after a retest near the key zone around $4060. It may dip toward $4027, which I consider a discount zone. I intend to scale in between $4060 and $3950, with invalidation if the daily candle closes below $3900.
💬 Follow my Substack profile for detailed insights and extended analysis.
⚠️ Disclaimer: For educational purposes only. This is not financial advice.

Gold futuresOver the past four weeks, gold futures posted significant gains and hit a new all-time high. The uptrend remains intact formally, but from a historical perspective, it has already lasted for more than 1000 days, leaving limited room for further upside.
Long-term trend: Up
Resistance level: 4800
Support level: 3900

Quantum's Gold Trade Plan 12/26/25CSE:GC 📸
🟢 Buyside dominate w/ POC at 4537
🔴 Sellside minimal w/small cluster 4515-4527
📍Premarket 🧲4537 ⚠️ /// 4500↕️ 🐂/🐻 Flip
📈🧲 at All Time Highs???
📉🧲at 4537 - 4531 - 4521/4520 - 4516
💡Strong upside move breaking ATH overnight. As long as buyside is remains dominate would like to pullback to pivot at 4537 or at least imbalance test at 4550 to look for a long entry. Will wait for NY opening range to be established first.

15 min wow bullish alignment mgc most timeframe trading up. this scenario the 15 min gave us confirmation after mitigating the 1hr that at 4hr. lets see how this plays out

Gold presses against key resistance as traders position for upsi
Current Price: $4361.40
Direction: LONG
CRITICAL: You MUST choose either LONG or SHORT. NEUTRAL is FORBIDDEN and will cause your post to be rejected.
Confidence Level: 62% (Several professional traders consistently lean bullish while social sentiment is thin; conviction exists but with holiday liquidity risk)
Targets:
- T1 = $4420
- T2 = $4475
Stop Levels:
- S1 = $4320
- S2 = $4280
**Wisdom of Professional Traders:**
This analysis synthesizes insights from the collective wisdom of professional traders and market experts. When I look across the trader discussions, a clear theme shows up again and again: gold remains in a strong broader uptrend, and multiple traders are focused on buying pullbacks rather than fighting the trend. The crowd wisdom here matters, because repeated alignment around key levels often defines where price is likely to move next.
**Key Insights:**
Here’s what’s driving this setup. Many professional traders repeatedly described gold as bullish on weekly and macro timeframes, with several pointing to upside targets clustered around the 4,450 to 4,550 zone if momentum resumes. Even traders who acknowledged short-term consolidation emphasized that pullbacks are viewed as opportunities to get long, not reasons to flip bearish.
What also stands out is how often traders referenced the 4,350–4,380 area as important support. Price is currently holding just above that zone, which tells me buyers are still active. When I see repeated commentary like “can’t short this market” and “only looking to buy dips,” that reinforces a LONG bias for the coming week.
**Recent Performance:**
Gold has climbed steadily into late December, trading around $4,361 after pushing toward the $4,400 area. The move hasn’t been explosive, but it’s been persistent, with higher lows forming despite lighter holiday volume. That kind of price action usually signals accumulation rather than distribution.
**Expert Analysis:**
Several professional traders highlighted that gold remains above key weekly trend structures, even while daily charts pause. I noticed multiple traders mentioning resistance near $4,400–$4,410, but importantly, they framed it as a hurdle to clear rather than a level to aggressively short. Others referenced targets near $4,500 if inflation or geopolitical headlines reignite safe-haven demand, suggesting upside remains the dominant theme.
**News Impact:**
Recent macro commentary around inflation, Federal Reserve expectations, and ongoing geopolitical uncertainty continues to support gold as a hedge. While day-to-day headlines may cause noise, traders generally see the macro backdrop as supportive rather than hostile for gold prices over the next several sessions.
**Trading Recommendation:**
Putting it all together, I’m staying LONG gold this week. I like positioning on shallow dips above $4,350 with targets toward $4,420 first and $4,475 if momentum builds. Risk is clearly defined with stops below $4,320 and a final line in the sand near $4,280. The confidence isn’t extreme due to mixed short-term signals and thin liquidity, but the weight of professional trader consensus keeps me leaning bullish.

GC | Week 52 | 1hr chartT.A explained -
BackSide (BS)
FrontSide (FS)
Inverse BS (Inv.BS)
Inverse FS (Inv.FS)
BS & FS levels are expected support when dashed lines, tested when dotted and resistance when solid lines.
The inverse is true for the Inv. BS Inv. FS levels, they are resistance as dashed lines, tested as dotted and support as solid lines.
Monthly timeframe is color pink
weekly grey
daily is red
4hr is orange
1hr is yellow
15min is blue
5min is green if they are shown.
strength favors the higher timeframe.
2x dotted levels are origin levels where trends have or will originate. When trends break, price will target the origin of the trend. its math, when the trend breaks, the vertex breaks too so the higher timeframe level/trend that breaks, the more volatility there could be as strength in the orders flow in to fuel the move.

FVG RejectionCaught this trade during the Sunday Sydney session. FVG created took out a swing high. FVG was retested and rejected. Took the trade at the BOS and targeted Buy Side Liquidity. Stop Loss was below the FVG (until I moved it to Break Even.

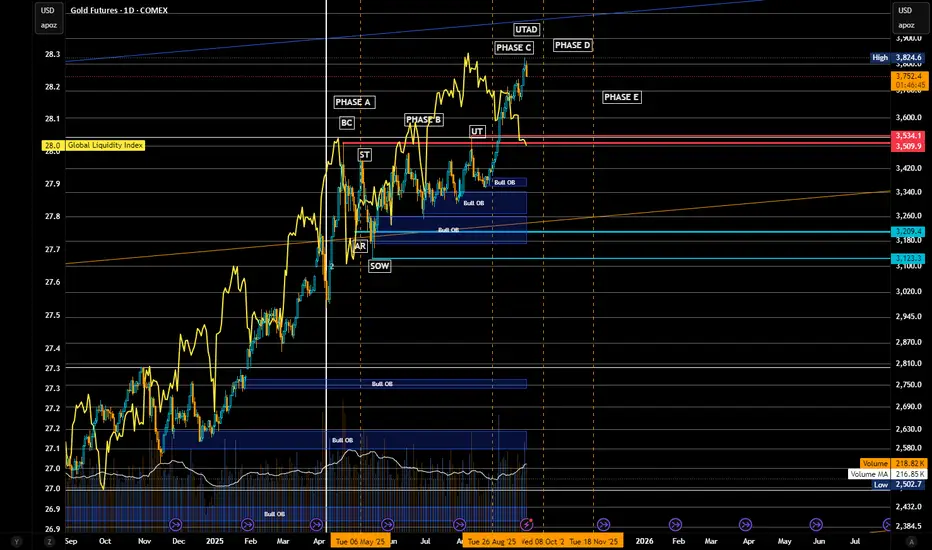
Gold Futures (GC) – “Top Is In” Schematic ReviewExecutive Snapshot 🧭
Primary stance: Bearish swing/top-in thesis (Wyckoff Distribution complete via UTAD).
Bias strength: High, while price remains below 3,825–3,860 and fails to accept above.
Game plan: Fade strength into supply; look for Phase D → E breakdown confirmation → target 3,534/3,509 → 3,209 → 3,123 then extended 2,970–2,795 if momentum accelerates.
Multi-Framework Confluence:
A) Wyckoff (your schematic) ♟️
Phases:
A/B: BC/ST established range highs; AR/SOW tagged mid/low of range.
C: UT → UTAD (new high on diminishing relative spread & mixed volume).
D (now): Throwback rallies holding beneath UTAD; look for LPSY near 3,760–3,825; failure → Phase E markdown.
Validation: Lower highs after the UTAD and repeated rejections of the supply shelf 3,760–3,825.
Confirmation trigger: Break and accept below ICE/Creek = 3,534–3,509 (your pink band) → distribution confirmed.
Macro Frame 🌐
Gold’s cyclical up-leg is extended; near-term macro supports a pause/reversion:
Real yields/beta & USD shocks can catalyze a value-seeking dip.
COMEX time-and-price run suggests heat above without equivalent build in value → mean-revert first, trend later.
Invalidation & Risk:
Hard invalidation (swing): Weekly close > 3,860 and acceptance above for 2–3 sessions (no swift rejection).
Soft invalidation (tactical): Daily close back inside 3,760–3,825 after a breakdown → step aside, wait for next LPSY.
Position/Risk Template:
Initial risk: above 3,825 (or 3,860 for wider swing).
Size: start ½–⅔ unit at first tag/reject; complete size on breakdown retest of 3,534–3,509.
Trailing: swing stop > last LPSY high once 3,534 is lost.
Momentum & Internals (Quick Read) ⚙️
RSI/ultimate RSI (your panels): persistent bearish divergence into UTAD zone.
MACD: high, curling; ripe for signal cross on daily if price slips under 3,600s → 3,534.
Squeeze/Momentum: elevated; release down would align with the distribution thesis.
Execution Checklist ✅
Pre-break:
Fade 3,760–3,825 on rejection candles/footprint absorption.
Track delta & volume—no expansion = stronger distribution read.
Break event:
Daily close < 3,534 → reduce discretion, execute plan; seek retest → LPSY to add.
Manage:
Cover +30–50 handles into 3,209–3,180; roll runner.
Data to watch: USD DXY spikes, GLD OI/put skew, dealer GEX flips around GLD 300.
One-Page Risk Map 🗺️
Bearish while: < 3,825–3,860.
Confirmation: < 3,534–3,509 (close/accept).
Targets: 3,209 → 3,123 → 2,970 → 2,795 → 2,541.
Stop/Invalid: > 3,860 w/ acceptance.
Marked UTAD and supply stack 3,760–3,825 present a clean risk-defined top. Until the market accepts above 3,860, the probabilistic path favors Phase E markdown back toward 3,2xx value and possibly the 2,9xx–2,795 extension if momentum breaks loose.
Gold update 🚨 Gold Traders: Don’t Get Trapped in the Holiday “Thin Tape”! 🚨
We’re heading into the final full week of 2025, and the Order Flow is telling a fascinating story. While retail is dreaming of a "Santa Rally," the Heatmaps are showing where the real battle is being fought. 🔍
Here is the Breakdown for Next Week:
✅ The Resistance: Gold is hitting a wall at $4,385 - $4,395. We’re seeing heavy sell-side absorption here. Unless we get a high-volume breakout, expect a "fake-out" at these highs. 🛑
✅ The Value Zone: I’m watching the $4,297 - $4,310 area closely. This is where the institutional "Buy" orders are stacked. A dip into this zone could be the perfect entry for the next leg up to $4,400. 📈
✅ The Risk: It’s Christmas week! 🎄 Liquidity will be low. Remember: Low volume = High Volatility. Don't let a "Stop Run" knock you out of a good position. Keep your stops wide or your position sizes small.
My Plan: I’m a buyer on the dips near $4,300, targeting a year-end retest of the All-Time Highs. 🚀
What are you trading this week? Tech rotation or Gold safe-haven? Let me know in the comments! 👇
#Trading2025 #GoldFutures #OrderFlow #PriceAction #NinjaTrader #Bookmap #InvestSmart
