Silver Futures (Nov 2027)
No trades
Market insights

SilverF) Bullish trend analysis Read The captionSMC Trading point update
Technical analysis of Silver Futures (SI) – 1H chart using SMC + Fibonacci OTE + EMA trend continuation.
⸻
Market Context
• Bias: Bullish continuation
• Strong impulsive rally → clear break in structure (BOS)
• Price is holding above EMA 50 & EMA 200
• Current price action = consolidation / pullback, not distribution
⸻
Why Price Is Pulling Back
• After the impulse, price is pausing near short-term equilibrium
• This is a rebalancing move before continuation
• Pullback is occurring inside discount, which favors longs
⸻
Key Buy Zone (Blue Area)
~71.80 – 72.30
This zone is high-probability due to:
• SMC demand / order block
• Fib OTE zone (0.705 – 0.79)
• EMA 50 support (≈72.03)
• Prior impulsive origin (base of the move)
This is where smart money typically reloads longs.
⸻
Fibonacci Logic
Measured from the most recent impulse low → high:
• 0.5 / 0.62 = shallow pullback
• 0.705 – 0.79 = optimal trade entry (OTE)
Ideal for trend continuation setups
⸻
Trade Idea (Continuation Long)
Buy on confirmation inside demand
• Entry: 71.90 – 72.30
• Stop Loss: Below demand (~71.30)
• Targets:
• TP1: 74.00 (range high / structure)
• TP2: 77.65 (first marked target point)
• Final TP: 80.05 (upper liquidity / extension target)
Risk–Reward: ~1:3 to 1:5
⸻
Confirmation Triggers (Important)
Wait for at least one:
• Bullish engulfing or strong rejection wick from the zone
• Lower-timeframe CHoCH
• Failure to accept below the OTE zone
• Momentum expansion after tapping demand
⸻
Invalidation
• 1H close below ~71.30
• Acceptance below EMA 50 + demand zone
If this happens → bullish idea is invalid, and price may rotate deeper.
⸻ Mr SMC Trading point
Summary
This is a textbook bullish continuation setup:
• Strong impulse
• OTE + demand + EMA confluence
• Clear upside liquidity targets
Please support boost this analysis

SI (silver) UpdateSI MFI went oversold Thu night so I bought some calls Friday, flipped them on open today. I think it will melt up until MFI goes overbought, but I didn't re-enter because I don't expect a big pop up overnight.
SLV calls are expensive, but silver can pop up big, so if you time it right there is definitely money to be made. My return was over 100% with Friday's calls (one week of premium).
Timing is key, not playing the melt up. I finally figured out how to post on my phone, so maybe next time I'll post the trade when I enter.

Silver OverboughtSilver looks overextended here, with a bear wedge clearly forming, who knows where this thing will land if the structure continues forward as seems likely, which is to the downside

Silver Bells, Silver Bells, Silver all the way...Silver Bells, Silver Bells
Silver all the way
Oh what fun it is to ride
"in a One Horse" open sleigh
Silver Bells, Silver Bells
Silver all the way
Oh what fun it is to ride
"in a One Horse" open sleigh
Dashing through the snow
"In a One Horse" open sleigh
Over the hills we go
Laughing all the way
Bells on Bobtails ring
Making spirits bright
What fun it is to ride and sing
A Silver song tonight...
Happy Silver New Year!

Silver Global Cup and Handle Pattern targets $653Fiwithb the rst significant trend line was breached soon after silver broke the 14-year record of $49.28.
The second significant trend line was breached today. A trend line was drawn from each declining peak from the 1980 high through the 2011 high and extended to the present. It is incredible that the last trend line seems headed to a rendezvous with the $653 target for the Global Cup and Handle.

Silver on its way to 89.51 $SI_FWith the depth of the rounded bottom looking for a pause on the #silver futures $SI_F at $89.51 then up to $100 or higher.

The 2025-2026 Silver Rally + 3-Step Rocket Booster Strategy--
Let me tell you
the amount of research i did
just to be able to confidently write
this message to you has been insane and hard.
And i went down a rabbit hole.
I couldn't stop but i had to come out
for fresh air.
This is what i have found... during
this data of research this is
the most fear i have ever felt.
Let me tell you why...
When i began trading around
2017 silver was one of the first
assets i bought on
margin.
I did this during February
around 2018
i lost all my money on this trade
i remember i kept buying silver COMEX:SI1!
and the price kept crashing..
today the margin level for silver
is high!!
At that time i could only
buy like "x2" margin.
At that time this was considered
very volatile
and expensive.
It was so expensive that
you could lose
your money in one bad trade
Today the margin level is super high around
"20x " minimum bro
the amount of fear from the past
has stuck with me
because at the time
i risked all i had it wasn't much
but i had to go all in to
learn how to trade well.
This was a dark peroid of my life
and now full circle
i cant believe it
am back here again
but this time
am truly humbled
and my fear now is way more higher..
if this trade doesn't go well
am done...
am hanging my gloves with this trading stuff
and going to work a job
at a fast food business
atleast i can eat the food for free
in the back.
Even if am mopping floors and taking out
trash.
But now am going to put in something
special the rocket booster
strategy it has 3 steps:
-The price has to be above the 50 EMA
-The price has to be above the 200 EMA
-The price should increase in momentum or gap up
this last step is measured
by the RSI+Stochastic indicator.
This has been one of the most
challenging articles
because it reminds me
to be humble
and sharing it with you is not easy
so am wishing you happy holidays
because sharing this with you is my gift
and am saying thank you for
following me
and trusting me to help you
on your trading
the rocket booster
strategy is the reason
why i have reached this far on
my trading journey...
In other news the oil and gas
companies seem to be trending
up for example companies like NASDAQ:FANG
follow the rocket booster
strategy and looks like a good buying investment
Long term
If you want you can learn more
about oil and gas companies.
Because i believe this is another trend
going on in the back ground.
Rocket boost this content to learn more
thank you for reading.
Happy Holidays and enjoy!
Disclaimer: Trading is risky please learn about
risk management and
profit taking strategies
Also feel free to use a simulation trading account
before you trade with real money.

Chandi Hi Chandi!Chandi is trying to reach till Chand!
Today Silver Future has touched 214583 which is Life time high as of now....
Today after giving a new LTH it is showing the sign of Distribution here.
If Silver Breaks down todays low which is 209000 which is a Support in 1 Hr time Frame it can turn Bearish as also we can see Divergence of RSI is Daily Time Frame.
Once Silver Turns Bearish we can see the level of 180000 in next few weeks.
level of 180000 will be very crucial as if it breaks this level also next stop will be 140000
and if it takes Support from 180000 and shows Bullish Sign here one can invest small qty here well 140000 will be a very good level to invest in Silver.
Lets see!

SILVER: Still Bullish! Buy The Dip!In this Weekly Market Forecast, we will analyze the XAGUSD (SILVER) for the week of Dec. 15 - 19th.
Silver .... still strong! With a weakened USD due to an interest rate cut by the Fed, there are no headwinds to offer resistance.
Be mindful that this market is overextended, and a pullback is pending.
There is a +FVG to draw price to it below. That would make a great area to look for dip buying opportunities.
Enjoy!
May profits be upon you.
Leave any questions or comments in the comment section.
I appreciate any feedback from my viewers!
Like and/or subscribe if you want more accurate analysis.
Thank you so much!
Disclaimer:
I do not provide personal investment advice and I am not a qualified licensed investment advisor.
All information found here, including any ideas, opinions, views, predictions, forecasts, commentaries, suggestions, expressed or implied herein, are for informational, entertainment or educational purposes only and should not be construed as personal investment advice. While the information provided is believed to be accurate, it may include errors or inaccuracies.
I will not and cannot be held liable for any actions you take as a result of anything you read here.
Conduct your own due diligence, or consult a licensed financial advisor or broker before making any and all investment decisions. Any investments, trades, speculations, or decisions made on the basis of any information found on this channel, expressed or implied herein, are committed at your own risk, financial or otherwise.

SI | Wk 51T.A explained -
BackSide (BS)
FrontSide (FS)
Inverse BS (Inv.BS)
Inverse FS (Inv.FS)
BS & FS levels are expected support when dashed lines, tested when dotted and resistance when solid lines.
The inverse is true for the Inv. BS Inv. FS levels, they are resistance as dashed lines, tested as dotted and support as solid lines.
Monthly timeframe is color pink
weekly grey
daily is red
4hr is orange
1hr is yellow
15min is blue
5min is green if they are shown.
strength favors the higher timeframe.
2x dotted levels are origin levels where trends have or will originate. When trends break, price will target the origin of the trend. its math, when the trend breaks, the vertex breaks too so the higher timeframe level/trend that breaks, the more volatility there could be as strength in the orders flow in to fuel the move.

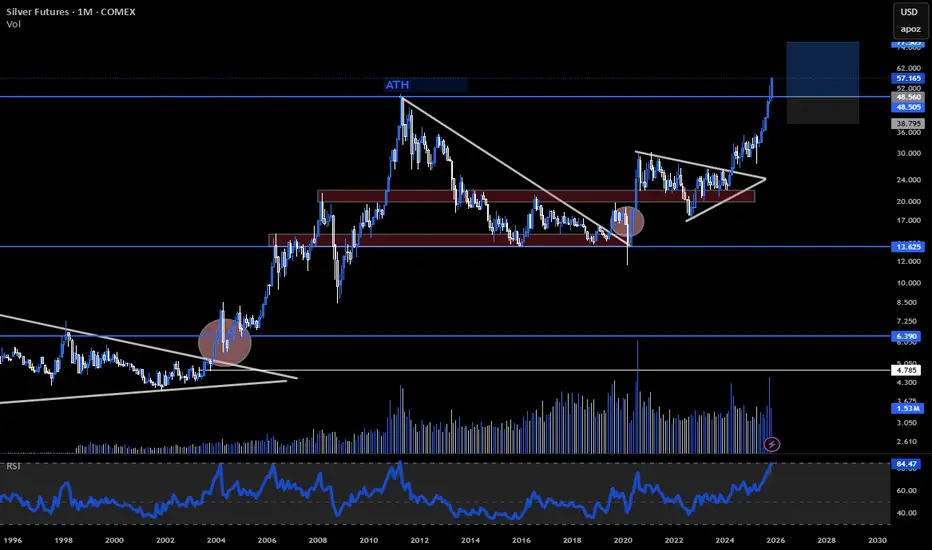
SILVER (XAGUSD): Multi-Decade ATH Breakout Confirmed. $80+ Next?
The Thesis: After decades of forming a colossal base, Silver (XAGUSD) has confirmed a structural breakout above its multi-decade all-time high resistance zone, previously capped between $49.76 and $55.00. This is not a short-term trade; it marks the beginning of a new secular bull market for the metal.
Technical Confirmation
The Breakout: A sustained weekly/monthly close above the $55.00 level is critical and confirms the elimination of the 45-year resistance ceiling.
Measured Move Target: The completion of this massive basing pattern projects a minimum initial target toward the $75.00 - $80.00 range.
Momentum: Key momentum show strong upward conviction, indicating that this move is supported by heavy institutional volume.
Fundamental Drivers
Structural Deficit: Global mine supply and recycling are chronically insufficient to meet demand. The Solar/Photovoltaic and Electric Vehicle (EV) industries are creating a massive, unyielding demand floor. Analysts project a fifth consecutive year of significant supply deficit.
Monetary Tailwinds: Expectations of a dovish Fed and eventual rate cuts are pushing investors toward non-yielding assets. The Gold/Silver Ratio is falling, suggesting silver is playing catch-up to gold with amplified gains.
Risk Management
The current bullish thesis would be heavily invalidated if XAG/USD sees a decisive weekly close back below the psychological $50.00 level, which was the prior critical resistance turned support.
SILVER BLOWOFF TOP COMING! $SLV AMEX:SLV – Blow-Off Move Setting Up (Extreme Extension Alert)
Silver is starting to show classic blow-off characteristics, and at this point the risk is no longer on the long side — it’s on the late chasers.
🔹 Why This Is a Blow-Off Setup:
Price is well outside the upper Bollinger Band — a sign of emotional, momentum-driven buying.
AMEX:SLV is more than $10 above the 9 EMA, an extreme stretch by any historical metric.
Momentum has gone vertical, not constructive — this is what end-of-move behavior looks like.
These conditions don’t mean it collapses instantly — they usually mean volatility spikes and risk shifts hard to the downside.
🔹 How I’m Approaching This (Very Important):
I will NOT short weakness.
If AMEX:SLV fades overnight or opens flat/red, I’ll stay away.
What I want to see is a gap up — ideally a large one — that uses up most of its intraday ATR early.
That’s when blow-off reversals tend to trigger.
🔹 Execution Plan:
1️⃣ Trigger: Gap-up exhaustion move at the open.
2️⃣ Confirmation: Failure after ATR expansion / rejection of highs.
3️⃣ Vehicle: Puts, not stock — defined risk only.
4️⃣ Mindset: This is a fade of excess, not a long-term thesis.
🔹 Big Picture:
Blow-offs don’t end with a whisper — they end with euphoria and poor risk/reward.
Silver has gone from trend to mania, and that’s when traders need to flip from chasing to waiting patiently.


Silver.. Enough Momentum Left for Upward MoveSilver has given good returns over the past One year. over and above 100%+. Is there any fuel left for upward move and chances of reaching 100$.
Further analyzing on Monthly Chart, momentum is very bullish. Though short term correction is expected (my personal view), overall momentum is bullish.
Looking at the consolidation of Few Fibonacci ratios, and based on previous experiences, expecting silver futures to reach one of the above levels highlighted and rally beyond.
This is completely my personal point of view.

Silver - Next StopSilver has moved sharply higher, and the explosive upward trend is still ongoing.
The move from March to August 2020 can be considered wave 1 and the start of this bullish phase.
The question now is: where will we stop and potentially reverse? In other words, where might the next corrective phase begin.
Fibonacci levels drawn from the first wave and from the last significant corrective wave point to several key areas:
77 - the nearest level, which we have already passed without stopping
89 - the next most probable target
96 - applicable only to the current wave
Time will tell where the next stop occurs.
---
Please subscribe and leave a comment.
You’ll get new information faster than anyone else.
---

Silver Futures — What Confluence Looks Like on a 100% MoveThe Setup
Silver daily chart. From July lows near $38 to December highs above $78. A move like this doesn't happen without momentum and trend agreeing.
Glide tracks two dimensions:
- Momentum (RSI-based) — Is price accelerating or decelerating?
- Trend (ADX-based) — Is there directional strength?
When both align, that's confluence. When they don't, you wait.
Reading This Chart
The first LONG signal fired in late October around $46-47. At that point:
- RSI was rising (momentum building)
- ADX confirmed a bull trend (price above MA, trend strength above threshold)
The dashboard showed LONG BIAS. TP/SL levels appeared automatically.
Price ran. TP1 hit. TP2 hit. And it kept going.
Why Confluence Matters
Most traders watch RSI or ADX in isolation. RSI says "overbought" but price keeps running. ADX says "trending" but momentum is fading. The signals contradict each other.
Confluence solves this. You're not asking "what does RSI say?" — you're asking "do momentum and trend agree right now?"
When they do, you have an edge. When they don't, you stay out.
The Current State
Right now on this chart:
- Momentum: Rising
- Trend: Bull Trend
- Signal: LONG BIAS
- Targets: Active
Both dimensions still agree. The trend isn't over until confluence breaks.
How To Use This
Glide is a free indicator. Add it to your charts and watch how often price moves in the direction of confluence — and how often it chops when the dimensions disagree.
The goal isn't to predict. It's to wait for the market to agree with itself.

Silver MCX Futures — Intraday Technical Analysis for 23-Dec-25MCX:SILVER1!
Silver MCX Futures — Chart Pathik Intraday Levels for 23-Dec-2025
(If these levels add value to your trades, a quick boost or comment goes a long way in supporting this free content and keeping our trading community thriving!)
Silver Futures are trading near 212,888, moving sideways just above the zero line at 212,872 after a strong prior rally, making this band the key intraday pivot between continuation higher and a deeper pullback.
Bullish Structure
Longs remain active above the Long Entry band at 212,799–212,879 as long as price holds the Add Long Pos. level at 212,164 on dips.
Targets: 216,196 (Long Target 1 / primary booking zone) and 218,250 (Long Target 2 / extended move if bullish momentum resumes).
Control: Stops or trailing risk can be managed around 211,529–211,006 (Short Entry and Long Exit) to protect against trend failure.
Bearish Structure
Shorts become attractive on persistent rejection from 212,872–213,322 (zero line and Short Exit) with lower highs forming.
Downside focus: 209,548 (Short Target 1 near Day Bias – Buy 209,475) and 207,494 (Short Target 2) if sellers drag price back towards the prior demand zone.
Control: Quick covers are needed if price sustains above 213,322, where bearish structure weakens and a squeeze towards 216,196 can start.
Neutral Zone
212,872 is today’s inflection—expect choppy, stop-hunting action while silver oscillates between roughly 212,164 and 213,322 without decisive 15‑minute closes beyond either edge.
Every setup is designed for structure, plan, and logic—let the chart work for you, not your emotions.
Boost or comment if these levels help your preparation—help Chart Pathik keep delivering quality analysis to more intraday traders!

SI | Week 52 | 1hr chartT.A explained -
BackSide (BS)
FrontSide (FS)
Inverse BS (Inv.BS)
Inverse FS (Inv.FS)
BS & FS levels are expected support when dashed lines, tested when dotted and resistance when solid lines.
The inverse is true for the Inv. BS Inv. FS levels, they are resistance as dashed lines, tested as dotted and support as solid lines.
Monthly timeframe is color pink
weekly grey
daily is red
4hr is orange
1hr is yellow
15min is blue
5min is green if they are shown.
strength favors the higher timeframe.
2x dotted levels are origin levels where trends have or will originate. When trends break, price will target the origin of the trend. its math, when the trend breaks, the vertex breaks too so the higher timeframe level/trend that breaks, the more volatility there could be as strength in the orders flow in to fuel the move.


Silver MCX Future - Intraday Technical Analysis - 15 Dec., 2025MCX:SILVER1!
Silver MCX Futures — Chart Pathik Intraday Levels for 15-Dec-2025
(If these levels add value to your trades, a quick boost or comment goes a long way in supporting this free content and keeping our trading community thriving!)
Silver Futures are trading near 192,615, rebounding after a vertical sell-off and now hovering just below the zero line at 192,851 and the Long Exit at 193,361, turning this band into the key intraday decision zone. The market is trying to stabilise after liquidation from the 199,981 region, with both trapped longs and fresh shorts watching this pivot closely.
Bullish Structure
Longs activate above the Long Entry level at 197,207 only after price reclaims 193,361–194,485 (Long Exit plus Short Entry zone) and sustains above the zero line at 192,851.
Targets: 199,981 (Long Target 1 / primary booking zone) and 204,389 (Long Target 2 / extended upside if short-covering accelerates).
Control: Any counter-trend long attempts from near 192,000–192,851 should keep tight risk under 192,000 and ideally 190,000, because a fresh breakdown can quickly reopen lower targets.
Bearish Structure
Shorts remain preferred while price trades below 193,361–194,485 and especially on rejection from this resistance band after the bounce.
Fresh shorts open on rallies into the Short Entry at 194,485, or if the current rebound fails and candles slip back convincingly under the zero line at 192,851.
Targets: 185,721 (Short Target 1 / first profit zone) and 181,313 (Short Target 2 / extended downside if selling pressure resumes).
Neutral Zone
192,851 is today’s inflection—expect whipsaws and stop-hunting behaviour while silver oscillates between roughly 192,000 and 193,361 without decisive 15‑minute closes beyond either edge.
Every setup is designed for structure, plan, and logic—let the chart work for you, not your emotions.
Boost or comment if these levels help your preparation—help Chart Pathik keep delivering quality analysis to more intraday traders!

Opportunity :: LONG Silver (Micro)As they say, data says it all.
Silver is systematically rising in a channel on the back of global news and issues.
Data suggests no weakness and upward targets of 189,000 and 202,000.
Good entry point could be near 179,000. This level is 5 EMA support too. Break down or closing below this level needs to be followed closely.

