My cvx playFor my crypto port, instead of crv im gonna make a play on cvx. This is 100% allocation. At this point I'm picking 1 alt and just keeping simple. CRV has massive upside but CVX has 4x the voting power and is below its intrinsic value by a lot while CRV is not. Lastly CVX supply is 100% diluted while CRV still has release of tokens until 3 billion supply. The $55 all time high would require a market cap extremely less probable than CVX hitting my goals. Ty
Market insights

#CVX/USDT : Long-Term Breakout Signals Massive Upside Potentia#CVX
The price is moving in a descending channel on the 1-hour timeframe and is expected to break out and continue upwards.
We have a trend to stabilize above the 100-period moving average again.
We have a downtrend on the RSI indicator, which supports an upward move if it breaks above it.
We have a key support zone in green that pushed the price higher at 1.81.
Entry price: 1.88
First target: 1.92
Second target: 2.00
Third target: 2.088
For risk management, don't forget your stop-loss and capital management.
The stop-loss is below the support zone in green.
Upon reaching the first target, take some profit and then change your stop-loss order to an entry order.
For any questions, please comment.
Thank you.

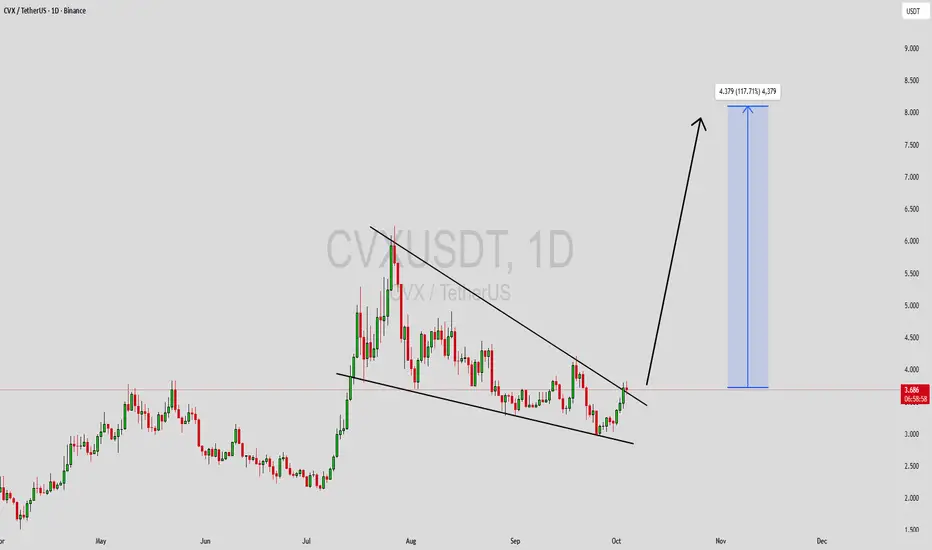
CVXUSDT 1D#CVX is moving inside a falling wedge pattern on the daily chart. In case of a breakout above the wedge resistance and the daily SMA50, the potential targets are:
🎯 $2.205
🎯 $2.589
🎯 $2.900
🎯 $3.211
🎯 $3.653
🎯 $4.216
❌ Invalidation: a daily candle closing below the wedge.
⚠️ Always remember to use a tight stop-loss and maintain proper risk management.

#CVX/USDT : Long-Term Breakout Signals Massive Upside Potentia#CVX
The price is moving within an ascending channel on the 1-hour timeframe and is adhering to it well. It is poised to break out strongly and retest the channel.
We have a downtrend line on the RSI indicator that is about to break and retest, which supports the upward move.
There is a key support zone in green at the price of 1.74, representing a strong support point.
We have a trend to stabilize above the 100-period moving average.
Entry price: 1.80
First target: 1.86
Second target: 1.92
Third target: 2.00
Don't forget a simple money management rule:
Place your stop-loss order below the support zone in green.
Once the first target is reached, save some money and then change your stop-loss order to an entry order.
For any questions, please leave a comment.
Thank you.

CVX/USDT 4H AnalysisThe price is forming a round bottom pattern after touching the lower boundary of the descending channel.
Currently showing signs of reversal with increasing volume.
If price breaks above the midline of the channel, a move toward 2.20–2.25 looks likely.
Confirmation: 4H close above 2.00
Targets: 2.20 – 2.25
Support: 1.80
💡 Watching for breakout confirmation and volume continuation before entry.

#CVX/USDT : Long-Term Breakout Signals Massive Upside Potentia#CVX
The price is moving within a descending channel on the 1-hour frame, adhering well to it, and is heading for a strong breakout and retest.
We have a bearish trend on the RSI indicator that is about to be broken and retested, which supports the upward breakout.
There is a major support area in green at 2.24, representing a strong support point.
We are heading for consolidation above the 100 moving average.
Entry price: 2.28
First target: 2.30
Second target: 2.34
Third target: 2.38
Don't forget a simple matter: capital management.
When you reach the first target, save some money and then change your stop-loss order to an entry order.
For inquiries, please leave a comment.
Thank you.

#CVX/USDT : Long-Term Breakout Signals Massive Upside Potentia#CVX
The price is moving in a descending channel on the 1-hour frame and is expected to break and continue upward.
We have a trend to stabilize above the 100 moving average once again.
We have a downtrend on the RSI indicator that supports the upward move with a breakout.
We have a major support area in green that pushed the price higher at 2.40.
Entry price: 2.57.
First target: 2.64.
Second target: 2.75.
Third target: 2.87.
To manage risk, don't forget stop loss and capital management.
When you reach the first target, save some profits and then change the stop order to an entry order.
For inquiries, please comment.
Thank you.

CVX under 3$ is a good investment.I believe CVX can form a higher low with this trend line acting as support at 3.10.
If BTC continue it's uptrend to $130k and more there's high change it will mark a low on CVX and many others. This will be an opportunity to maybe enter at an interesting price for the beginning of a possible alt season once BTC reach a definitive new all time high for this cycle to close the year.
Thank you.

CVXUSDT Forming Falling WedgeCVXUSDT is showing a well-defined falling wedge pattern on the chart — a classic bullish reversal formation that often signals the end of a downtrend and the start of a strong upward move. The price has been consolidating within narrowing trendlines, suggesting that bearish momentum is weakening while buying pressure is gradually increasing. This setup, combined with consistent volume activity, indicates that a breakout could be imminent and may lead to a substantial rally in the coming sessions.
With an expected gain of around 90% to 100%+, CVXUSDT has the potential to deliver a major bullish move once it breaks above the wedge resistance. Historically, similar setups in altcoins have triggered sharp rallies as traders and investors recognize the shift in trend. The good trading volume supports the likelihood of a strong follow-through if a breakout occurs, confirming growing market participation and confidence in this asset’s short-term outlook.
Investor sentiment around CVXUSDT appears to be improving, with more attention coming from both technical traders and long-term holders. This combination of technical strength, market interest, and supportive volume makes CVXUSDT an attractive setup for traders looking to capitalize on a potential breakout opportunity. Watching for a decisive move above resistance could open the door for an impressive bullish wave.
✅ Show your support by hitting the like button and
✅ Leaving a comment below! (What is You opinion about this Coin)
Your feedback and engagement keep me inspired to share more insightful market analysis with you!
CVXUSDT UPDATE#CVX
UPDATE
CVX Technical Setup
Pattern: Bullish falling wedge pattern
Current Price: $0.680
Target Price: $1.225
Target % Gain: 80.32%
NYSE:CVX is breaking out of a falling wedge pattern on the 1D timeframe. Current price is $0.680 with a target near $1.225, indicating around 80% potential upside. The breakout signals renewed bullish momentum with structure favoring continuation toward higher levels. Always use proper risk management.
Time Frame: 1D
Risk Management Tip: Always use proper risk management.

CVXUSDT 1D#CVX is trying to break out above the falling wedge resistance and the SMA100 on the daily chart. Keep an eye on it. In case of a solid breakout, the potential targets are:
🎯 $4.034
🎯 $4.295
🎯 $4.607
🎯 $4.919
🎯 $5.363
🎯 $5.928
⚠️ Always remember to use a tight stop-loss and follow proper risk management.

#CVX/USDT : Long-Term Breakout Signals Massive Upside Potentia#CVX
The price is moving within a descending channel on the 1-hour frame, adhering well to it, and is heading for a strong breakout and retest.
We have a bearish trend on the RSI indicator that is about to be broken and retested, which supports the upward breakout.
There is a major support area in green at 3.04, representing a strong support point.
We are heading for consolidation above the 100 moving average.
Entry price: 3.08.
First target: 3.12.
Second target: 3.18.
Third target: 3.25.
Don't forget a simple matter: capital management.
When you reach the first target, save some money and then change your stop-loss order to an entry order.
For inquiries, please leave a comment.
Thank you.

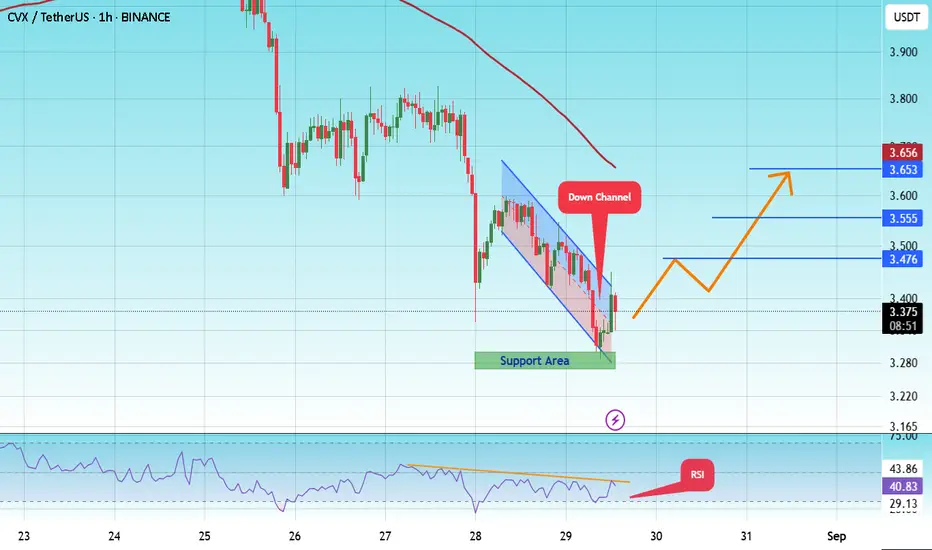
#CVX/USDT : Long-Term Breakout Signals Massive Upside Potentia#CVX
The price is moving in a descending channel on the 1-hour frame and is expected to break and continue upward.
We have a trend to stabilize above the 100 moving average once again.
We have a downtrend on the RSI indicator that supports the upward move with a breakout.
We have a major support area in green that pushed the price higher at 3.70.
Entry price: 3.82.
First target: 3.91.
Second target: 4.05.
Third target: 4.206.
To manage risk, don't forget stop loss and capital management.
When you reach the first target, save some profits and then change the stop order to an entry order.
For inquiries, please comment.
Thank you.

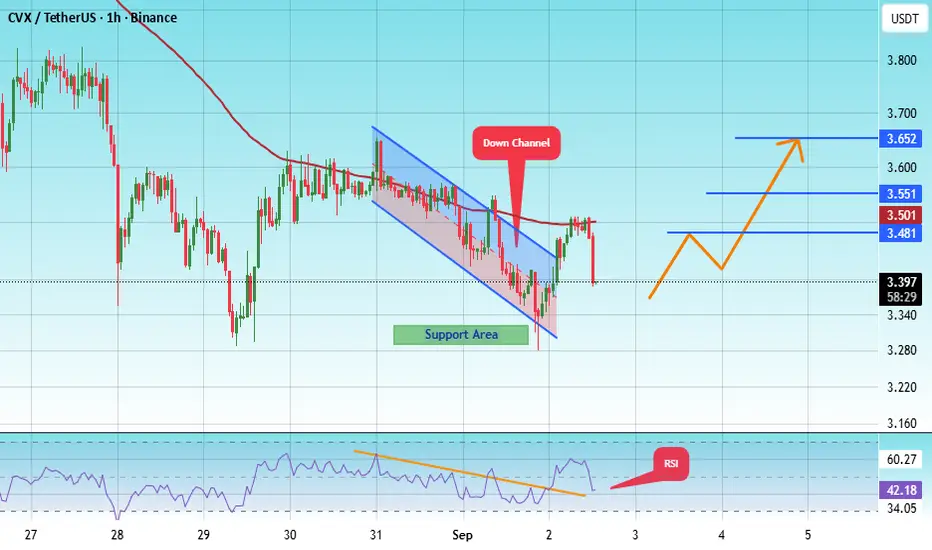
#CVX/USDT : Long-Term Breakout Signals Massive Upside Potentia#CVX
The price is moving within a descending channel on the 1-hour frame, adhering well to it, and is heading for a strong breakout and retest.
We have a bearish trend on the RSI indicator that is about to be broken and retested, which supports the upward breakout.
There is a major support area in green at 3.66, representing a strong support point.
For inquiries, please leave a comment.
We are in a consolidation trend above the 100 Moving Average.
Entry price: 3.70
First target: 3.76
Second target: 3.84
Third target: 3.91
Don't forget a simple matter: capital management.
When you reach the first target, save some money and then change your stop-loss order to an entry order.
For inquiries, please leave a comment.
Thank you.

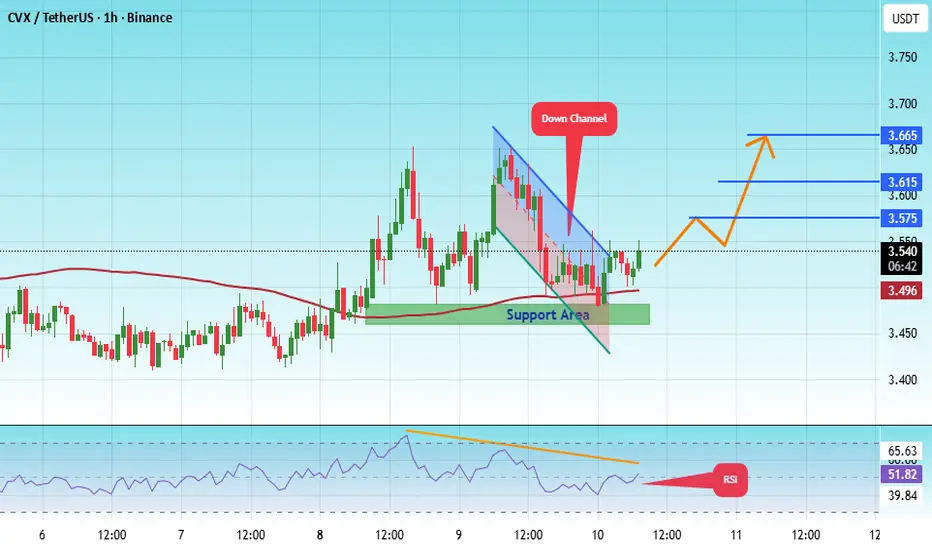
#CVX/USDT : Long-Term Breakout Signals Massive Upside Potentia#CVX
The price is moving within a descending channel on the 1-hour frame, adhering well to it, and is heading for a strong breakout and retest.
We have a bearish trend on the RSI indicator that is about to be broken and retested, which supports the upward breakout.
There is a major support area in green at 3.47, representing a strong support point.
For inquiries, please leave a comment.
We are in a consolidation trend above the 100 Moving Average.
Entry price: 3.52
First target: 3.57
Second target: 3.62
Third target: 3.66
Don't forget a simple matter: capital management.
When you reach the first target, save some money and then change your stop-loss order to an entry order.
For inquiries, please leave a comment.
Thank you.
CVXUSDT 1D#CVX has broken above the falling wedge pattern on the daily chart. A retest of the daily SMA100 and the wedge is expected before the next leg up, so consider buying in ladders. In case of a successful bounce, the targets are:
🎯 $4.295
🎯 $4.607
🎯 $4.919
🎯 $5.363
🎯 $5.928
⚠️ Always remember to use a tight stop-loss and follow proper risk management.

#CVX/USDT : Long-Term Breakout Signals Massive Upside Potential#CVX
The price is moving within a descending channel on the 1-hour frame, adhering well to it, and is heading for a strong breakout and retest.
We have a bearish trend on the RSI indicator that is about to be broken and retested, which supports the upward breakout.
There is a major support area in green at 3.35, which represents a strong support point.
For inquiries, please leave a comment.
We are in a consolidation trend above the 100 Moving Average.
Entry price: 3.49
First target: 3.49
Second target: 3.55
Third target: 3.62
Don't forget a simple matter: capital management.
When you reach the first target, save some money and then change your stop-loss order to an entry order.
For inquiries, please leave a comment.
Thank you.

#CVX/USDT : Long-Term Breakout Signals Massive Upside Potential
#CVX
The price is moving within a descending channel on the 1-hour frame and is expected to break and continue upward.
We have a trend to stabilize above the 100 moving average once again.
We have a downtrend on the RSI indicator that supports the upward move with a breakout.
We have a support area at the lower boundary of the channel at 3.30, acting as strong support from which the price can rebound.
We have a major support area in green that pushed the price upward at 3.27.
Entry price: 3.39.
First target: 3.47.
Second target: 3.55.
Third target: 3.65.
To manage risk, don't forget stop loss and capital management.
When you reach the first target, save some profits and then change the stop order to an entry order.
For inquiries, please comment.
Thank you.
#CVX/USDT : Long-Term Breakout Signals Massive Upside Potential#CVX
The price is moving within a descending channel on the 1-hour frame and is expected to break and continue upward.
We have a trend to stabilize above the 100 moving average once again.
We have a downtrend on the RSI indicator that supports the upward move with a breakout.
We have a support area at the lower boundary of the channel at 3.30, acting as strong support from which the price can rebound.
We have a major support area in green that pushed the price upward at 3.27.
Entry price: 3.34.
First target: 3.47.
Second target: 3.55.
Third target: 3.65.
To manage risk, don't forget stop loss and capital management.
When you reach the first target, save some profits and then change the stop order to an entry order.
For inquiries, please comment.
Thank you.
#CVX/USDT - Get your civix straight again!#CVX
The price is moving within an ascending channel on the 1-hour frame, adhering well to it, and is on its way to break it strongly upwards and retest it.
We have support from the lower boundary of the ascending channel, at 3.90.
We have a downtrend on the RSI indicator that is about to break and retest, supporting the upside.
There is a major support area in green at 3.80, which represents a strong basis for the upside.
Don't forget a simple thing: ease and capital.
When you reach the first target, save some money and then change your stop-loss order to an entry order.
For inquiries, please leave a comment.
We have a trend to hold above the 100 Moving Average.
Entry price: 4.19
First target: 4.33
Second target: 4.51
Third target: 4.73
Don't forget a simple thing: ease and capital.
When you reach the first target, save some money and then change your stop-loss order to an entry order.
For inquiries, please leave a comment.
Thank you.

The key is whether it can rise above 5.886.
Hello, fellow traders!
If you "Follow" me, you'll always get the latest information quickly.
Have a great day.
-------------------------------------
I don't necessarily recommend coins (tokens) that exhibit this behavior.
However, if you have spare funds or have or can generate significant profits from other coins (tokens), I think it's worth looking into these coins (tokens) when they're ready to trade.
The key is to maintain the price above the M-Signal indicator on the 1M chart.
-------------------------------------
(CVXUSDT 1M Chart)
CVX is showing signs of rising above the M-Signal indicator on the 1M chart.
If the price remains above the M-Signal indicator on the 1M chart, the upward trend is likely to continue.
-
(1W Chart)
After a prolonged period of sideways movement, the HA-Low and HA-High indicators on the 1W chart have converged, and the price has risen above the M-Signal indicator on the 1M chart.
Therefore, the 2.862-3.412 range is considered a support area.
If it falls below the 2.862-3.412 range, you should stop trading and wait and see how things go.
The DOM (60) indicator is forming at 5.886, so a break above this level is highly likely to initiate a stepwise uptrend.
Therefore, the key question is whether it can find support near 4.116 and rise above 5.886.
-
(1D chart)
The key question is whether it can find support in the 4.418-4.902 range and rise.
You should observe the transition from the M-Signal on the 1D chart > the M-Signal on the 1W chart > the M-Signal on the 1M chart.
If the M-Signal indicators are aligned correctly, a full-scale uptrend is likely to begin.
-
Thank you for reading to the end.
I wish you successful trading.
--------------------------------------------------
- Here's an explanation of the big picture.
(3-year bull market, 1-year bear market pattern)
I'll explain more in detail when the bear market begins.
------------------------------------------------------

CVX/USDT: Long-Term Breakout Signals Massive Upside PotentialFirstly, our Algo-based indicators are used to create this analysis: DON'T MISS US. FOLLOW US, COMMENT AND BOOST.
This weekly chart for CVX/USDT reveals a major bullish breakout from a long-term pattern, suggesting that the asset may be in the early stages of a significant new uptrend.
Analysis:
Descending Channel Breakout: For over two years, CVX has been trading within a clear descending channel. Recently, the price has decisively broken out of this channel to the upside, signaling a major shift from a bearish to a bullish market structure.
Pullback and Reentry: Following the initial powerful breakout, the price executed a healthy pullback. It found support right around the key 50% Fibonacci retracement level (approximately $4.262). The chart notes this area as a potential "REENTRY" point, especially with the formation of a "W-Pattern" (double bottom) on a smaller timeframe, which is a classic bullish reversal signal.
Confirmation Indicators:
The Innotrade MC Signal indicator at the bottom shows multiple "BUY" signals in the recent accumulation zone and the indicator line is now trending upwards, suggesting building momentum.
The RSI status confirms a "Bull Trend" on the daily and weekly timeframes, supporting a long-term bullish outlook.
Price Targets: Based on Fibonacci extension levels from the recent major swing, several targets are identified:
TP 1: $12.243 (aligns with the 127.20% extension and a previous key resistance level).
TP 2: $19.726 (aligns with the 161.80% extension).
Long-Term Projection: The aggressive black line projects a potential move towards the 2022 highs, indicating massive long-term potential if the bullish momentum continues.
Strategy:
Position: Long (Buy)
Entry: The current price level around $4.30 - $5.00 is highlighted as a strategic reentry zone following the successful pullback.
Targets: The primary targets are
12.243
∗
∗
a
n
d
∗
∗
12.243∗∗and∗∗
19.726.
Conclusion:
The breakout from a multi-year descending channel, combined with a successful retest of key support and confirming indicator signals, presents a compelling long-term bullish case for CVX. The current price level offers a strategic entry for a potential multi-hundred percent move towards the identified price targets.
Disclaimer: This analysis is for educational purposes only and should not be considered financial advice. Always conduct your own research and manage risk appropriately.

CVX Bullish DivergenceBINANCE:CVXUSDT
Trade Setup:
Target 1: 4.812 (0.786 Fibonnaci Golden Zone).
Target 2: 5.121 (0.618 Fibonnaci Golden Zone).
Target 3: 5.338 (0.5 Fibonnaci Golden Zone).
Target 4: 6.257 (0 Fibonnaci).
Stop Loss: 3.919 (above recent high, ~25% above current price).
RSI Analysis: The RSI is showing a bullish divergence, suggesting potential bullish momentum. The current RSI is around 11.86, approaching oversold territory, so caution is advised.
