ETHUSD – Bearish Channel Respect, Flag Breakdown SetupHi
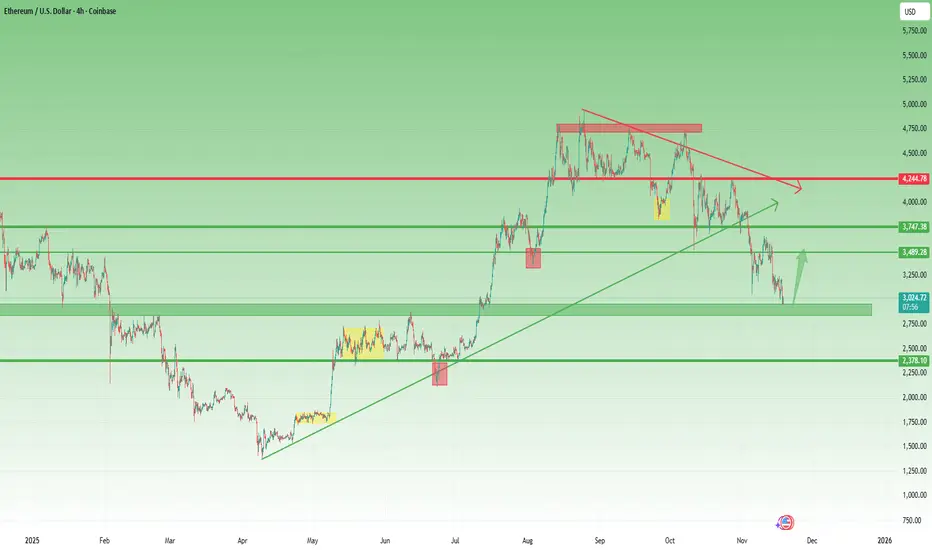
The chart illustrates a clean, structured bearish trend where price continues to respect a broad descending channel. Each major reaction level and pattern aligns well with the larger downtrend, indicating that sellers are still in control.
Price recently tapped a key flip area near the upper boundary of the channel, a crucial zone where previous support has turned into resistance. The rejection from this area confirmed a strong supply and initiated a sharp decline, marked on the chart as the flagpole.
Following the impulse drop, the market entered a consolidation range, forming a classic bear flag structure. Price corrected roughly one-third of the flagpole; a typical retracement depth before continuation in a downtrend.
The drawn projection suggests a bearish continuation from the consolidation box, with the price expected to break lower. If momentum follows the channel’s trajectory, ETH could descend toward the first S&D zone, which aligns with the lower boundary of the macro channel. The marked target around 2848 sits near a liquidity and demand cluster, making it a logical tap point before any significant reversal or larger breakout attempt.
Disclaimer: As part of ThinkMarkets’ Influencer Program, I am sponsored to share and publish their charts in my analysis.
Trade ideas

ETH Support Bounce With Target at 3250Ethereum is trading above a key support level after a strong downward move. Price is showing early signs of a potential bullish correction, with projections pointing toward a possible recovery target around $3250. A break above minor resistance could confirm upward momentum.

#ETHUSDT 2025–2028 OutlookFIB/GANN/classic Method Analysis
🔹 Gann Key Timing
According to Gann cycles,
25 November marks the start point of a new bullish attempt for ETH.
The $2,500 level is the critical line
if ETH closes a monthly candle below $2,500, it signals a significant change in the long-term roadmap.
Trend Setup
As long as ETH holds $2,500 and stays above the Blue Trend Line (A),
The bullish roadmap remains valid.
🎯 Roadmap Targets
Breakout Key:
$5,100 → Main breakout confirmation
Target 1:
$5,900 – $6,700 → First bullish leg (until Feb 2026)
Target 2:
$8,200 – $8,900 → Full bullish year if 2026 confirms
Target 3:
$10,150 → Extended top projection (2027–2028)
📌 All levels remain valid as long as ETH holds $2,500 on the monthly close.
💰 Trade Plan
We have active entries: from $3, XXX, with remaining buy levels between $1,500–$1,850–$2,150.
Set up invalidation: Monthly close below $2,500.
Max investment: 15 % of wallet.
Risk-Reward (R: R): ≈ 1: 2 or higher.
Example: If you hold 10 ETH, you risk about $10K vs. the potential upside of $35–70K.
⚖️ Summary
Support to hold: $2,500
Breakout confirmation: $5,100
Main targets: $5,900 → $6,700 → $8,900 → $10,150
Cycle: 2025 → 2028
Exposure: 15 % max
Always trade with a clear plan and controlled risk.
⚓ Renzo Tip
“The chart tells its truth to the patient — not the loudest trader, but the calm observer of time.”
🤲 Prayer
May Allah guide us to trade with clarity, protect our effort from greed and confusion,
and reward our discipline with lasting growth and wisdom.

ETH/USD (1H timeframe) ...ETH/USD (1H timeframe) on Coinbase, and it’s clearly showing a raisin trendline test with two downside “Target Points” already drawn. Let’s break it down:
---
🔍 Chart Analysis
Price is $3,441, sitting right on the ascending trendline.
Ichimoku Cloud is turning bearish (price below the cloud).
Trendline break looks likely — momentum is weak and candles are closing below the cloud.
Two target zones (downside) are marked on my chart.
---
📉 Bearish Breakdown Scenario
If ETH breaks and closes below the ascending trendline (~$3,440 area):
First Target (TP1): around $3,230 – $3,250
→ This aligns with previous horizontal support and midpoint of the last bounce.
Second Target (TP2): around $3,000 – $3,050
→ This is my deeper support zone — the next strong demand level on the chart.
---
⚠ Invalidation / Stop-Loss
If ETH closes back above $3,520 – $3,540, that would invalidate the bearish move (trendline reclaim + cloud flip).
---
🧭 Trade Summary
Entry (Breakdown): Below 3,440
TP1: 3,240
TP2: 3,020
SL: 3,540

Inverse HnSImagine if CRYPTOCAP:ETH inverse Head and Shoulder plays out.
This would be a good 2026 for CRYPTOCAP:ETH

ETHEREUM(ETH/USD): Consolidation – The Silence of VolatilityEven though ⚠️ETHEREUM is trading in a bearish trend since October, 📉
The pair has been in a deep consolidation, since the last 3 days 🗓️
The price is currently testing a strong horizontal support level where the price is consolidating. ↔️
Because the trend is strongly bearish, chances will be high to see
a further bearish continuation. 🐻
Your reliable confirmation will be a breakout and a 4H candle close below the underlined support. 🕯️
The next goal for the sellers will be 2840 🎯
Alternatively, the market may continue consolidating and trading within the range. 🔄

Ethereum Next Buying Move Read the Description The chart shows Bullish Trend
Support Zone: Around $3,200–$3,300 (clearly marked).
Target Level: Around $3,680–$3,700.
Price has bounced up from the support zone and is now moving toward that target region.
The chart’s drawn projection shows a bullish retracement into the upper zone before a potential pullback.
Short Setup Idea (Counter to the Bullish Move)
If you’re waiting for a short (sell) opportunity, the best area would be near the target resistance zone shown in your chart.
Short Entry Zone:
$3,650–$3,750
(This is the “Target Level” box
Confirmation to Look For
Wait for bearish confirmation before entering:
A rejection candle
Lower time-frame break of structure
Declining volume or momentum divergence on RSI/MACD

Did you Know ?!!!The price can form a head and shoulders pattern. If that is happen, expect a significant price increase.
Did you really think that profiting from the current bull run (a comprehensive upward market) would be easy? Don't be naive. Do you think they will let you buy, hold, and sell at low levels without any struggle? If it were that simple, everyone would be rich. But the truth is: 90% of you will lose. Why? Because the crypto market is not designed for everyone to win. They will shake you. They will make you doubt everything. They will panic you and sell at the worst possible moment. Do you know what happens next? The best players in this game buy when there is fear, not sell; because your panic gives them cheap assets. This is how the game goes: strong hands feed off weak hands. They exaggerate every dip, every correction, every sale. They make it look like the end of the world so that you abandon everything, and when the market starts up again, you'll sit there saying, "What the heck just happened?" This is not an accident. It's a system. The market rewards patience and punishes weak emotions. The big players already know your thoughts. They know exactly when and how to stir fear to make you give up. Because when you panic, they profit. They don't play the market. They play you. That's why most people never succeed. Because they fall into the same traps over and over again. People don't realize that dips, FUD (fear, uncertainty, doubt), and panic are all part of the plan. But the winners? They digest the noise. They know that fear is temporary, but smart decisions last forever. We've seen this hundreds of times. They pump the market after you sell. They take your assets, hold them, and sell them to you at the top, leaving you with nothing, wondering how it happened. Don't play their game. Play your own.

Why my ETH Holding has grownIn my last ETH update when the price was at $1700 and it looked as if the world was crashing, I mentioned I thought ETH was going to set a new ATH and so far it did but not at the price area I was expecting. I also did mention that I expected a return to around $3000 which is close to where it currently is.
All that said, I have had more time to look at the ETH chart and I think I may have been less bullish than I should have and as a result I grew my ETH holding since then. A few things I would like to point out.
One of which I mentioned in my last update. Looking at the ETH chart, it looks too similar to the gold chart with the ABC shakeout that gold went into before the massive rally.
Imagine holding GLD from Aug 2023 and selling in Oct 2023 because you could no longer handle the pain at this point below?
Now imagine those that held during this time, the fear and uncertainty they would have gone through. Personally, I think that is what the bookmakers are doing to ETH holders. If you believe the narrative that every asset will be tokenized and it ETH is the most trusted, then it makes sense to shake as many people out as possible before the GLD like rally.
Secondly, (although its a toss up) the action ETH is displaying now is similar to that of 2018 to 2020 and that we are in Sep-Oct of 2020 as you can see from the main chart and below as well.
Finally, the one bearish scenario is that we are doing the gold option but that we fail like this stock (PSNL) once we go and set a new ATM from here.
I had noticed the-same gold pattern and traded it but luckily I sold just before the failed breakout (so far) and you can clearly see the ABC pattern exactly like GLD before the breakout.
This is not a financial advice and I am not asking you to buy ETH. Just my opinion.
Please like, share and leave a comment.

Bearish continuation for ETHEREUMRetracement from new lows
Retest of the head and shoulders neckline
New lows incoming in the next weeks

ETH Hits 3K Target – Rebound Likely, Correction Not Over Though1. What Happened Since the Last Update
In my previous ETH analysis, I warned that if Ethereum loses the 3700 support zone, the probability of a drop toward 3000 becomes very high.
That scenario played out perfectly — the 3700 level failed, and price has now reached the 3K zone in recent days.
2. The Key Question Now
Is this the end of the correction, or just the first leg?
From my perspective, the overall correction is probably not finished yet. However, the 3000 area is a major support level, both technically and psychologically, so a bullish rebound from here is very likely.
3. Technical Outlook
Even inside a larger corrective structure, ETH can easily rally $230–$350, or even more, from these levels before deciding the next direction.
Key levels to monitor:
-Support: 3000 → then 2900 (preferred buy zone)
- Upside target: 3300
- Invalidation: A clean daily close below 2800 would weaken the bullish rebound scenario
4. Trading Plan
For the short term, I will look to buy preferably below 2900, targeting 3300 on the bounce.
This is not a long-term trend reversal call — it is a tactical long setup inside a broader correction.
5. Conclusion
ETH has reached the downside target discussed weeks ago. A rebound is likely from here, but the larger correction may not be over yet.
Short-term, buying dips around 2900 makes sense for a bounce toward 3300
ETH PERPETUAL TRADE SELL SETUP Short from $3505ETH PERPETUAL TRADE
SELL SETUP
Short from $3505
Currently $3505
Targeting $3452 or Down
(Trading plan IF ETH
go up to $3570 will add more shorts)
Follow the notes for updates
In the event of an early exit,
this analysis will be updated.
Its not a Financial advice

Maximum Fear = Maximum Opportunity. Wave 5 is Next
So where are we going? The chart has the target mapped out. The final Wave (5) is programmed to hit the 1.618 Fibonacci extension, which lines up perfectly with a retest of the upper trendline.
That puts us at ~$6,700.

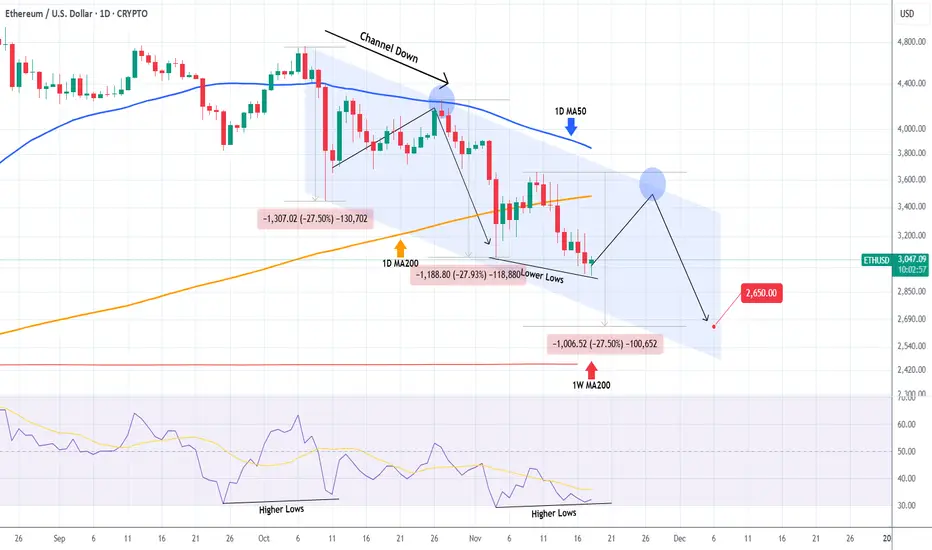
ETHEREUM Dead cat bounce incoming?Ethereum (ETHUSD) has been trading within a Channel Down since the October 07 High with both its Bearish Leg so far declining by -27.50% each.
As the 1D RSI is forming Higher Lows against the price's Lower Lows, i.e. a Bullish Divergence similar to October 11, it is possible to see a short-term bounce to test the 1D MA50 (blue trend-line) again (where the price got rejected on October 27), before it completes the -27.50% Bearish Leg projection.
The medium-term Target remains 2650.
---
** Please LIKE 👍, FOLLOW ✅, SHARE 🙌 and COMMENT ✍ if you enjoy this idea! Also share your ideas and charts in the comments section below! This is best way to keep it relevant, support us, keep the content here free and allow the idea to reach as many people as possible. **
---
💸💸💸💸💸💸
👇 👇 👇 👇 👇 👇
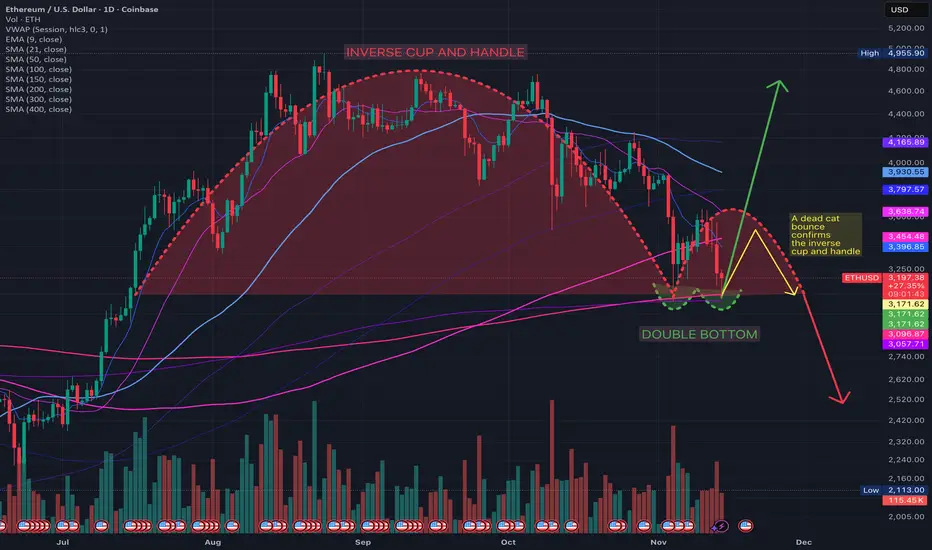
An inverse cup and handle or a double bottom?The chart is in a downtrend sitting on big support, and we have sketched the two obvious branching paths.
Where we are now
Price ~3.2k, below the 9/21/50/100/150/200-day MAs but sitting on the 300–400-day cluster around 3.05–3.10k.
That zone also matches the previous summer range = strong structural support.
Trend is still clearly down until at least the 200-day (~3.45k) is reclaimed.
⸻
Bull case – double bottom
The green double bottom is basically
Lows: ~3.05k–3.10k (twice).
Neckline: the swing high between them, roughly ~3.5–3.6k.
For this to be “real” we want:
decisive daily close above ~3.5–3.6k with volume.
Ideally 200-day MA reclaimed and flattening.
If that happens, measured move targets land somewhere in the mid-4ks, which lines up with your big green arrow.
Subjective odds right now: lower, maybe ~40% until that neckline breaks. We're trying to fight the prevailing downtrend; the pattern is only a potential bottom.
⸻
Bear case – inverse cup / rounded top
The red “inverse cup and handle” is basically a big rounded top since August
Series of lower highs, price rejected by falling MAs.
Current bounce is so far just a retest of that declining structure / MA cluster from below.
Bearish resolution would be
Failure somewhere under ~3.5k.
Breakdown below 3.0–3.05k (loss of 300–400-day MAs and range support).
That opens a move to the mid-2ks or worse, which is your red arrow scenario.
Given the existing downtrend and overhead MA gravity, continuation has the edge for now—call it ~60% vs the bullish reversal, unless the neckline is reclaimed.
⸻
Net take
Above ~3.6k with volume → double bottom validated, trend potentially flips up.
Below ~3.0k with conviction → rounded-top breakdown, expect acceleration down.
In between 3.0–3.6k you’re in Schrödinger’s pattern: chop, fakeouts, and pain.
So the market is basically asking: “Do we defend the 3k fortress, or do the MAs slowly grind everyone down?” The chart slightly favors the bears until price proves otherwise.
$ETH Trendline Hold + Higher Low – Ethereum Bull Run Reloaded!COINBASE:ETHUSD CRYPTOCAP:ETH Trendline Hold + Higher Low – Ethereum Bull Run Reloaded! 🚀
Altcoin Pioneers! 🔥 ETH just tagged the multi-year ascending trendline at ~$3,141 (the same line that perfectly caught every major low since 2022) and instantly bounced with a strong weekly green candle. Higher low officially confirmed!
- Trendline defended for the 6th time ✅
- With BTC.D crashing, ETH.D bottoming & falling wedge breakout on BTC, all stars are aligning for Ethereum to lead the next leg
- Close above $3,800 flips weekly structure → targets $5,000 → $7,000 → $10k+ in 2026
RSI resetting from oversold, volume building. This is the exact setup that launched ETH from $1,800 → $4,800 last cycle. Ethereum season is loading FAST! 🧪💥
#Ethereum #ETHBull #AltseasonLeader

“ETH – Bullish OB broken, downtrend resumes.”ETH Analysis – Nov 14 (VNShark)
Bullish OB: Fully broken — confirming that the previous bullish structure is no longer valid.
Retest: Price pulled back to the trendline and the broken OB zone, showing a clear bearish rejection — a logical sell signal.
Volume: Selling pressure continues to increase with each downside leg.
At this stage, VNShark prioritizes waiting for a pullback and observing the price reaction at the offer zone before considering a short entry aligned with the new downtrend.
This analysis is for educational purposes only and not financial advice.
#Tags
#ETHUSD #Ethereum #OrderBlock #SmartMoneyConcept #SMC #PriceAction #Volume #VNShark #CryptoAnalysis #MarketStructure #BreakOfStructure #Downtrend

ETH selling climax!ETH is approaching its final stages of selling. I will watch how price behaves in the marked fib levels.

$ETH – Bear Flag Developing as $BTC Cracks Key SupportEthereum ( CRYPTOCAP:ETH ) is forming a bear flag pattern just as Bitcoin ( CRYPTOCAP:BTC ) starts to crack under major support — this could get ugly fast if we lose the key levels in both charts.
🔹 The Setup:
CRYPTOCAP:ETH is hovering around $3,000, a huge psychological and structural level on the chart.
The current flag structure looks weak — lower highs, declining volume, and repeated rejections at the 9 EMA.
A flush below $3,000 opens the door to a deeper move, potentially into the mid-$2,000s or even lower.
🔹 Macro & Market Context:
The entire risk complex looks shaky — if NASDAQ:NVDA disappoints on earnings, it could accelerate selling across crypto and equities.
CRYPTOCAP:BTC ’s failure to hold support is a red flag — crypto tends to move together on momentum shifts.
Watch for risk-off confirmation in NASDAQ:QQQ , AMEX:IWM , and high-beta names.
🔹 My Trade Plan:
1️⃣ Position: Short CRYPTOCAP:ETH here with a stop over the 9 EMA on the daily.
2️⃣ Target: First zone in the mid-$2,000s, potential extension if panic sets in.
3️⃣ Trigger: Breakdown confirmation under $3,000 with volume.
Why I Like This Short:
Clean bear flag structure with well-defined risk.
CRYPTOCAP:BTC and risk assets breaking key levels together = confluence.
CRYPTOCAP:ETH has plenty of air pockets below $3,000 — the technicals support continuation.

Ethereum - A -40% crash comes first!🪄Ethereum ( CRYPTO:ETHUSD ) will soon reverse:
🔎Analysis summary:
Over the course of the past couple of months, Ethereum failed to create a new all time high. So eventually, we will see a bearish reversal and a major move lower in the future. The bullish triangle remains valid though, so it will be a major buying opportunity then.
📝Levels to watch:
$2,000 and $4,500
SwingTraderPhil
SwingTrading.Simplified. | Investing.Simplified. | #LONGTERMVISION

Ethereum - The realistic $15,000 target!🔥Ethereum ( CRYPTO:ETHUSD ) can still break out:
🔎Analysis summary:
Over the past four years, Ethereum has been trading in a massive bullish triangle pattern. And despite the recent all time high rejection, Ethereum can still follow its underlying bullrun. It just has to create the bullish triangle breakout in the foreseeable future.
📝Levels to watch:
$4,000
SwingTraderPhil
SwingTrading.Simplified. | Investing.Simplified. | #LONGTERMVISION

NEXT 3 MONTHS are historically BULLSIH FOR CRYPTOEthereum is positioned as a top buy for the coming six months, with technical patterns, historical seasonality, and evolving fundamentals suggesting a realistic pathway toward the $10,000 mark. A clear Double bottom on the technicals is indicating reversal for COINBASE:ETHUSD
### Why Ethereum Is a Great Buy Now
- **Technical Setup**: ETH recently formed a double-bottom pattern at crucial support, signaling strong demand. The recent bounce from the $3,000 range aligns with bullish reversals in volume, moving averages, and on-chain metrics.
- **Network Growth**: Massive increases in layer-2 adoption, thriving DeFi ecosystems, and the emergence of a spot ETH ETF are expanding use cases and institutional interest, setting the stage for explosive price moves.
- **Macro Tailwinds**: The prospect of lower interest rates and renewed risk-on appetite among global investors are catalysts for crypto’s next surge. Hedge funds and corporates are increasingly adding Ethereum to their treasuries, aligning with historic accumulation phases.
- **Price Targets**: Top analysts forecast rapid gains, with DigitalCoinPrice and Changelly projecting $6,900–$11,000 for ETH within the next year, and Gov Capital suggesting $5,400 by late 2025. Bullish scenarios outline $10,000 as achievable if momentum and adoption trends accelerate.
### Seasonally Strong Months for ETH
Historical performance shows that certain months have offered outsized returns for Ethereum . Notably:
- January, February, and July are statistically the strongest rally months
- December and March often show above-average gains.
- May, June, and September tend to be bearish or mean-reverting.
#### ETH Month-by-Month Rally Table
| Month | Average Return | Rally Potential |
|-----------|:--------------:|:--------------:|
| January | +15% | Strong |
| February | +12% | Strong |
| March | +8% | Moderate |
| April | +5% | Positive |
| May | -3% | Weak |
| June | -4% | Weak |
| July | +17% | Very Strong |
| August | +9% | Moderate |
| September | -6% | Weak |
| October | +7% | Positive |
| November | +6% | Positive |
| December | +9% | Strong |
Conclusion
With history on its side and market fundamentals evolving rapidly, Ethereum is set for a major upside move in the next six months. Investors should target accumulation during seasonal lows in late winter and early spring, aiming for parabolic runs in summer and year-end. Technical and on-chain signals, combined with dominant seasonality, paint a bullish picture—making $10,000 a plausible target for proactive ETH buyersbuyers.

ETH PERPETUAL TRADE SELL SETUP Short from $3201ETH PERPETUAL TRADE
SELL SETUP
Short from $3201
Currently $3201
Targeting $3153 or Down
(Trading plan IF ETH
go up to $3252 will add more shorts)
Follow the notes for updates
In the event of an early exit,
this analysis will be updated.
Its not a Financial advic
