ETH/USD Bearish Structure with Downside TargetsETH/USD is showing clear bearish pressure after repeated failures to sustain above the highlighted supply zone around the 3,050–3,100 area. Price action indicates a lower high structure, followed by a strong rejection from the Ichimoku cloud, suggesting sellers remain in control. The cloud ahead is
Key facts today
Key stats
About Ethereum
Ethereum — the world’s second-most famous blockchain network — is a platform for creating decentralized applications based on blockchain and smart contract technology (a command that automatically enforces the terms of the agreement based on a given algorithm). It's the chain that birthed DeFi (decentralized finance) and started the NFT craze which saw billions of dollars pour into cryptocurrency. Safe to say, it's one of the big dogs.
Related pairs

ETH-The final drop before the cows come home (SHORT TERM SHORT)hello all 👋🙋♂️🙋♀️ Thank you so much for coming today
Let's get right to it💡. Today we are looking at a 4 hour view of ETHEREUM. I have noticed several things about ETH price action and what it could indicate.
⬆️ above on chart 📈📉 you can see I have labeled
major trend line (support line)
We

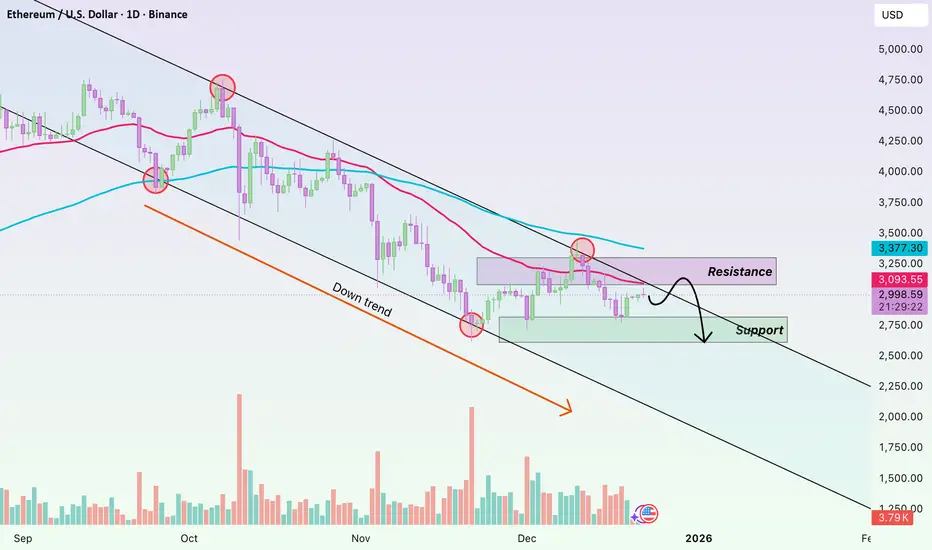
ETHUSD – Technical Rebound Within a DowntrendHello, this is Domic.
Looking at the ETH daily chart, the current picture is quite clear: the primary trend remains bearish, and the recent upside move should only be viewed as a technical rebound.
Price is still trading below both EMA34 and EMA89, with EMA34 having crossed below EMA89 and both m
Ethereum (ETHUSD) – 4-Hour Timeframe Tradertilki AnalysisMy friends, greetings,
I have prepared an Ethereum-ETHUSD analysis for you.
My friends, if ETHUSD manages to close a candle above the levels of ( 3027.3-2964.1 ) on the 4-hour timeframe, I will open a buy position.
My target will be the 3,450 level.
My friends, I share these analyses thanks to e

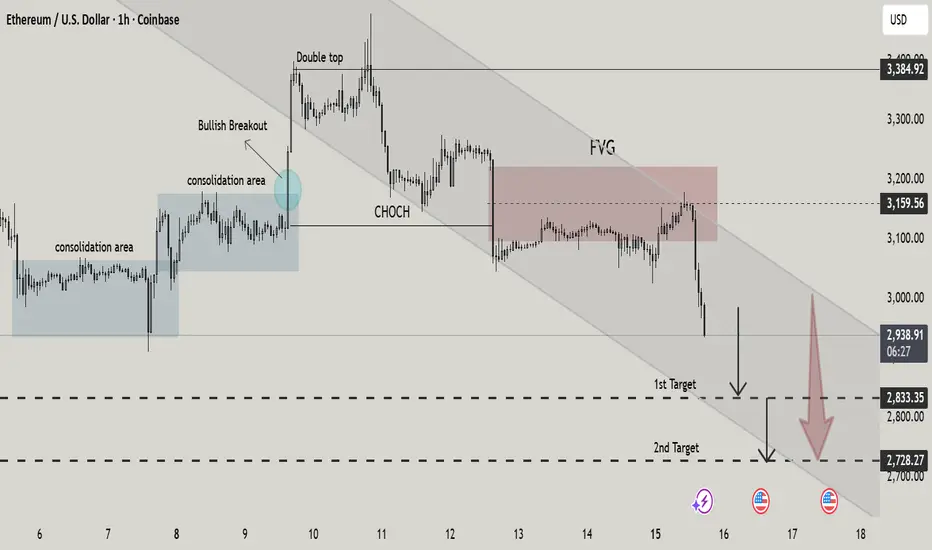
ETHUSD – 2H Chart PatternETHUSD – 2H Chart Pattern
Based on the 2H chart my shared:
Current price: around 2,950
Price is below the trendline and inside a bearish structure
Momentum is downward, rejection from resistance
🎯 Sell Targets
Target 1: 2,800
Target 2: 2,650
Final / Extended Target: 2,500 (marked target po

Ethereum: Reverse Head & Shoulders Aiming ATHETH weekly chart is printing a big reverse head & shoulders pattern.
Three rounded lows :
Left shoulder ✅
Deeper head ✅
Right shoulder now forming ✅
Why it matters :
Each dip gets bought higher, showing strong demand. 💪
The neckline is basically the ATH resistance around 4,850.
What I’m w

ETH/USDT LongTest Strategy
ETH/USDT Long
— Entry: $2986 (Market Buy)
— Stop-loss: $2959
— 0.90% price movement from entry to stop (NOT % of capital loss)
— Target: $3150
Risk per trade: 0.1% of total equity (actual loss if stop is hit)
Position size: 10% of total equity
Leverage: 10x
Risk/Reward: 1:6.3
Key

ETH/USDT LongTest Strategy
ETH/USDT Long
— Entry: $2967 — Market Buy
— Stop: $2942 — 0.80% price movement from entry to stop (NOT account loss)
— Target: $3122
Risk per trade: 0.1% of total deposit (account loss)
Position size: 12% of total deposit, 10x leverage
RR: 1:6.8
Key Strategy Concept:
— Fixed risk

ETHUSD - Is the bear market over for ETH?I am considering that the bear market is not over, we see bears stepping in for the remaining of the month / year.
We have clear bearish reactions from the daily FVG / 4h FVG with both fractal structures on both timeframes beeing bearish.
I am expecting that ETH will continue it's movement for at

ETH/USD – Bearish Shift After DistributionThis 1H ETH/USD chart highlights a clear transition from consolidation to distribution and then into a bearish trend. Price first ranged in tight consolidation zones before a bullish breakout that ultimately failed, forming a double top near the highs. A confirmed CHoCH (Change of Character) signale
See all ideas
Displays a symbol's price movements over previous years to identify recurring trends.
Curated watchlists where ETHUSD is featured.

Gen 2: Crypto is here to stay - and it's brought some friends…
19 No. of Symbols

Proof of Work: Embracing the crunch
27 No. of Symbols

Smart contracts: Make the smart decision
36 No. of Symbols

Staking Coins: Pick up a stake
18 No. of Symbols

Top altcoins: Choose your alternatives carefully
28 No. of Symbols
See all sparks
Discover funds exposed to Ethereum and find the best way to access the coin.
Frequently Asked Questions
Ethereum (ETH) reached its highest price on Aug 22, 2025 — it amounted to 4,866.90 USD. Find more insights on the ETH price chart.
See the list of crypto gainers and choose what best fits your strategy.
See the list of crypto gainers and choose what best fits your strategy.
Ethereum (ETH) reached the lowest price of 81.00 USD on Dec 14, 2018. View more Ethereum dynamics on the price chart.
See the list of crypto losers to find unexpected opportunities.
See the list of crypto losers to find unexpected opportunities.
The safest choice when buying ETH is to go to a well-known crypto exchange. Some of the popular names are Binance, Coinbase, Kraken. But you'll have to find a reliable broker and create an account first. You can trade ETH right from TradingView charts — just choose a broker and connect to your account.
You can discuss Ethereum (ETH) with other users in our public chats, Minds or in the comments to Ideas.