ETHUSD – Technical Rebound Within a DowntrendHello, this is Domic.
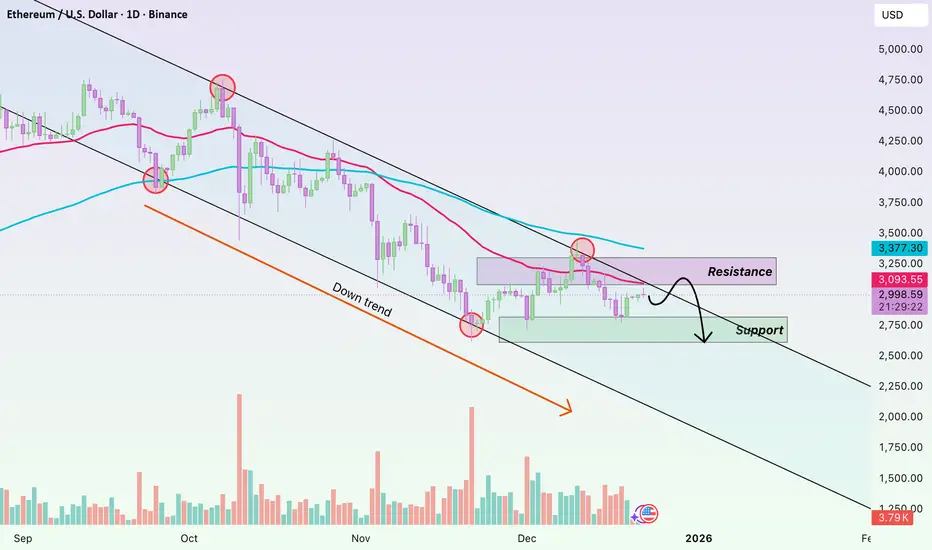
Looking at the ETH daily chart, the current picture is quite clear: the primary trend remains bearish, and the recent upside move should only be viewed as a technical rebound.
Price is still trading below both EMA34 and EMA89, with EMA34 having crossed below EMA89 and both moving averages sloping downward. This is a textbook setup of a medium-term downtrend, not a sideways phase or a basing process. As long as this structure holds, there is no solid basis to talk about a trend reversal.
On the upside, EMA34 around the 3,090 level is acting as a dynamic resistance . Price has repeatedly rebounded into this zone only to be pushed back down, indicating that sellers are clearly defending this area. The higher EMA89 further reinforces the idea that ETH still lacks the strength needed to shift the broader trend.
The quality of the current rebound also does not favor the bulls. Rebound candles are small and choppy, with lower highs forming, while volume shows no sign of strong capital inflows. In addition, this week falls into a holiday period, leading to reduced market liquidity, which makes price movements more sluggish and lacking breakout momentum.
Wishing everyone successful trading!
Market insights
LOOK OUT FOR ETHERUM HIGH PROBABILITY LONG SETUP SOON!!!🚨ETHER HIGH PROBABILITY BUY SETUP 🚨
* Here We Can See Clearly The Next Potential Moves For ETHUSD Coming Hours/Days.
* Keep Your Eyes Close On Your Trading Positions.
* Happy PIP Hunting Traders.
FXKILLA.

ETHUSD Descending Triangle Breakdown SetupThis 2H ETH/USD chart highlights a descending triangle structure forming after a prior impulse move. Price is consistently making lower highs beneath a descending trendline, while holding a horizontal support zone around 2,890–2,900, signaling growing bearish pressure.
A clear CHoCH (Change of Character) confirms the shift in market structure from bullish to bearish. Price is currently trading below key dynamic resistance and within a marked Fair Value Gap (FVG), suggesting a potential rejection area before continuation lower.
The projected downside targets are:
1st Target: ~2,815 (liquidity sweep / prior support)
2nd Target: ~2,748 (major demand zone)
Overall, the chart presents a classic bearish continuation setup, favoring downside expansion if support breaks with confirmation.

ETH/USD Bearish Structure with Downside TargetsETH/USD is showing clear bearish pressure after repeated failures to sustain above the highlighted supply zone around the 3,050–3,100 area. Price action indicates a lower high structure, followed by a strong rejection from the Ichimoku cloud, suggesting sellers remain in control. The cloud ahead is turning bearish, acting as dynamic pressure and limiting upside momentum. Recent rebounds appear corrective rather than impulsive, reinforcing the downside bias. If price continues to respect this resistance zone, further weakness is likely. The first downside objective is seen near 2,780, which aligns with a prior demand area. A decisive break below this level could accelerate selling pressure toward the second target at 2,524, marking a deeper move into lower support. Proper risk management is advised in volatile conditions.
If you found this XAUUSD analysis helpful, don’t forget to LIKE 👍 and COMMENT 💬!

The Chronicles of Ethereum: “A story of overconfident bears.”Hello Traders,
I will start by saying that this idea is not financial advice , and as always make sure to do your own research. My invalidation level is 2800. Ok lets get into it…
3 levels to watch : 2963, 3075 & 3178. I believe that any genuine upward momentum through these levels should trigger a swift move to 4156.75. I view this level as the current equilibrium price. I boldly expect it by the end of the year. We all see the looming head and shoulders. Maybe, just maybe an asymmetric upside opportunity has presented itself.
STOP: 2800
ENTRY: 2925
TARGETS : 3750, 4007, & 4156.75
Send it.

ETH-The final drop before the cows come home (SHORT TERM SHORT)hello all 👋🙋♂️🙋♀️ Thank you so much for coming today
Let's get right to it💡. Today we are looking at a 4 hour view of ETHEREUM. I have noticed several things about ETH price action and what it could indicate.
⬆️ above on chart 📈📉 you can see I have labeled
major trend line (support line)
We have made contact with this long standing trend line and have seen some bullish pressure after doing so.
🤸🤸♂️
HOWEVER
There has been a Head and shoulders bearish pattern formed on the 4 hour view in which we did go down from but bounced back up to make a bearish flag 🐻🧸
🌊🏄♂️🏄♀️
MORE RECENTLY
We have formed a bearish harmonic pattern, which leads me to believe we will try to continue our head and shoulders pattern (with a drop in price) ⏬🔻But will catch support at our major trend line ~(3800)
🐼This is a Short term short Idea. The cryptocurrency market is extremely volatile.💣
This is not financial advice
🐶
Always have a stop loss ✋🛑💲 set🆗
Any thoughts 💭💡, questions 🙋♀️🙋♂️❓, good 👍, bad👎, happy 😄 or sad 😥, in the comments always welcome.😄
Jazerbay ☯️

ETH - Time to buy again!The price can form a head and shoulders pattern. If that is happen, expect a significant price increase.

Ethereum: Reverse Head & Shoulders Aiming ATHETH weekly chart is printing a big reverse head & shoulders pattern.
Three rounded lows :
Left shoulder ✅
Deeper head ✅
Right shoulder now forming ✅
Why it matters :
Each dip gets bought higher, showing strong demand. 💪
The neckline is basically the ATH resistance around 4,850.
What I’m watching :
As long as the right shoulder holds, bias stays bullish. 📈
A clean weekly close above the neckline would confirm the pattern and open the door to new highs. 🎯

Ethereum (ETHUSD) – 4-Hour Timeframe Tradertilki AnalysisMy friends, greetings,
I have prepared an Ethereum-ETHUSD analysis for you.
My friends, if ETHUSD manages to close a candle above the levels of ( 3027.3-2964.1 ) on the 4-hour timeframe, I will open a buy position.
My target will be the 3,450 level.
My friends, I share these analyses thanks to each like I receive from you. Your likes increase my motivation and encourage me to support you in this way.🙏✨
Thank you to all my friends who support me with their likes.❤️

ETH/USDT LongTest Strategy
ETH/USDT Long
— Entry: $2967 — Market Buy
— Stop: $2942 — 0.80% price movement from entry to stop (NOT account loss)
— Target: $3122
Risk per trade: 0.1% of total deposit (account loss)
Position size: 12% of total deposit, 10x leverage
RR: 1:6.8
Key Strategy Concept:
— Fixed risk of 0.1% per trade
— Very tight stop-loss — no more than 2% price movement against the entry
— Minimum risk-to-reward ratio 1:5 or higher
— Goal: capture impulsive price moves with minimal risk

ETHUSD – H4 Analysis ETHUSD – H4 Analysis (based on My chart)
Market Structure
Price is recovering from a strong demand zone (yellow).
Currently trading below major resistance, inside a corrective structure.
Ichimoku cloud acting as resistance, but short-term bounce continuation is visible.
This looks like a pullback-buy → resistance sell type structure.
📈 Buy (Bounce / Recovery) Setup
Buy Zone: 2880 – 2920
🎯 Target Points (Upside)
Target 1: 3050
Target 2: 3240 (major supply / resistance zone)
❌ Invalidation
H4 close below 2800 → bullish setup invalid.
📉 Alternative Sell (from Resistance)
If price reaches resistance and shows rejection:
Sell Zone: 3220 – 3260
Downside Target: 3000 → 2920
📌 Clean Signal Summary
Pair: ETHUSD
Timeframe: H4
Bias: Buy (recovery move)
Primary Targets: 3050 → 3240

ETHUSD - Is the bear market over for ETH?I am considering that the bear market is not over, we see bears stepping in for the remaining of the month / year.
We have clear bearish reactions from the daily FVG / 4h FVG with both fractal structures on both timeframes beeing bearish.
I am expecting that ETH will continue it's movement for at least the 4h bullish FVG connection, where i will be moving my SL to BE and let the trade run with 0 risk.
The last low, in my point of view, is far from beeing protected and we can see another round of sells before anything else.

ETH SELL SETUP ACTIVEETH SELL SETUP ACTIVE ⚡
📌 Trade Plan:
🔓 Entry: 2900 - 2890
❌ Stop Loss: 2860
🎯 Target: 2960
ETH rejected from a strong supply zone after showing clear weakness and momentum shift. Smart money distribution + structure break confirms a high-probability sell. Clean risk management, clear levels — trade the plan, not emotions.
📌 Follow for more accurate, level-based setups
⚠️ Educational purpose only. Not financial advice.

Ethereum at the Edge: Compression, Volatility & the Next RegimeThis idea looks at Ethereum through a volatility, volume, and macro lens.
To frame this properly, I’m using volume and a loosely defined time boundary that aligns with what many perceive as the four-year cycle in crypto markets. The goal isn’t to be exact, but to highlight key volume inflection points and what they may represent structurally.
There’s a widely held belief that “smart money” — often assumed to be institutions or market makers — accumulates at certain phases and distributes at others. The assumption is that this capital tends to buy well and sell well. Whether that’s fully accurate or not, I’ve used those same labels here as a conceptual framework.
Different platforms and brokers show slightly different data, so I’ve kept this analysis broad. The levels referenced are directional markers rather than precise figures.
Key Volume Inflection Points
The first major point of interest is March 2017, when Ethereum traded around $57. This period marked a notable volume spike.
The next significant volume inflection occurred in January 2021, when ETH traded near $1,313. From there, price accelerated aggressively, peaking in May 2021 at $4,385.
That May 2021 candle was the largest monthly candle in Ethereum’s history, accompanied by the second-highest monthly volume ever recorded. Price moved roughly $2,600 intramonth.
My interpretation: this was a major distribution event.
What makes May 2021 especially important is that price has effectively oscillated within that candle’s range ever since. Despite multiple attempts, neither the highs nor the lows have been meaningfully broken and sustained. Both sides have been swept—but the range remains intact.
The Four-Year Lens
There’s a common belief that crypto operates in four-year cycles. Using volume as a guide, we can loosely frame:
Expansion: January 2018 → November 2021
Compression: November 2021 → September 2025
Potential Expansion: September 2025 → 2029
In September 2025, we saw a volume spike that wasn’t dramatic—but it was meaningful. What followed was a 47% decline in roughly 92 days. The speed of that move matters.
The question is simple but important:
Was that volume spike accumulation for a larger downward expansion, or was the decline a corrective move setting up a future expansion?
The Macro Reality
If institutional adoption alone was going to send Ethereum to the moon, it would have happened already in my opinion. In reality, total Ethereum volume has declined steadily since November 2021, despite periodic spikes.
Yes, there’s been broader institutional acceptance and regulatory acknowledgment, but price has remained trapped in the same macro range.
What has changed since 2021 is interest rates. We moved from near-zero to ~4%, and Ethereum has struggled to sustain prices near the $4,000 area under those conditions.
A simple—but powerful—idea emerges:
If policy shifts toward meaningful rate cuts, that could fuel a large-scale expansion. But if higher rates persist or rise further, that pressure could remain a headwind.
This matters because crypto has never existed in a prolonged high-rate environment. Its entire lifespan has been shaped by cheap money. We genuinely don’t know how it behaves under sustained monetary tightening.
The Dollar Factor
The dollar also matters. Crypto tends to perform better during periods of dollar weakness. While the dollar has softened at times, it’s also compressing structurally.
If the dollar enters a sustained bull market alongside high interest rates, that combination could be extremely hostile for crypto.
Conversely, a weakening dollar, easing rates, and improving global liquidity could ignite a powerful multi-year expansion.
This framework isn’t predictive—it’s contextual.
The goal isn’t certainty, but clarity.
This idea is meant to spark thought, not provide answers.

ETHUSDBased on the ETHUSD – 1H chart
👇
Pure technical. Not trading advice.
📉 Market Structure (Short-term)
Price has broken the recent higher low
Rejection from ~3008–3075 supply zone
Structure shifted from bullish → bearish / corrective
Currently consolidating below 2975, which is weak
This favors further downside.
🔻 Downside Targets (Step-by-Step)
🎯 Target 1: 2945 – 2940
Immediate support
Minor bounce possible
If 1H closes below 2940 → continuation confirmed
🎯 Target 2: 2895 – 2875
Clean imbalance / liquidity area
High probability reaction zone
Partial profit zone for shorts
🎯 Target 3 (Extended): 2845 – 2825
Strong demand zone (marked on your chart)
Previous institutional buying
Likely temporary bottom
🚨 Invalidation / Risk Zone
If ETH reclaims & closes above 3008 (1H)
Or strong bullish engulfing above 2975 ➡️ Downside idea weaken.

ETHUSD bullish fractalEhereum is repeat bullish patterns that did in previous cycles.
-ETH exited the consolidation triangle that started from nov 21, and now is retesting the structure, meaning a bullish continuation is likely to happen.
-In adition, there is an inverted head and shoulders that is taking shape.
I am watching closely this formation of this triangle for any bullish confirmation:

ETH - MY Trade Plan COINBASE:ETHUSD TH
Here is my Trade Plan. Form my analysis ETH may start up trend from this zone.
So I have taken long position at $2921.27.
my potential target is $2949.

The Breakout Is LoadingHELLO TRADERS
ETH (Ethereum) – 4H | Key Points
Market Structure: Clear range / accumulation between support and resistance.
Resistance Zone: ~3,040 – 3,080 → supply still active, repeated rejections.
Support Zone: ~2,780 – 2,820 → strong demand, buyers defending lows.
Price Behavior: Sideways oscillation (high liquidity range), no breakout yet.
Bias: Neutral → Slightly bullish while holding above support.
Bullish Trigger: Clean 4H close above resistance → upside expansion.
Bearish Risk: Breakdown below support → deeper retracement.
Bottom line:
ETH is consolidating. Patience > prediction — wait for a confirmed breakout from the range.

ETHUSD - Confirmation Over PredictionPrice has reacted strongly from the bullish order block and is now consolidating below a key intraday resistance zone (white/green area). After the recent displacement to the downside, price is showing signs of stabilization and potential short-term reversal.
Trade Idea:
Entry: Look for buy opportunities only if a 15-minute candle closes cleanly above the white/green resistance zone, confirming bullish acceptance.
Confirmation: A strong bullish close above this level signals short-term market structure alignment in favor of buyers.
Target: Upside continuation toward the next resistance / liquidity zone as marked on the chart.
Invalidation: Failure to close above resistance or a strong rejection from this zone keeps the setup invalid and increases the probability of further consolidation or a retest of lower levels.
This is a confirmation-based setup, prioritizing patience and clarity to avoid false breakouts and low-probability entries.

ETH/USDT LongTest Strategy
ETH/USDT Long
— Entry: $2986 (Market Buy)
— Stop-loss: $2959
— 0.90% price movement from entry to stop (NOT % of capital loss)
— Target: $3150
Risk per trade: 0.1% of total equity (actual loss if stop is hit)
Position size: 10% of total equity
Leverage: 10x
Risk/Reward: 1:6.3
Key Strategy Concept:
— Fixed risk of 0.1% per trade
— Very tight stop-loss — no more than 2% price movement against the entry
— Minimum risk-to-reward ratio 1:5 or higher
— Goal: capture impulsive price moves with minimal risk

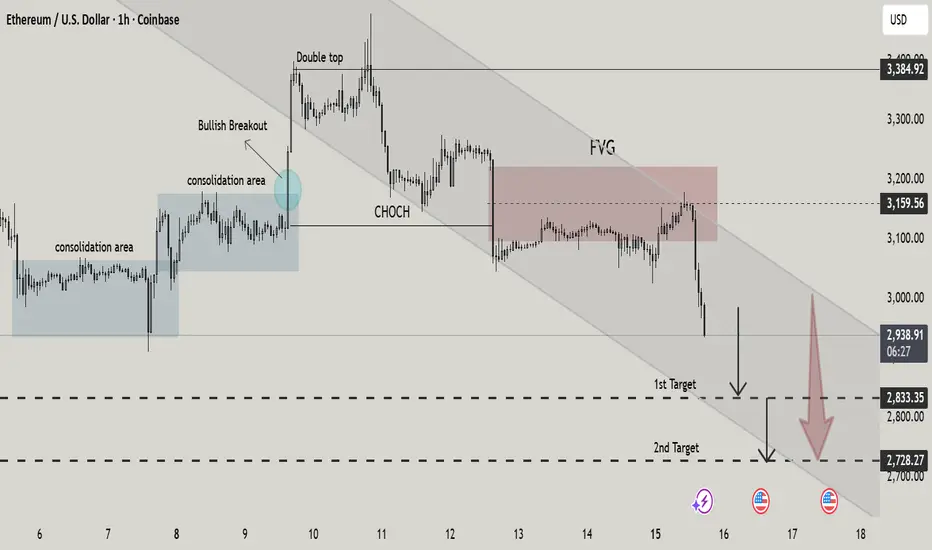
ETH/USD – Bearish Shift After DistributionThis 1H ETH/USD chart highlights a clear transition from consolidation to distribution and then into a bearish trend. Price first ranged in tight consolidation zones before a bullish breakout that ultimately failed, forming a double top near the highs. A confirmed CHoCH (Change of Character) signaled bearish control, followed by rejection from a Fair Value Gap (FVG) within a descending channel.
With downside momentum increasing, price is now targeting lower liquidity levels, with $2,833 as the first target and $2,728 as the second. Overall structure favors continuation to the downside unless price reclaims the channel and invalidates the bearish bias.
ETHUSD Will Fall! Sell!
Please, check our technical outlook for ETHUSD.
Time Frame: 1h
Current Trend: Bearish
Sentiment: Overbought (based on 7-period RSI)
Forecast: Bearish
The market is approaching a key horizontal level 2,939.57.
Considering the today's price action, probabilities will be high to see a movement to 2,893.67.
P.S
We determine oversold/overbought condition with RSI indicator.
When it drops below 30 - the market is considered to be oversold.
When it bounces above 70 - the market is considered to be overbought.
Like and subscribe and comment my ideas if you enjoy them!

Ethereum - The bearmarket is not over yet!🪚Ethereum ( CRYPTO:ETHUSD ) can still drop about -30%:
🔎Analysis summary:
Over the past four years, Ethereum has been creating a major bullish triangle. With the recent all time high retest, we are now seeing an expected reversal. But considering the bullish nature of this triangle, Ethereum will head higher after a retest of the next support.
📝Levels to watch:
$2,000
SwingTraderPhil
SwingTrading.Simplified. | Investing.Simplified. | #LONGTERMVISION
