imx is ready IMX is the type of Assets that must be in your portfolio. Not financial advice.
But this chart looks very well ready

IMXI’m confident that most altcoins are setting up for a 10–20x move from current levels. Many charts are showing clear double bottom formations, SEED_DONKEYDAN_MARKET_CAP:IMX being a great example. The overall market structure looks ready for a major cycle expansion as momentum builds.

IMXUSDT.P - October 23, 2025Price is consolidating around the 0.50 zone, with a bullish breakout above 0.55 potentially targeting 0.68, while a rejection from this area may trigger a bearish continuation toward 0.47 and 0.42. Sideways movement between 0.47–0.55 would signal indecision and further consolidation. Always plan and

IMXUSDT — On the Edge of a Major Reversal: Accumulation or Trap?After a prolonged downtrend since 2022, Immutable X (IMX) is once again testing the critical accumulation zone between 0.48 – 0.38 USDT — a price area that has repeatedly acted as a major turning point in the past.
This yellow demand block now represents the last stronghold of buyers, where every di

IMX SHORT1. Chart Context
Pair: IMX/USDT
Timeframe: 1h
Current Price: ≈ 0.551 USDT
Market sentiment: Price recently failed to create new highs and is now retesting a resistance zone.
2. Trade Setup
The highlighted red/green zone represents the short trade idea:
Entry Zone: Around 0.551 USDT (current price at

Imx short to $0.65Imx short to $0.65
Just opened
Sl: 0.705
Time sensitive.
Reason for trade: Downtrend + HTF correlation

IMX - BULLISH SEED_DONKEYDAN_MARKET_CAP:IMX - bullish structure 📈
Price is likely to fly soon! 🚀
Bullish above 0.750$ (daily basis).
Lower key support:
0.720 - 0.680 - 0.660

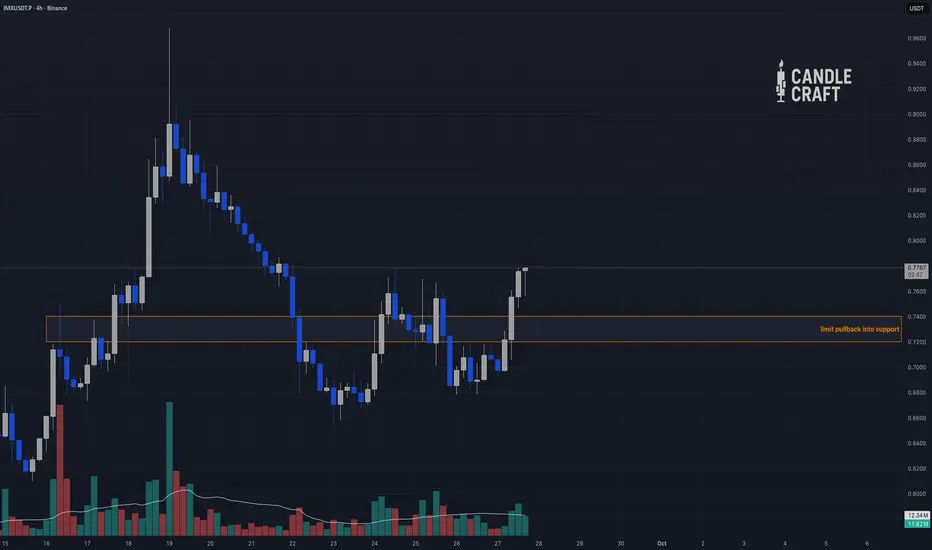
One of the Cleanest Alt Setups Right Now? IMX Says YesImmutable (IMX) has staged a strong rebound from its $0.60 accumulation base, now trading near $0.77. The move has been led by spot demand, not perps — a healthier driver compared with many alt pumps.
HTF Structure:
• Rebound from $0.60.
• First supply rejection at $0.95.
• Key continuation trig
#IMX/USDT#IMX
The price is moving within a descending channel on the 1-hour frame, adhering well to it, and is heading for a strong breakout and retest.
We are seeing a bounce from the lower boundary of the descending channel, which is support at 0.599.
We have a downtrend on the RSI indicator that is abou

IMX HOLDING THE MAIN TREND AND CAN RETURN HUGE - UPDATE 28-05IMX/USDT Trading Update
🔹 Main trend holding: IMX is holding its main trend support, which is a very important signal for keeping the broader uptrend intact.
🔻 It did lose the low time frame trend and corrected from $0.83 down to the $0.70–$0.75 zone.
🔄 However, holding the main trend gives stron

See all ideas
Summarizing what the indicators are suggesting.
Oscillators
Neutral
SellBuy
Strong sellStrong buy
Strong sellSellNeutralBuyStrong buy
Oscillators
Neutral
SellBuy
Strong sellStrong buy
Strong sellSellNeutralBuyStrong buy
Summary
Neutral
SellBuy
Strong sellStrong buy
Strong sellSellNeutralBuyStrong buy
Summary
Neutral
SellBuy
Strong sellStrong buy
Strong sellSellNeutralBuyStrong buy
Summary
Neutral
SellBuy
Strong sellStrong buy
Strong sellSellNeutralBuyStrong buy
Moving Averages
Neutral
SellBuy
Strong sellStrong buy
Strong sellSellNeutralBuyStrong buy
Moving Averages
Neutral
SellBuy
Strong sellStrong buy
Strong sellSellNeutralBuyStrong buy
Displays a symbol's price movements over previous years to identify recurring trends.