Market insights

KAITO LONGKaitousdt Long position
1HR timeframe
Confluence:
1.Right Hand
2.TRBO
3.Oscillator cross
4.Triple Bottom

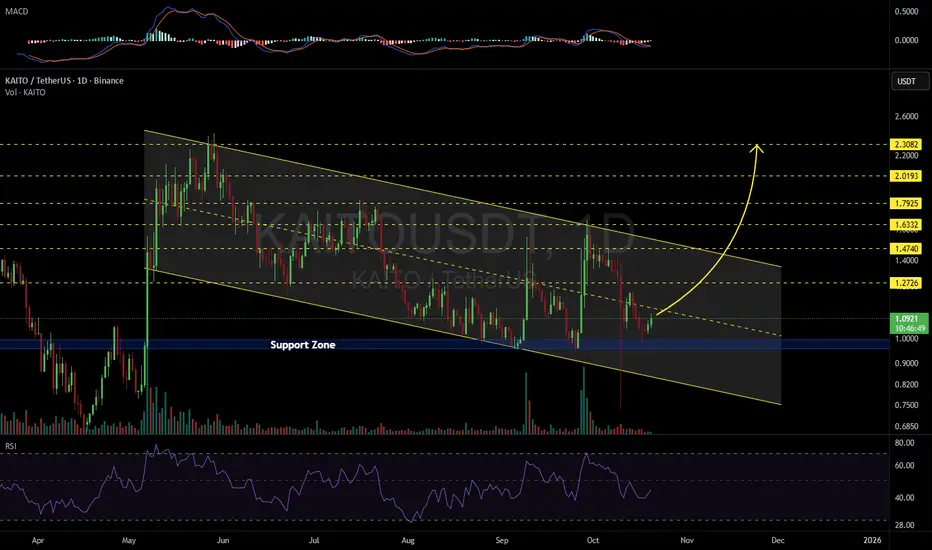
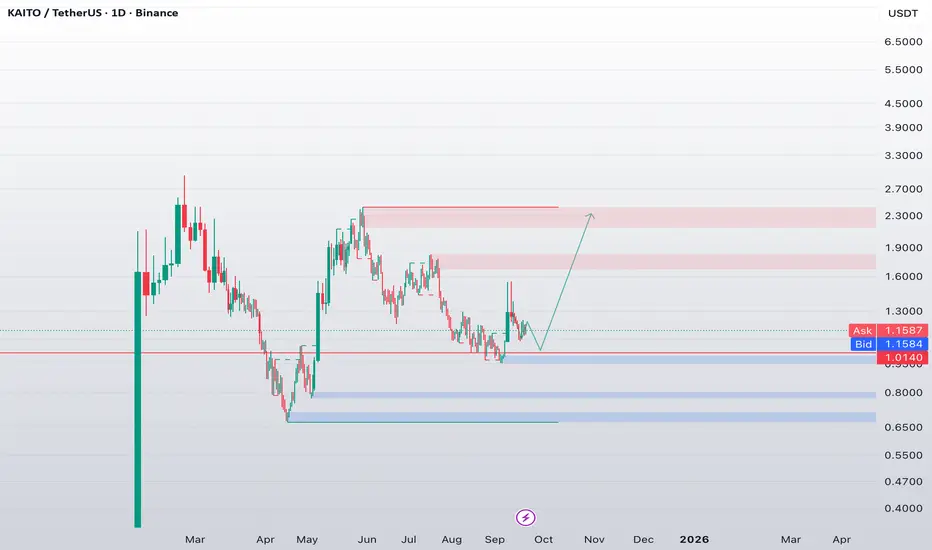
KAITOUSDT 1D#KAITO is moving inside a descending channel on the daily chart. Consider buying here and near the support zone. The potential targets are:
🎯 $1.2726
🎯 $1.4740
🎯 $1.6332
🎯 $1.7925
🎯 $2.0193
🎯 $2.3082
⚠️ Always remember to use a tight stop-loss and maintain proper risk management.
$KAITO - Bearish OutlookKAITO’s recent performance underscores the growing momentum in AI-driven blockchain projects, signaling robust market potential. The integration of advanced AI tools and increasing adoption are driving bullish sentiment. Similarly, Faith Protocol is carving a niche with its innovative yield farming, NFT offerings, and expanding DeFi ecosystem. Both projects exemplify the synergy of utility and community engagement in fueling growth.
KAITO has surged ~80% from its daily support at $1.04, propelled by over $170M in launchpad pledges and heightened anticipation for upcoming airdrop rewards. Key catalysts include record-breaking Launchpad presales, 31.99m tokens staked, ongoing airdrops for projects.
MARKET ANALYSIS:
On the 2-day chart, $KAITO is testing a critical diagonal resistance at $1.66 but faced strong rejection, indicating potential consolidation. Key support lies between $1.20–$1.06, a zone that has historically held firm. A breach below this could trigger a deeper correction toward $0.80 for a proper bottoming formation. Conversely, a decisive break above $1.66 may signal continuation toward higher resistance levels, with momentum supported by strong fundamentals and market interest.
KEY LEVELS:
Support: $1.20–$1.06 (critical), $0.80 (secondary)
Resistance: $1.66 (immediate)

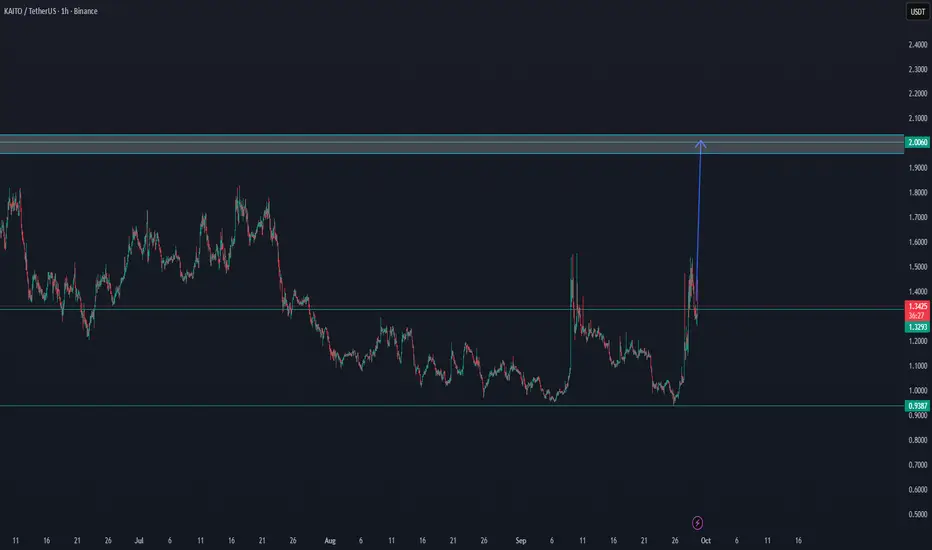
KAITO/USDT NEW INCREASE VOLUME - SOON $2 POSSIBLEdepending on confirmation from the lower time frames, Kaito may be showing early trend signals. Recent exchange data also indicates a rise in trading volume, which could increase the likelihood of a potential breakout.
Kaito - Big Sym Triangle forming I entered early around $1.19, a few weeks ago, but this pattern is still forming. Expecting to go for a final low, thus giving a valid pattern. Targets close to $6. I will update once we have the complete pattern.

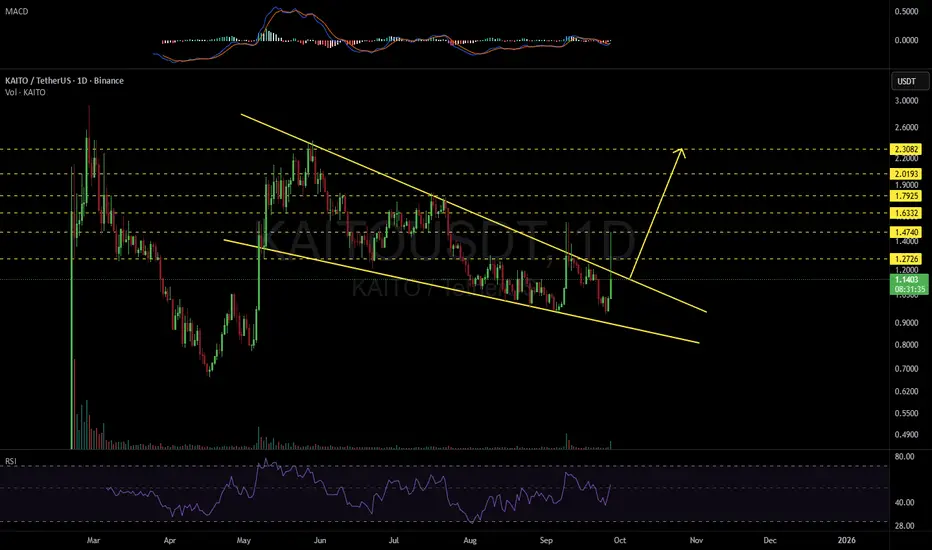
KAITOUSDT 1D#KAITO is moving inside a falling wedge pattern on the daily chart. Volume has increased and RSI and MACD are turning bullish. #KAITO is on the verge of breaking out. If that happens, the potential targets are:
🎯 $1.2726
🎯 $1.4740
🎯 $1.6332
🎯 $1.7925
🎯 $2.0193
🎯 $2.3082
⚠️ Always remember to use a tight stop-loss and follow proper risk management.
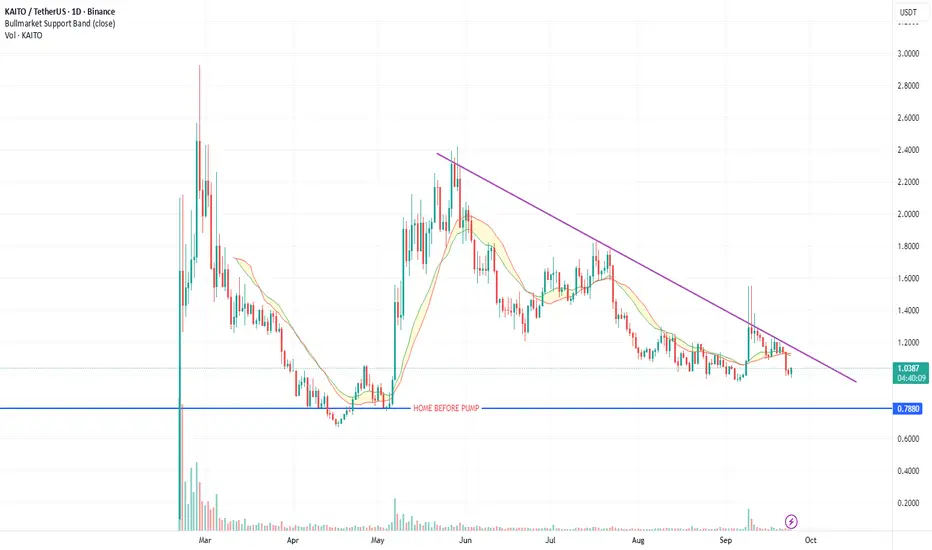
KAITO/USDT – Strong Structure + Community Trend LeaderKAITO continues to form a clean and technically sound structure. After a solid rebound from the ~$0.70 zone and several successful retests, we might be witnessing the beginning of a larger accumulation-to-expansion phase.
🔍 Technical Highlights:
Price is holding above the key support zone ($1.00–$1.05)
A higher low has formed, suggesting the market is preparing for a move
Potential breakout target lies in the $2.30–$2.50 region (previous imbalance and resistance)
📣 But KAITO is not just a chart play — it’s a trendsetter.
It has become one of the most discussed tokens among CT influencers on Twitter
The staking program constantly rewards active users with new airdrops
The project demonstrates clear team engagement, ongoing development, and growing brand visibility
🧠 From a fundamentals + price action view, KAITO is a rare combination of:
Real utility (community + staking + airdrops)
Technical strength
Social traction
🎯 If momentum sustains, $2.5 is not just possible it's logical.
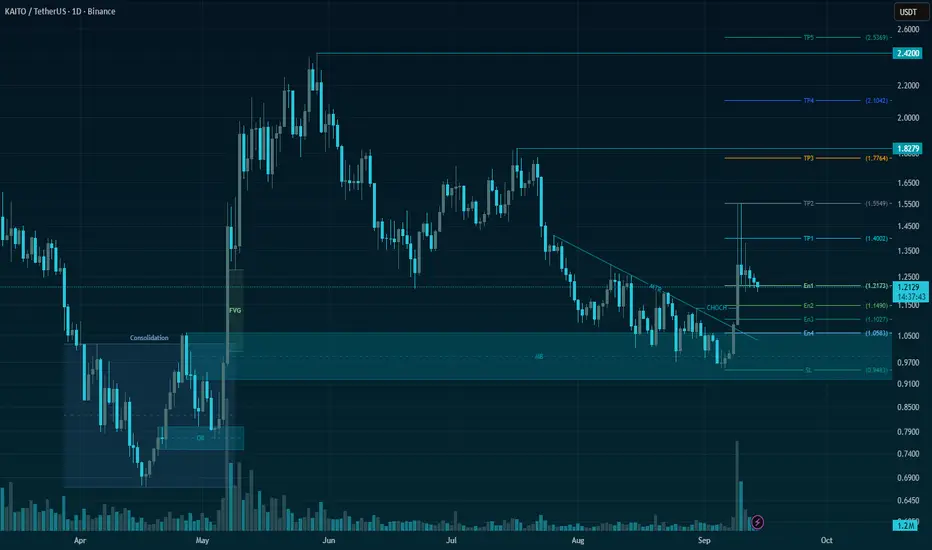
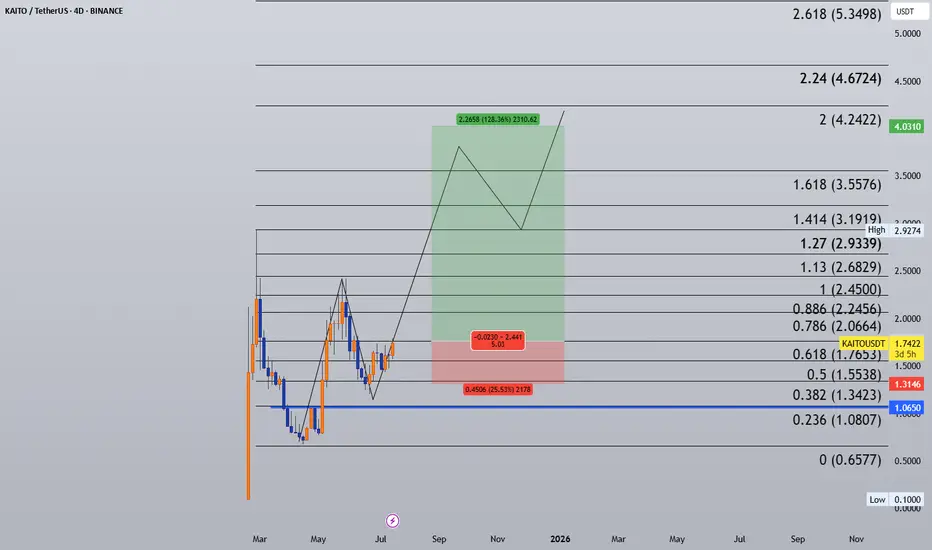
KAITO/USDT | Low-Risk Setup with 125%+ Upside Potential🚀 Trade Setup Details:
🕯 #KAITO/USDT 🔼 Buy | Long 🔼
⌛️ TimeFrame: 1D
--------------------
🛡 Risk Management (Example):
🛡 Based on $10,000 Balance
🛡 Loss-Limit: 1% (Conservative)
🛡 The Signal Margin: $634.52
--------------------
☄️ En1: 1.2173 (Amount: $63.45)
☄️ En2: 1.149 (Amount: $222.08)
☄️ En3: 1.1027 (Amount: $285.53)
☄️ En4: 1.0583 (Amount: $63.45)
--------------------
☄️ If All Entries Are Activated, Then:
☄️ Average.En: 1.1257 ($634.52)
--------------------
☑️ TP1: 1.4002 (+24.38%) (RR:1.55)
☑️ TP2: 1.5549 (+38.13%) (RR:2.42)
☑️ TP3: 1.7764 (+57.8%) (RR:3.67)
☑️ TP4: 2.1042 (+86.92%) (RR:5.52)
☑️ TP5: 2.537 (+125.37%) (RR:7.95)
☑️ TP6: Open 🔝
--------------------
❌ SL: 0.9483 (-15.76%) (-$100)
--------------------
💯 Maximum.Lev: 3X
⌛️ Trading Type: Swing Trading
‼️ Signal Risk: 🙂 Low-Risk! 🙂
--------------------
🔗 www.tradingview.com
❤️ Your Like & Comments are valuable to us ❤️
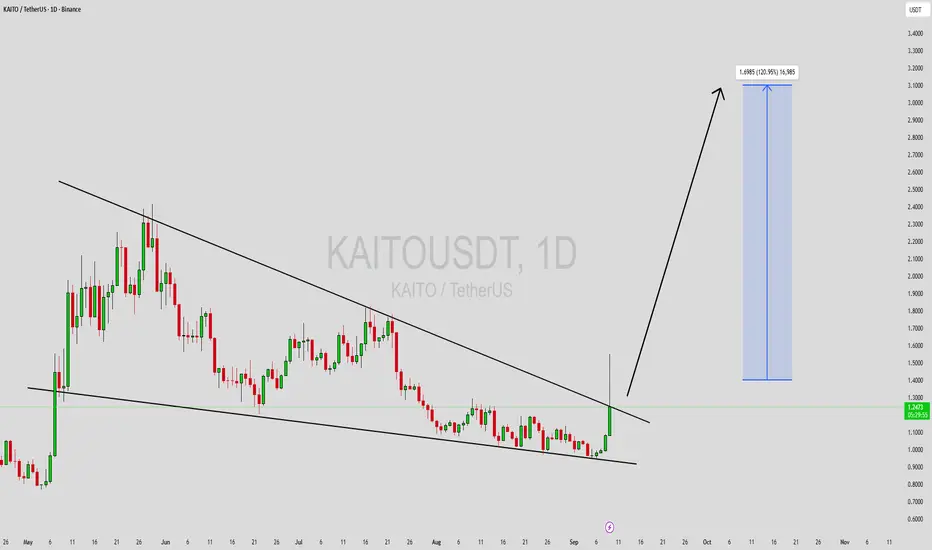
KAITOUSDT Forming Falling WedgeKAITOUSDT is currently forming a falling wedge pattern, which is widely recognized as a bullish reversal signal in technical analysis. The narrowing range of price action reflects declining selling pressure, while strong buying interest is gradually emerging. With trading volume showing healthy activity, the setup points toward a potential breakout, with expected gains in the range of 90% to 100% once key resistance levels are surpassed.
The falling wedge often indicates market accumulation, as investors and traders position themselves ahead of an upward breakout. For KAITOUSDT, this structure suggests that momentum could shift dramatically in favor of the bulls, pushing price into a strong rally. The combination of healthy volume and favorable chart structure enhances the reliability of this bullish setup.
Investor sentiment toward this project is also increasing, reflecting growing confidence in both its long-term potential and near-term trading opportunities. This rising interest aligns with the technical signals, further strengthening the possibility of a significant upward price move.
In conclusion, KAITOUSDT is poised for a potential breakout as it nears the end of its falling wedge pattern. With a projected gain of 90% to 100% and increasing investor participation, this setup could present a powerful trading opportunity for market watchers.
✅ Show your support by hitting the like button and
✅ Leaving a comment below! (What is You opinion about this Coin)
Your feedback and engagement keep me inspired to share more insightful market analysis with you!
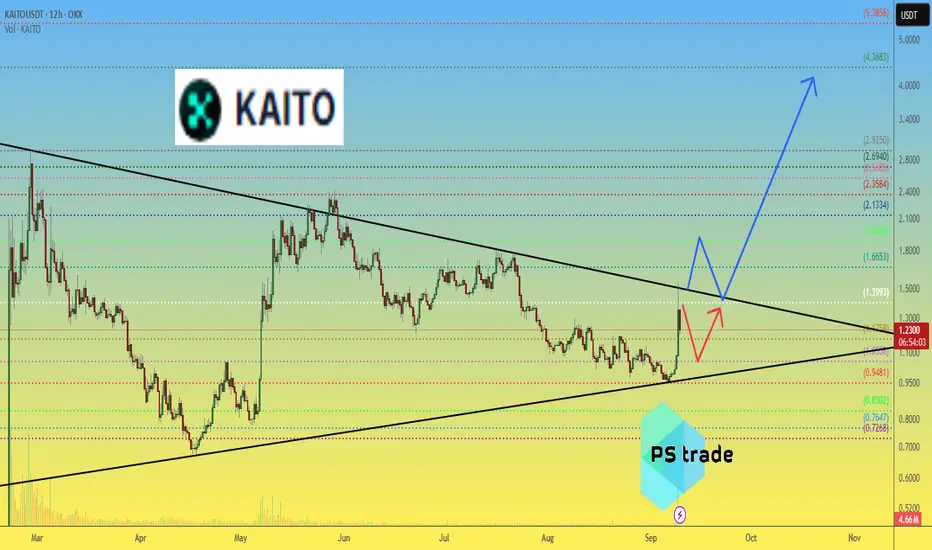
KAITO price analysis📊 The chart of OKX:KAITOUSDT suggests consolidation is coming to an end.
Historically, such phases often precede a strong breakout move 🚀
Key question for traders:
▪️ Would you take profits at ❤ $2 🔥 $3 👍 $5 or hold for a much higher target?
Your insights matter — share your view in the comments 👇
It will be interesting to compare different strategies within the community.
🧠 DYOR | This is not financial advice, just thinking out loud.
______________
◆ Follow us ❤️ for daily crypto insights & updates!
🚀 Don’t miss out on important market move
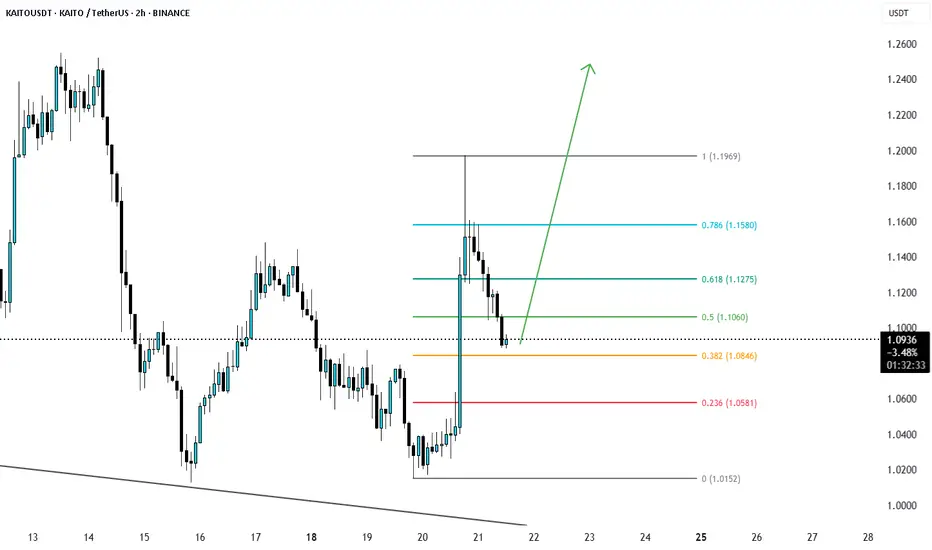
KAITOUSD Eyes Continuation Toward $1.26 After Fib RetestKAITOUSD recently enjoyed a strong bullish run before entering a period of consolidation. The price has now reached the 0.385 Fibonacci retracement level, a key support zone often watched for bullish continuation.
If buyers defend this Fib level, the price may soon resume its upward momentum, with the next major upside target projected around $1.26. This move would align with continuation of the broader bullish trend.
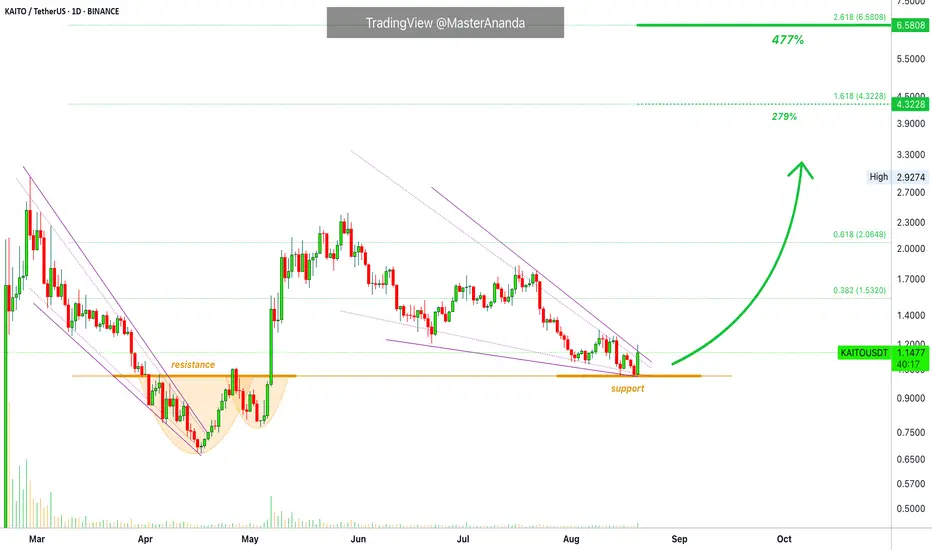
Kaito Technical Analysis & 477% Higher High TargetThe previous cup and handle reversal pattern neckline, resistance, is now working as support producing a higher low for KAITOUSDT.
Will the current move end as a higher low or is KAITO set to move lower?
To answer this question we can look at the volume indicator. Notice how trading volume has been flat during the entire retrace. Between late May and present day.
This lack of volume is what reveals poor participation by the bears. The last volume rise happened when there was an advance. The current volume breakout is happening on a green candle.
The lowest price since May was hit 15-August and yet bear volume was also none existent on this date. I am making the case that a weak bearish bias is a bullish signal.
Higher highs and higher lows.
The first peak appeared in May and the retrace is ending as a higher low. The next move is a higher high and we have mainly two targets. $4.32 and $6.58. Profits potential start at 279% the first target and 477% the second target.
Thank you for reading.
Namaste.
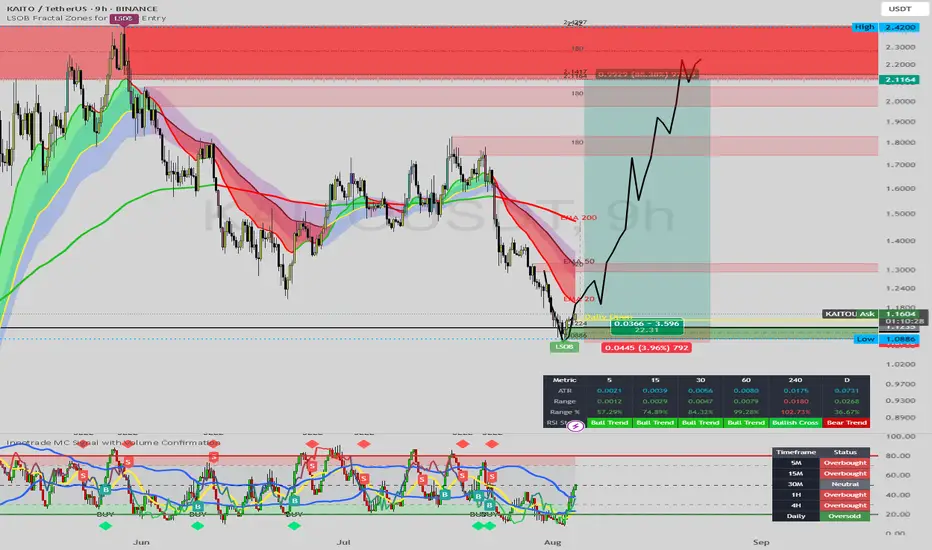
KAITO/USDT: High-Reward Long Setup from BIG BANG THEORYFirstly, our Algo-based indicators are used to create this analysis. Follow me so you don't miss, Boost and leave your comments if you profited with our posts, so we may continue:
This 9-hour chart for KAITO/USDT highlights a compelling long trade setup originating from a critical support level, suggesting the potential for a significant rally.
Key Support Bounce: The price has found strong support and reversed from a key "LSOB" (Liquidity Sweep Order Block) zone, with the low established at $1.0886. This type of level often marks significant turning points where liquidity is hunted before a move in the opposite direction.
Indicator Confirmation: The custom indicator at the bottom of the chart strongly supports a bullish reversal. It shows the price moving sharply out of the deep oversold "BUY" zone. Furthermore, the "Daily" timeframe status is marked as "Oversold," adding significant weight to the potential for a strong bounce or trend reversal.
Entry: Around the current price levels (~$1.16).
Stop Loss: Tightly placed just below the recent low at approximately $1.0886.
Take Profit: The primary target is set at $2.1164, which aligns with a major resistance zone.
Risk/Reward: This setup presents an exceptional risk-to-reward ratio of approximately 22:1, with a potential gain of over 88%.
Strategy:
The illustrated black line projects a strong rally from the current accumulation zone. The move is expected to break through intermediate resistance levels around $1.30 and $1.80 before pushing towards the final target.
Conclusion:
The confluence of a bounce from a major liquidity zone, strong confirmation from oversold indicators, and a well-defined trade setup with a massive risk-to-reward ratio makes this a very compelling bullish scenario for KAITO/USDT.
Disclaimer: This analysis is for educational purposes only and should not be considered financial advice. Always conduct your own research and manage risk appropriately.
#KAITOUSDT Trade Setup
📌 Coin: KAITO (Kaito AI)
💰 Buy Levels:
✅ Accumulation Zone: $1.6178 – $1.7490
🧠 Fundamental Analysis (FA) – In Short
*️⃣ Sector: Artificial Intelligence / Web3 Search Engine
*️⃣ Use Case: Kaito is building an AI-powered search engine for Web3 data, aiming to index blockchain content (tweets, research, news, protocols, token data) into an intelligent, searchable interface.
*️⃣ Tech: Combines large language models (LLMs) with on-chain and off-chain datasets. Focused on real-time, multi-modal Web3 knowledge access and discovery tools.
*️⃣ Product Suite: Includes the Kaito AI Chatbot, Crypto Search, and Alpha Feed, tailored for researchers, traders, and analysts.
*️⃣ Adoption: Early traction among pro users and analysts. Interface comparable to Bloomberg Terminal for crypto insights.
*️⃣ Investors: Backed by top VCs like Dragonfly, Sequoia Capital, and Superscrypt.
*️⃣ Narrative Fit: Positioned as a Web3 version of Google Search, enhanced by AI. High appeal during AI + crypto convergence narrative.
🎯 Bull Market Target (Realistic)
Target Range: $3.00 – $4.50
*️⃣ Based on utility growth, user traction in research platforms, and increased demand for on-chain intelligence.
🚀 Mega Bullish Target (Speculative Top)
Target Range: $7.00 – $10.00+
*️⃣ If Kaito becomes the go-to AI gateway for Web3 data and secures major integrations with CEXs, dApps, or L2 ecosystems.
✅ Final Take
🧠 KAITO is an AI+Web3 data play with real product differentiation, targeting serious users and information flow in a fragmented crypto space.
Your entries fall near post-launch consolidation range, ideal if accumulation sustains and AI narratives resurface.
#KAITOUSDT
Buy : - 1.61782500 - 1.74900000
Target 1: 1.88017500
Target 2: 2.01135000
Target 3: 2.27370000
Target 4: 2.90334000
Stop-Loss: 1.31515125
Risk/Reward: 20.00% / 66.00%
R:R = 2:1
ROI: 30.00%
Risk Percentage / Position size:1%
Duration:45 - 90 Days
Confidence in Trade: Mid
we ask Allah reconcile and repay.
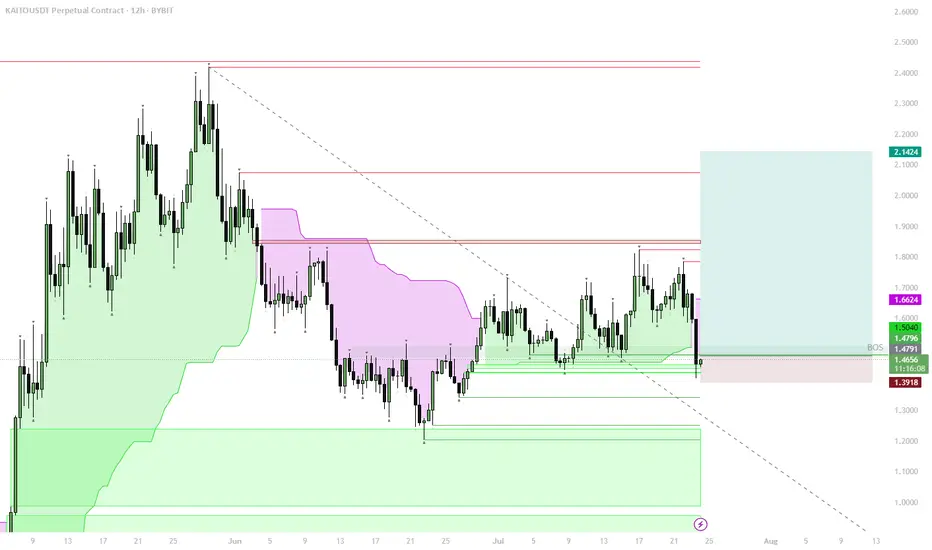
KAITO – Structural Flip, Bullish Accumulation ZoneStructural Shift:
Price reclaimed the key 1D S/R + BOS (Break of Structure) level, signaling a major trend change from bearish to bullish.
Trend Confirmation:
The move above $1.48–$1.50 zone confirms a bullish market structure. This level is now strong support.
Accumulation Opportunity:
The area between $1.65–$1.50 is ideal for spot accumulation, as it aligns with the reclaimed BOS and the lower edge of the bullish structure.
Upside Targets:
If the bullish structure holds, price could target $1.66 (local resistance), with the next targets at $1.85, $2.14, and potentially higher if momentum continues.
Invalidation:
A break and close below $1.48 would invalidate this bullish scenario and signal a return to the previous range.
The reclaim of the BOS level, with a shift above 1D S/R, marks a clear bullish structural flip on the chart. Historically, such shifts create strong accumulation zones just above the reclaimed level, where risk/reward is best for spot buys. Buying into the $1.65–$1.50 range aligns with both trend-following and classic Smart Money concepts: enter after the structural confirmation, not before. Invalidation is clear below $1.48, where structure would flip bearish again.
#Kaito Yapping for kaito here. Daily TF looks alright, if we start pushing hard here we might push for more!!!
On weekly it's trading inside a ascending triangle & with the way market is have feeling we might push up BUT risking only 3% here ;)

Kaito Long Kaito appears to be lagging behind. However sentiment is showing over 80% is short on the 1hr chart and 61% is short on the 12hr time frame. We will look for a contrarian view to look for long set ups.

KAITO | High MindshareKAITO presents a compelling bullish setup as social media attention drives renewed interest in this token. The chart shows a textbook bounce from the ascending trendline support around $1.25, with price now testing the upper consolidation zone.
**Key Technical Points:**
• Clean bounce off multi-month ascending trendline
• RSI recovering from oversold conditions
• Breaking above immediate resistance levels
• Social media buzz providing fundamental catalyst
**Trade Setup:**
• **Entry**: Golden box zone (slight pullback from current levels)
• **Target**: Upper green resistance zone around $1.42-$1.48
• **Stop Loss**: Below $1.20 (trendline violation)
**Risk Management:**
The ascending trendline acts as critical support - any close below $1.20 would invalidate the bullish case. Social media hype can be volatile, so position sizing should account for potential quick reversals. Volume confirmation on any breakout above the consolidation zone would strengthen the bullish thesis significantly.

Bullish continuationPrice has consolidating above the 200 SMA and the consolidation seems to continue above support.
My target is 1.5840
SL is 1.3850

Signals Are Lining Up for a KAITO Breakout! Key Levels to WatchYello, Paradisers! Are you watching what just happened with #KAITO? Because this could be the early phase of a massive reversal after weeks of correction, and the risk-reward setup is getting too attractive to ignore…
💎After a strong bullish rally, KAITO entered a classic falling wedge correction, a bullish continuation pattern. Now, the price is approaching critical levels and beginning to show signs of strength, printing a bullish divergence on the RSI.
💎Recently, KAITO tested a major support zone between $1.200 and $1.250, and reacted positively. Even more promising, price action is shaping a potential morning star pattern, a powerful reversal signal, right at this demand zone.
💎#KAITOUSDT looks primed to retest the falling wedge resistance at $1.40. This is the first big hurdle, and if bulls manage to hold strength, price could quickly see momentum push price towards $1.60–$1.70, a heavy resistance area where aggressive profit-taking is expected.
💎If the wedge breakout confirms, the broader structure suggests that KAITO has the potential to run all the way to $2.00–$2.10. That’s not just a psychological level, it also marks the pattern target and aligns with the 50% Fibonacci retracement of the prior downtrend.
Paradisers, strive for consistency, not quick profits. Treat the market as a businessman, not as a gambler.
MyCryptoParadise
iFeel the success🌴

KAITOUSDT Perpetual – Breakout Anticipation Long SetupKAITOUSDT is showing early signs of a potential breakout after a tight consolidation range, with price action stabilizing above the key zone at $1.3776. This setup aims to capture the next impulsive leg upward.
Trade Details:
Position: Long
Entry: $1.3776
Stop Loss: $1.3020
Take Profit: $1.5891
Setup Type: Pre-breakout Accumulation / Range Expansion
Setup Rationale:
Market has been ranging tightly with decreasing volatility
Bullish momentum likely to follow upon break of local resistance
Risk is minimized with stop just below the range low
High reward potential if price targets previous resistance above $1.58
This is a classic volatility squeeze setup where a sudden expansion to the upside is expected after prolonged sideways action.
