
LRCUSDT Forming Falling WedgeLRCUSDT is forming a clear falling wedge pattern, a classic bullish reversal signal that often indicates an upcoming breakout. The price has been consolidating within a narrowing range, suggesting that selling pressure is weakening while buyers are beginning to regain control. With consistent volume

LRC Showing Renewed StrengthLRC - movement is observed within the bullish flag pattern
We have exited the liquidity zone after a false breakout
It is now more likely that the movement will continue within the pattern to its upper boundary according to Fibonacci levels
Full breakdown with levels and graphs on the website

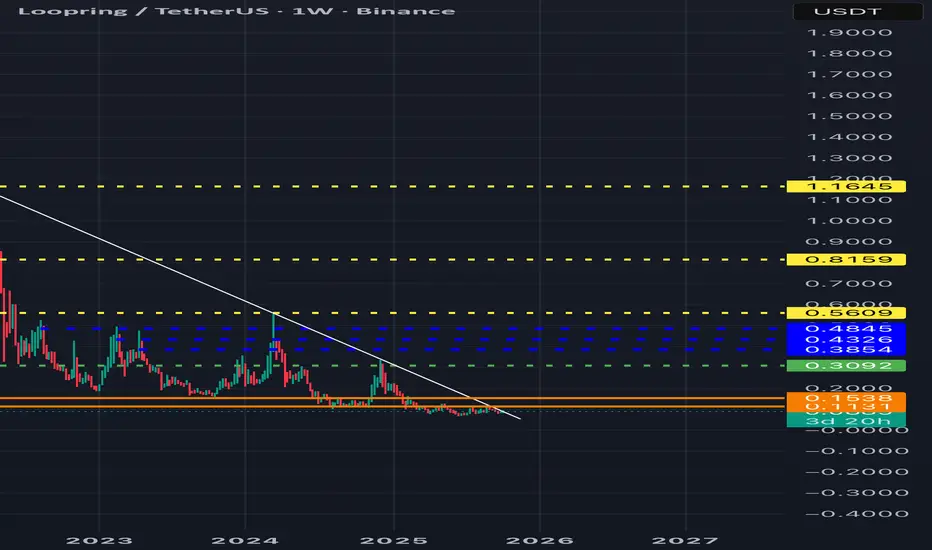
LRC/USDT – Horizontal channel. Continuing to work.Loopring - is an open protocol designed for building decentralized crypto exchanges.
CoinMarketCap : #262
Since the publication of my trading idea, the price has reached the resistance zone of the inner channel at $0.3338 (+158%). From there, it retraced back to the support of the outer channel,

Keep Your Eyes on LRC (Short with tight stop or Long at BO)Attention traders! It's time to buckle up, because LRC is facing some serious rejection at a major resistance level on the 4-hour timeframe. But don't be intimidated by this wall of resistance, because we're not backing down. We're going to wait for the breakout before opening any long positions, or

LRCUSDT The multi-year resistance broke!!!$Loopring managed to break its multi-year resistance a few hours ago and we are expecting a growth of several hundred percent, just keep an eye on it.
LRC/USDTLRC is moving inside the channel pattern in weekly , Now it is at support zone from where it can give amazing move (140% nearly) if the altcoins gain volume in market-cap .
and at the same time Bitcoin dominance is decreasing and altcoins dominance is started increasing , so look on all the altco

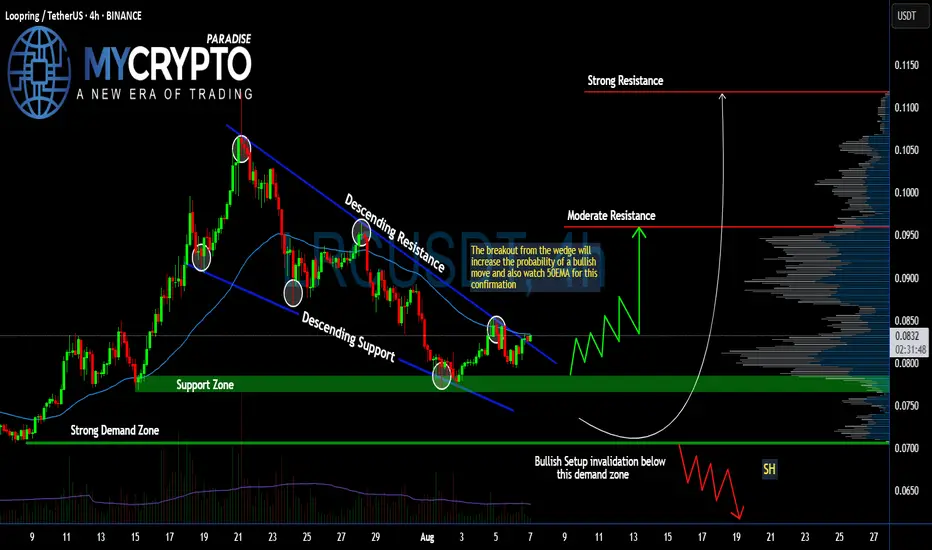
#LRC Ready for a Massive Recovery From Here | Must Watch Yello, Paradisers! Is #LRCUSDT finally ready for a breakout, or is it just another trap for early bulls? Let's break down the current structure of #LRC.
💎#Loopring ( CAPITALCOM:LRC ) has been moving within a descending wedge pattern for weeks, with price consistently making lower highs and lower lo
3 RR less likely fillIf this fills it should be a good option! Target can be adjusted. entry as well. If there's a major bounce before fill cancel the trade.

LRCUSDT Forming Bullish PennantLRCUSDT is forming a bullish pennant pattern, which is one of the most reliable continuation setups in technical analysis. After a strong upward move, the price has entered into a consolidation phase, creating a pennant structure that often signals the possibility of another breakout to the upside.

See all ideas
Summarizing what the indicators are suggesting.
Oscillators
Neutral
SellBuy
Strong sellStrong buy
Strong sellSellNeutralBuyStrong buy
Oscillators
Neutral
SellBuy
Strong sellStrong buy
Strong sellSellNeutralBuyStrong buy
Summary
Neutral
SellBuy
Strong sellStrong buy
Strong sellSellNeutralBuyStrong buy
Summary
Neutral
SellBuy
Strong sellStrong buy
Strong sellSellNeutralBuyStrong buy
Summary
Neutral
SellBuy
Strong sellStrong buy
Strong sellSellNeutralBuyStrong buy
Moving Averages
Neutral
SellBuy
Strong sellStrong buy
Strong sellSellNeutralBuyStrong buy
Moving Averages
Neutral
SellBuy
Strong sellStrong buy
Strong sellSellNeutralBuyStrong buy
Displays a symbol's price movements over previous years to identify recurring trends.