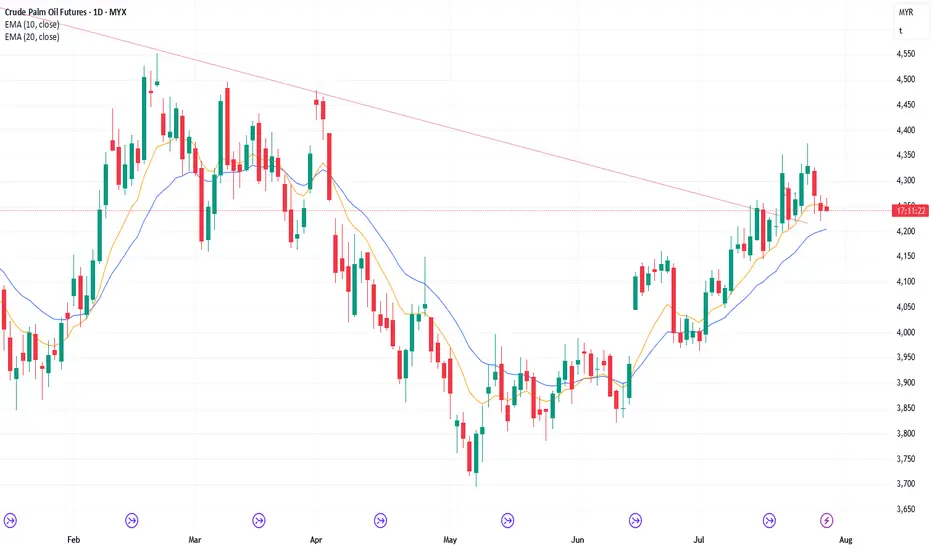
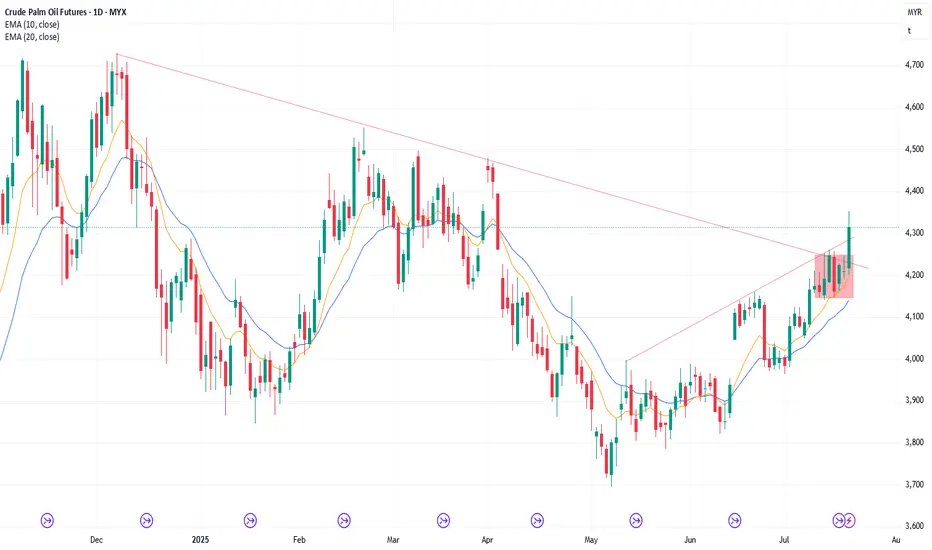
25/7/25 Follow-through Buying or Pullback Instead?
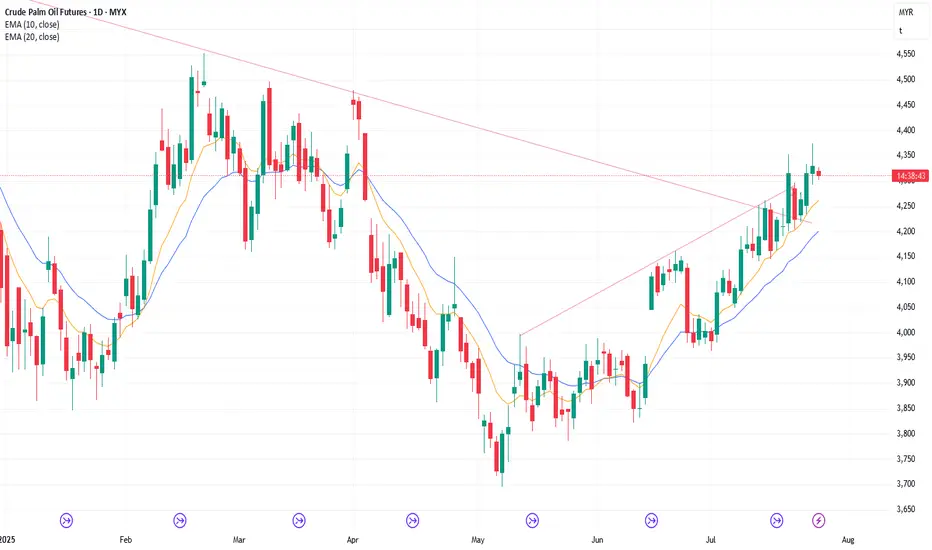
Thursday’s candlestick (Jul 24) was a bull doji closing slightly below the middle of its range with a long tail above.
In our last report, we said the odds slightly favor sideways to up. Traders would see if the bulls could create follow-through buying, breaking above the July 18 high, or if th
Related commodities
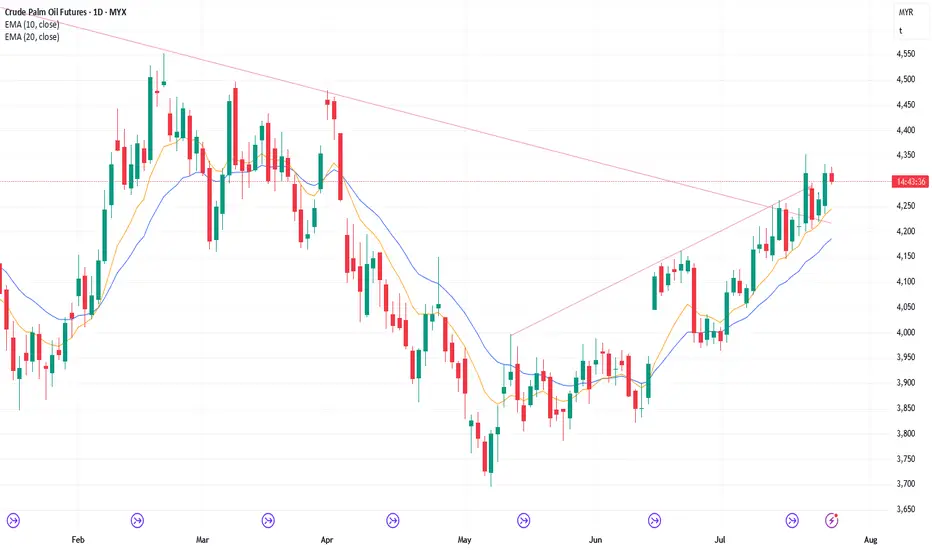
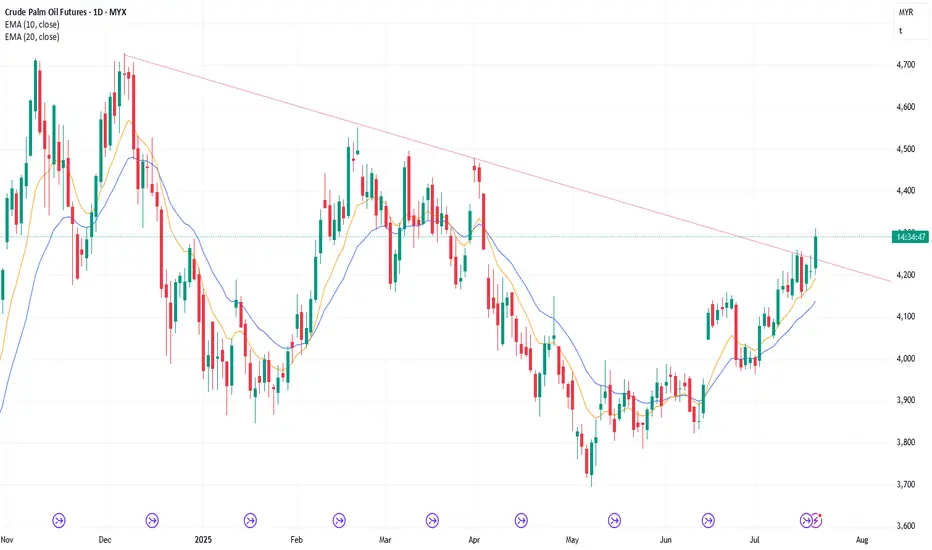
28/7/25 Minor Pullback or Something Stronger?
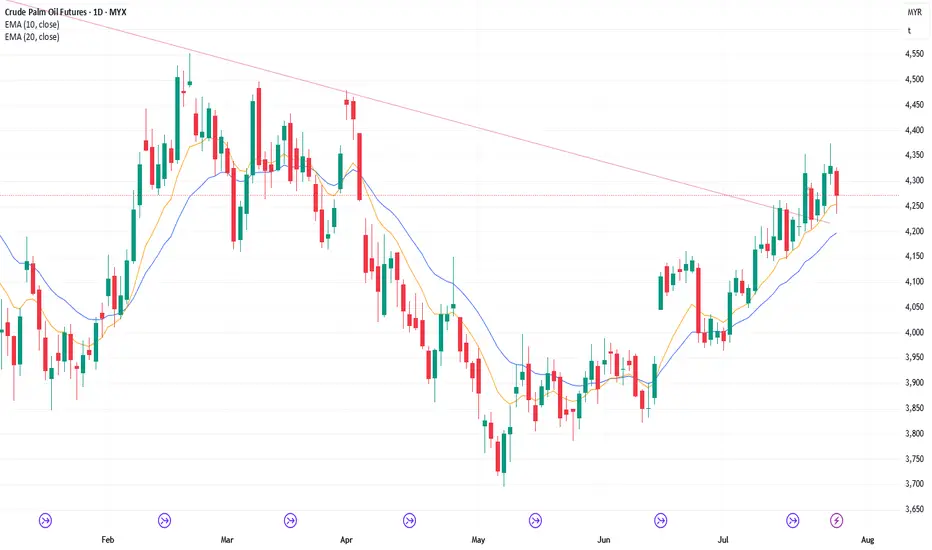
Friday’s candlestick (Jul 25) was a bear bar closing slightly below the middle of its range with a long tail below.
In our last report, we stated that traders would assess whether the bulls could generate follow-through buying or if the bears would create a strong pullback, which would close th
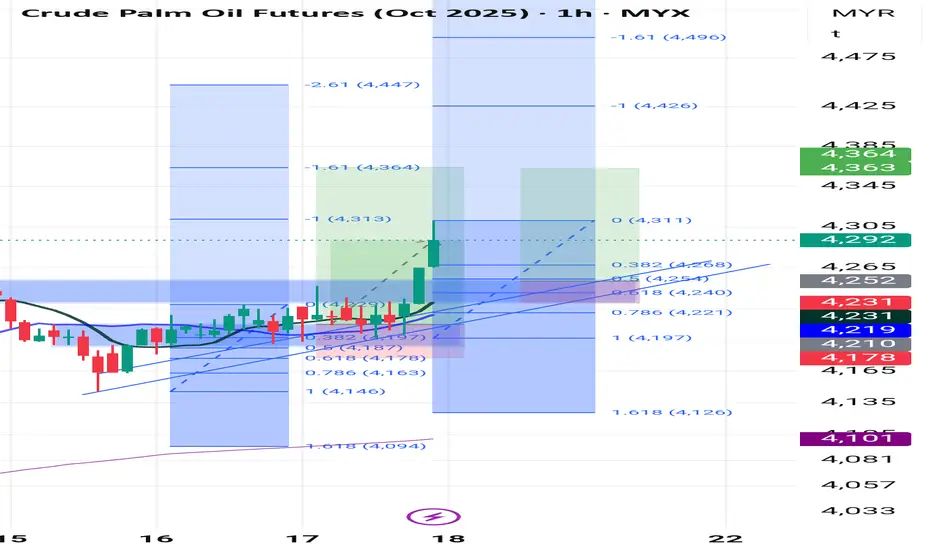
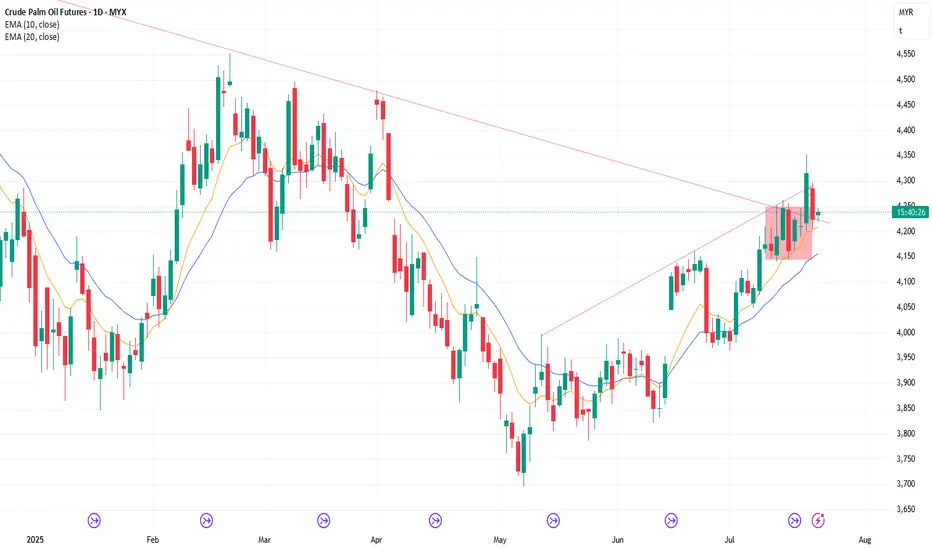
continuation bullish modeBased on the chart tf 1h, looks still strong to bullish mode. retracement area maybe between 4254 to 4230 which is area hh before (major market structure and Fibonacci retracement 0.5 to 0.618. and theres also strong support trendline in that area. however, will see how much the gap this morning .18
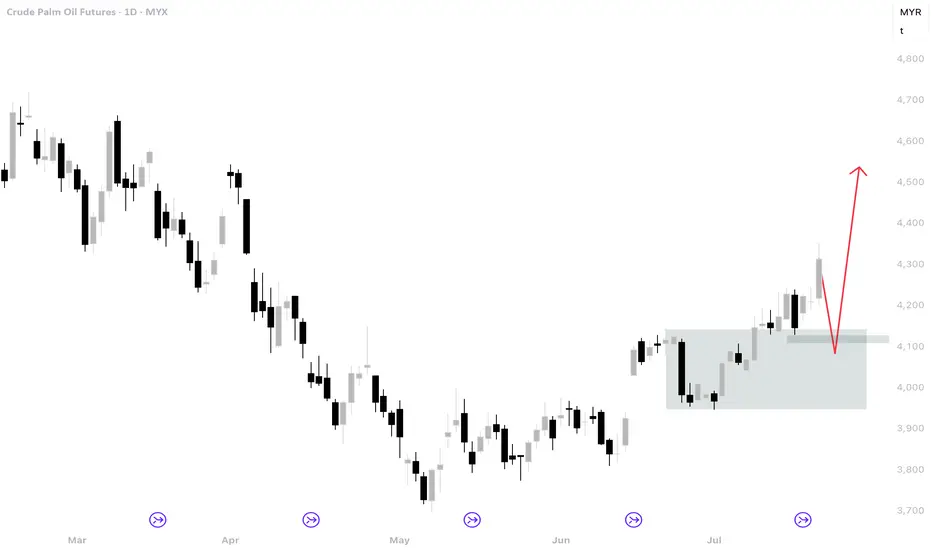
FCPO Week 30 2025: 4500?It took a very long time to reach 4300. The next target is 4500. However it won't be easy because there are a few resistance above 4300. Expecting that price might retrace a bit before continuing higher.
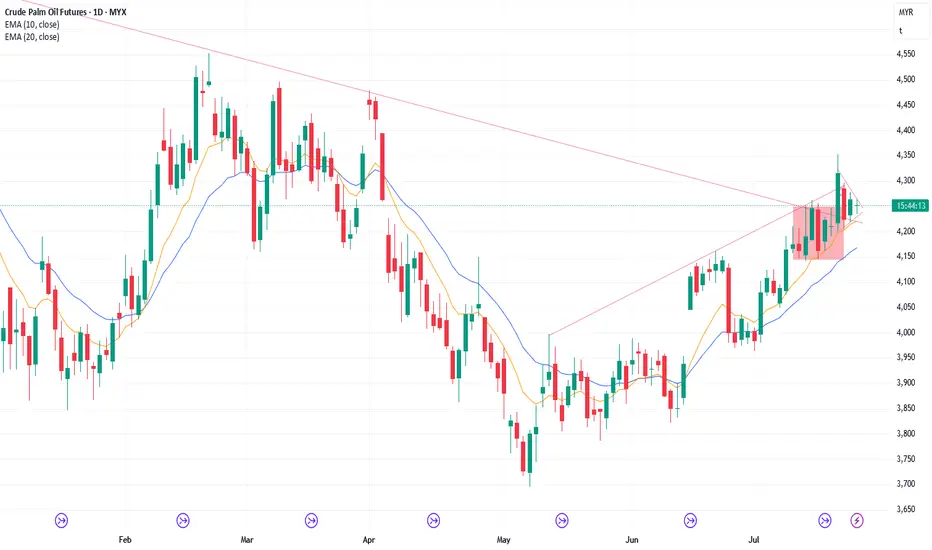
29/7/25 Pullback Underway, Minor or Something More?
Monday’s candlestick (Jul 28) was a bear doji bar closing around the middle of its range with prominent tails.
In our last report, we stated traders would see if the bears could create follow-through selling, or if the pullback phase would be weak and sideways instead.
The market traded slight
24/7/25 Buying Pressure Is Slightly Stronger
Wednesday’s candlestick (Jul 22) was a bull bar closing near its high.
In our last report, we said traders would see if the bulls could create follow-through buying and test near the July 18 high, or if the market would form a breakout below the triangle and ii (inside-inside) pattern instead.
23//7/25 No FT Selling Again. Market in Breakout Mode
Tuesday’s candlestick (Jul 22) was an inside bull bar closing near its high.
In our last report, we said traders would see if the bears could create follow-through selling, or if the market would trade higher and retest the July 18 high instead.
The market traded higher for the day, and the be
22/7/25 Can Bears Finally Create Follow-through Selling?
Monday’s candlestick (Jul 21) was a big inside bear bar closing in its lower half with a prominent tail below.
In our last report, we said traders would see if the bulls could create follow-through buying, or if the follow-through buying over the next 1-2 days would be limited. If this is the c
21/7/25 Can Bulls Create FT Buying Over Next Few Days?
Friday’s candlestick (Jul 18) was a big bull bar closing in its upper half with a prominent tail above.
In our last report, we said traders would see if the bulls could close the day's candlestick near its high, or if the daily candlestick would close with a long tail above or below the middle
18/7/25 Weekly Candlestick To Close Near Its High or Tail Above?
Thursday’s candlestick (Jul 17) was a doji bar with a long tail above.
In our last report, we said traders would see if the bulls could create a follow-through bull bar testing the July 14 high, or if the market would form a lower high (versus July 14) and be followed by some selling pressure i
See all ideas
A representation of what an asset is worth today and what the market thinks it will be worth in the future.
Displays a symbol's price movements over previous years to identify recurring trends.
Frequently Asked Questions
The nearest expiration date for Crude Palm Oil Futures is Sep 15, 2020.
Traders prefer to sell futures contracts when they've already made money on the investment, but still have plenty of time left before the expiration date. Thus, many consider it a good option to sell Crude Palm Oil Futures before Sep 15, 2020.