Back in the game baby!I think we are nearly in the clear and back in the game. There will most likely be a pullback, I’m thinking as low as 3.75 in the next 2 days but we may be shifting fully into bull control. With such a huge discrepancy between contracts it is impossible that the next one won’t at least hit $4.2. Winter is here stay warm. Buy all dips from hear until Feb, good luck all.
Micro Henry Hub Natural Gas Futures (Jun 2026)
No trades
Market insights

Natural Gas Is Hibernating Ahead of an Upcoming SwingToday, we will discuss why natural gas is hibernating ahead of an upcoming swing. We will deep dive into:
1) the impact of inflation on commodity prices,
2) the technical outlook, covering both long-term and short-term perspectives, and
3) the fundamental confirmation of this view, based on the “Five Things to Watch in Energy Markets in 2026.”
Henry Hub Natural Gas Futures & Options
Ticker: NG
Minimum fluctuation:
0.001 per MMBtu = $10.00
Disclaimer:
• What presented here is not a recommendation, please consult your licensed broker.
• Our mission is to create lateral thinking skills for every investor and trader, knowing when to take a calculated risk with market uncertainty and a bolder risk when opportunity arises.
CME Real-time Market Data help identify trading set-ups in real-time and express my market views. If you have futures in your trading portfolio, you can check out on CME Group data plans available that suit your trading needs www.tradingview.com

Natural Gas At Crucial Levelwww.tradingview.com
Natural Gas recent Daily Move is at crucial Juncture and at Interesting confluence
1. Break out of Bigger Parallel channel
2. Retest of the channel and raise
3. Break of Smaller Parallel Channel
4. Todays Daily candle retesting 0.9 of Fib.
Entry - 3.959
Targets - 4.656, 5.618,
Long term Targets -- 6.634 ( Minimize to see the confluence of Fibonacci's.
Stop Loss -- 3.685
Long Term View
www.tradingview.com

Natural Gas on January 26I expect to see short to 3$ at long term.
Nearly targets are 3.75 /3.5/ 3.2
Principal is simple if the SL reached we wanting until it's goes back at the price reached and open the same position. The direction is considered is only on Short scenario

Are bulls back??Hard to say, finally getting some kind of structure. We bottomed at 3.46 only once, if we go back down we would hope to see a double bottom off that. 4hr is halfway through its extension and slowing down a bit. We need to see 4 hour strengthen again to get a real rally going off of this move. If not spot will be returning to $4. We are approaching the cloud but we would want to see this break the cloud by Monday and that prospect is slowly diminishing. Widening out to Daily RSI slightly crossed but hasn’t turned fully positive. MACD is beginning to plateau getting ready for a turn around but it isn’t confirmed yet. Good luck all. We will re analyze on Monday.

NATGAS Will Grow! Buy!
Hello,Traders!
NATGAS reacted strongly from a higher-timeframe demand zone, showing clear absorption of sell-side liquidity. The impulsive bullish displacement suggests smart money accumulation, with structure now favoring a continuation toward the next upside liquidity pool.Time Frame 3H.
Buy!
Comment and subscribe to help us grow!
Check out other forecasts below too!
Disclosure: I am part of Trade Nation's Influencer program and receive a monthly fee for using their TradingView charts in my analysis.


Natural Gas Stock Forecast | Oil | Dollar | Silver | GoldCatch the latest commodities trading insights! This week's market analysis includes a look at both sides of the coin for oil, gold and silver. Plus, get some helpful technical analysis and trading tips to guide your decisions.
AMEX:UNG Natural Gas stock Bulls NatGas Support & Resistance Guide
NYMEX:CL1! USO Oil Stock price Forecast
DXY US dollar Stock analysis
COMEX:GC1! Gold XAUUSD Stock price Forecast
COMEX:SI1! Silver XAGUSD stock analysis

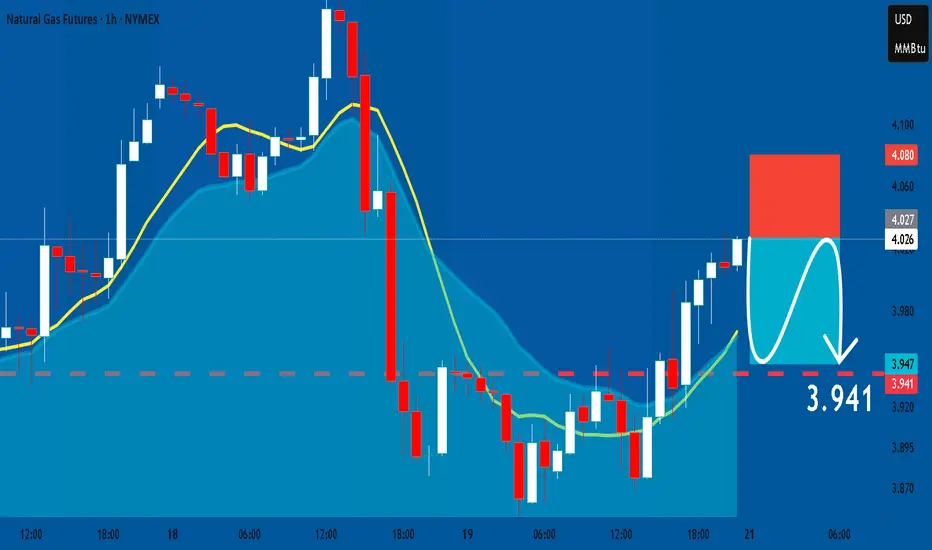
NATGAS: Short Signal with Entry/SL/TP
NATGAS
- Classic bearish formation
- Our team expects fall
SUGGESTED TRADE:
Swing Trade
Sell NATGAS
Entry Level - 4.027
Sl - 4.080
Tp - 3.941
Our Risk - 1%
Start protection of your profits from lower levels
Disclosure: I am part of Trade Nation's Influencer program and receive a monthly fee for using their TradingView charts in my analysis.
❤️ Please, support our work with like & comment! ❤️
Next week outlookSo, if we can hold our higher high today and into Sunday, bulls will be back in control. My prediction is we gun straight toward $4.2 starting next session and we hit that target around Tuesday night. This is all resting on 4hr turning positive on Sundays night session. There is still a chance for collapse of the 4hr and we head down to retest prior low. If we break prior low all this is out the window and bulls have lost their chance for now. Entering now is high risk, so for low risk traders wait for the 4 hour positive cross confirmation.

Natural Gas Stock Forecast | Oil | Dollar | Silver | GoldCatch the latest commodities trading insights! This week's market analysis includes a look at both sides of the coin for oil, gold and silver. Plus, get some helpful technical analysis and trading tips to guide your decisions.
AMEX:UNG Natural Gas stock Bulls NatGas Support & Resistance Guide
NYMEX:CL1! USO Oil Stock price Forecast
DXY US dollar Stock analysis
COMEX:GC1! Gold XAUUSD Stock price Forecast
COMEX:SI1! Silver XAGUSD stock analysis

$NG Volatility Remains high in Natty Natty continues to be whippy, keeping volatility historically high.
Tastytrade IVR = 77.9 as of 12/25/25
Selling OTM 30 Delta puts have been paying off directionally .
However, the real gains will come when the Vol collapses.
With Natty at these levels , will be looking at IRON CONDORS 20 deltas and less on the wings.
Will also be keeping duration rather short , staying in Jan & Feb 26 expo’s …

Natural Gas MCX Futures — Intraday Technical Analysis for 23-DecMCX:NATURALGAS1!
Natural Gas MCX Futures — Chart Pathik Intraday Levels for 23-Dec-2025
(If these levels add value to your trades, a quick boost or comment goes a long way in supporting this free content and keeping our trading community thriving!)
Natural Gas Futures are trading near 350.5, bouncing from intraday lows but still sitting just under the zero line at 351.20 after a sharp selloff, making this band the key intraday pivot between further recovery and continuation of downside.
Bullish Structure
Longs activate above the Long Entry level at 359.56 only after price reclaims 351.20 and the Add Long Pos. zone at 356.00 with higher lows.
Targets: 369.86 (Long Target 1 / primary profit zone) and 381.40 (Long Target 2 / extended move if a full short-covering leg unfolds).
Control: Any counter-trend longs from lower levels should keep stops tight below 349.50 (Long Exit), as a break there risks a fresh leg lower.
Bearish Structure
Shorts remain the preferred structure while price trades below 351.20 and especially on rejection from the Short Entry at 352.44 or from the Short Exit at 362.50 if tested.
Downside focus: 332.54 (Short Target 1) and 321.00 (Short Target 2) if selling pressure resumes after this bounce.
Control: Fast covers are required if price sustains above 356.00–359.56, where bearish structure weakens and a squeeze towards 369.86 can begin.
Neutral Zone
351.20 is today’s inflection—expect noisy, stop-hunting price action while natural gas oscillates between roughly 349.5 and 352.4 without decisive 15‑minute closes beyond either edge.
Every setup is designed for structure, plan, and logic—let the chart work for you, not your emotions.
Boost or comment if these levels help your preparation—help Chart Pathik keep delivering quality analysis to more intraday traders!

$LNG parallel range - move back to top of range over 2 months Widow maker dropped to the bottom of the channel. Question on whether it is a bounce and we head lower or a retracement back to top of range before the end of winter.

Natural Gas Stock Forecast | Oil | Dollar | Silver | GoldNatural Gas Stock Forecast | Oil | Dollar | Silver | Gold
AMEX:UNG NYMEX:CL1! COMEX:GC1! COMEX:SI1!

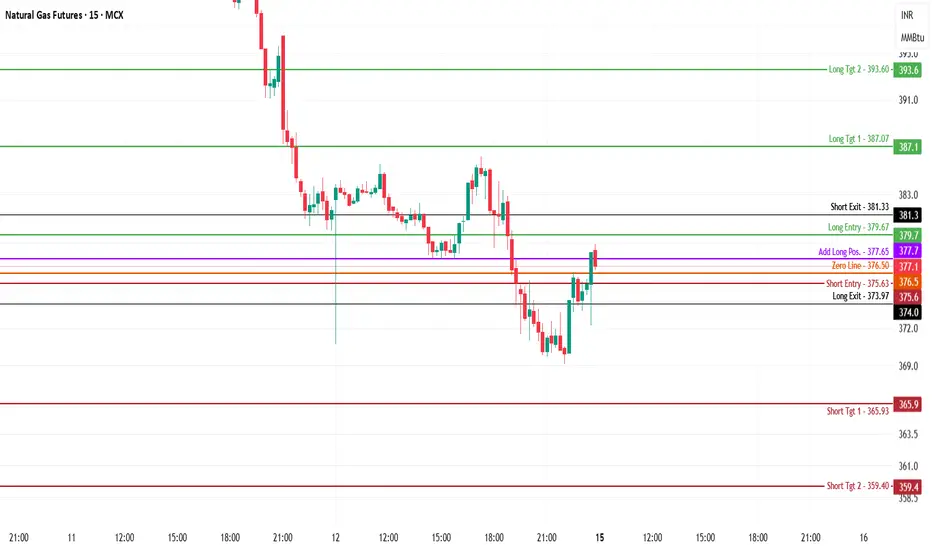
Natural Gas MCX Future - Intraday Technical Analysis - 15 Dec.25MCX:NATURALGAS1!
Natural Gas MCX Futures — Chart Pathik Intraday Levels for 15-Dec-2025
(If these levels add value to your trades, a quick boost or comment goes a long way in supporting this free content and keeping our trading community thriving!)
Natural Gas Futures are trading near 377.1, bouncing from recent lows and now testing the zero line at 376.50 along with the Add Long Position band at 377.65, making this area a critical decision zone for the next intraday leg. The trend is trying to turn from a sharp selloff into a corrective rebound, but overhead resistance remains close.
Bullish Structure
Longs activate above the Long Entry level at 379.67 once price sustains above the zero line and Add Long Pos. band with higher lows.
Targets: 387.07 (Long Target 1 / primary booking zone) and 393.60 (Long Target 2 / extended move if short-covering accelerates).
Control: Place stops or trail risk near 375.63–373.97 (Short Entry and Long Exit) to keep downside defined if the bounce fails and sellers reappear.
Bearish Structure
Shorts remain attractive if price fails to hold above 377.65–379.67 and rolls back under the zero line at 376.50.
Fresh shorts open below the Short Entry at 375.63, targeting continuation of the broader down move.
Targets: 365.93 (Short Target 1 / first profit zone) and 359.40 (Short Target 2 / extended downside if selling continues).
Neutral Zone
376.50 is today’s inflection—expect choppy, stop-hunting action while natural gas oscillates between roughly 375.6 and 379.7 without decisive 15‑minute closes beyond either side.
Every setup is designed for structure, plan, and logic—let the chart work for you, not your emotions.
Boost or comment if these levels help your preparation—help Chart Pathik keep delivering quality analysis to more intraday traders!
NG1! BULLS ARE GAINING STRENGTH|LONG
NG1! SIGNAL
Trade Direction: long
Entry Level: 4.099
Target Level: 4.647
Stop Loss: 3.733
RISK PROFILE
Risk level: medium
Suggested risk: 1%
Timeframe: 6h
Disclosure: I am part of Trade Nation's Influencer program and receive a monthly fee for using their TradingView charts in my analysis.
✅LIKE AND COMMENT MY IDEAS✅


NATGAS BULLISH CORRECTION AHEAD|LONG|
✅NATGAS draws back into a discounted pocket after purging sell-side liquidity, with price now poised to rebalance toward the inefficiency left above the last impulsive leg. Time Frame 1D.
LONG🚀
✅Like and subscribe to never miss a new idea!✅

NATGAS Free Signal! Sell!
Hello,Traders!
NATGAS price is reacting from a clear horizontal supply area after an aggressive displacement down, suggesting smart-money orderflow remains bearish. A retest into the imbalance aligns with premium pricing before continuation lower.
--------------------
Stop Loss: 4.724$
Take Profit: 4.527$
Entry: 4.623$
Time Frame: 3H
--------------------
Sell!
Comment and subscribe to help us grow!
Check out other forecasts below too!
Disclosure: I am part of Trade Nation's Influencer program and receive a monthly fee for using their TradingView charts in my analysis.

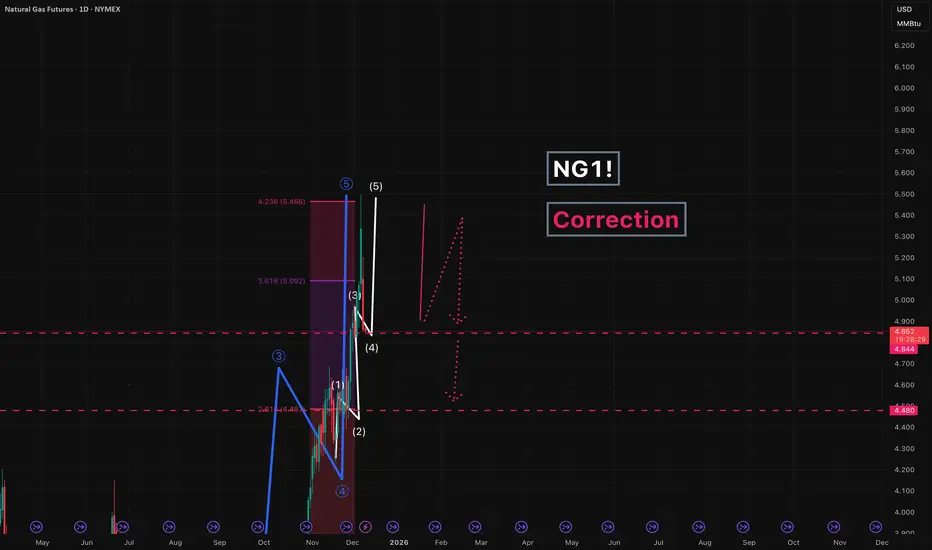
NG1! - correctionWe are currently correcting the impulsive move in Natural Gas.
First, we expect a pullback toward 4.850 (a move that is already in progress), followed by a continuation down into the 4.480 area.
---
Please subscribe and leave a comment.
You’ll get new information faster than anyone else.
---
Natural Gas MCX Futures — Intraday Technical Analysis 10-Dec. 25MCX:NATURALGAS1!
Natural Gas MCX Futures — Chart Pathik Intraday Levels for 10-Dec-2025
(If these levels add value to your trades, a quick boost or comment goes a long way in supporting this free content and keeping our trading community thriving!)
Natural Gas Futures are trading near 419.7, extending a strong downtrend and breaking decisively below the zero line at 421.70, keeping sellers firmly in control for the session. Every bounce so far is getting sold from lower highs, so the focus stays on short setups until price proves otherwise.
Bullish Structure
Longs activate only above the Long Entry level at 432.33, which would require a sustained reclaim back above the zero line and the Short Entry band at 427.47, signalling a potential trend shift rather than a mere pullback.
Targets on a confirmed reversal: 434.34 (Long Target 1 / first booking zone) and 442.30 (Long Target 2 / extended upside if short-covering accelerates).
Control: Any counter-trend long attempts should keep tight risk below 421.70–419.7, as a fresh breakdown from here reopens lower targets quickly.
Bearish Structure
Shorts remain the preferred structure as long as price holds below 421.70 and particularly on minor intraday pullbacks towards 421–425 that fail.
The prior Short Entry at 427.47 and Long Exit at 425.46 now act as supply; rallies into this zone can be used to re-enter or add shorts with defined risk above it.
Targets: 409.0 (Short Target 1 / primary booking level) and 401.0 (Short Target 2 / extended downside if selling pressure continues into the next demand zone).
Control: Fast short covers are required if price reclaims 427.47–432.33, where the bearish intraday structure weakens and a squeeze towards the long targets can start.
Neutral Zone
421.70 is today’s inflection—while natural gas holds below this zero line, bias stays sell-on-rise; only a sustained close back above it would shift the structure towards neutral-to-bullish.
Every setup is designed for structure, plan, and logic—let the chart work for you, not your emotions.
Boost or comment if these levels help your preparation—help Chart Pathik keep delivering quality analysis to more intraday traders!

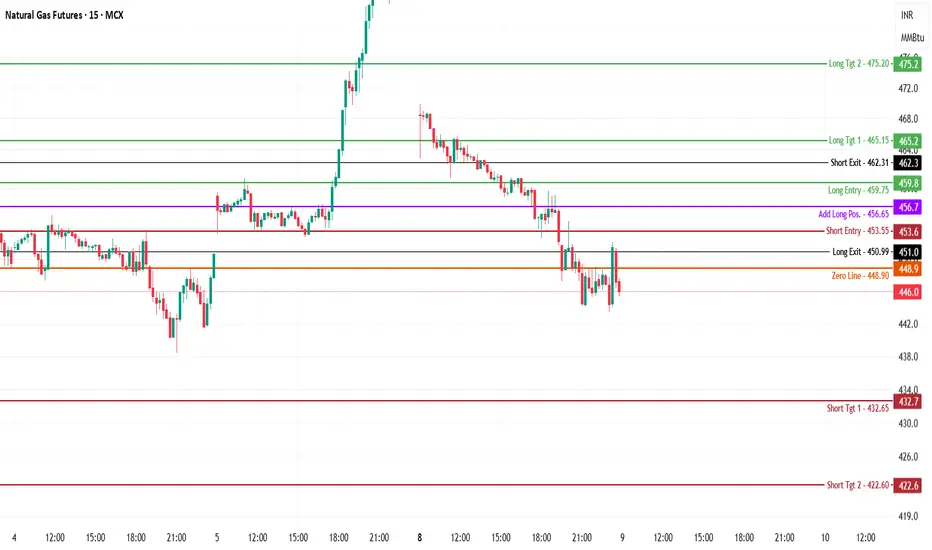
Natural Gas MCX Futures — Intraday Technical Analysis - 9 Dec.MCX:NATURALGAS1!
Natural Gas MCX Futures — Chart Pathik Intraday Levels for 09-Dec-2025
(If these levels add value to your trades, a quick boost or comment goes a long way in supporting this free content and keeping our trading community thriving!)
Natural Gas Futures are trading near 446, sliding in a short-term downtrend and hovering just below the zero line at 448.90 after a failed bounce, keeping sellers in primary control for now. Price is repeatedly rejecting the 450–453.5 band, making it a key supply zone for the session.
Bullish Structure
Longs activate only above the Long Entry level at 459.75, with aggressive counter-trend attempts considered only if price reclaims and sustains above the zero line at 448.90 and then the Short Entry band at 453.55.
Targets: 465.15 (Long Target 1 / major intraday booking zone) and 475.20 (Long Target 2 / extended upside if trend fully reverses).
Control: Stops or tight trailing risk can sit near 448.90–451.0 (zero line and Long Exit) on any long attempts to avoid getting trapped against the dominant downtrend.
Bearish Structure
Shorts remain the preferred structure while price trades below 448.90 and especially on intraday fails near 451.0–453.55.
Fresh shorts activate below the Short Entry at 453.55 after rejection, or on breakdown continuations from current levels as long as rallies get sold below the zero line.
Targets: 432.65 (Short Target 1 / first booking zone) and 422.60 (Short Target 2 / extended move if selling pressure continues).
Control: Fast short covers are required if price breaks and holds above 456.65–459.75, where downside structure weakens and a short-covering rally towards the long targets can start.
Neutral Zone
448.90 is today’s inflection and zero line—expect choppy, whipsaw action while natural gas oscillates between roughly 446 and 451 without decisive 15‑minute closes beyond either boundary.
Every setup is designed for structure, plan, and logic—let the chart work for you, not your emotions.
Boost or comment if these levels help your preparation—help Chart Pathik keep delivering quality analysis to more intraday traders!