Natural Gas Stock Forecast | Oil | Dollar | Silver | GoldNatural Gas Stock Forecast | Oil | Dollar | Silver | Gold
AMEX:UNG NYMEX:CL1! COMEX:GC1! COMEX:SI1!
Related commodities

$LNG parallel range - move back to top of range over 2 months Widow maker dropped to the bottom of the channel. Question on whether it is a bounce and we head lower or a retracement back to top of range before the end of winter.

NATGAS BULLISH CORRECTION AHEAD|LONG|
✅NATGAS draws back into a discounted pocket after purging sell-side liquidity, with price now poised to rebalance toward the inefficiency left above the last impulsive leg. Time Frame 1D.
LONG🚀
✅Like and subscribe to never miss a new idea!✅

NG1! BULLS ARE GAINING STRENGTH|LONG
NG1! SIGNAL
Trade Direction: long
Entry Level: 4.099
Target Level: 4.647
Stop Loss: 3.733
RISK PROFILE
Risk level: medium
Suggested risk: 1%
Timeframe: 6h
Disclosure: I am part of Trade Nation's Influencer program and receive a monthly fee for using their TradingView charts in my analysis.
✅LI

Natural Gas MCX Future - Intraday Technical Analysis - 15 Dec.25MCX:NATURALGAS1!
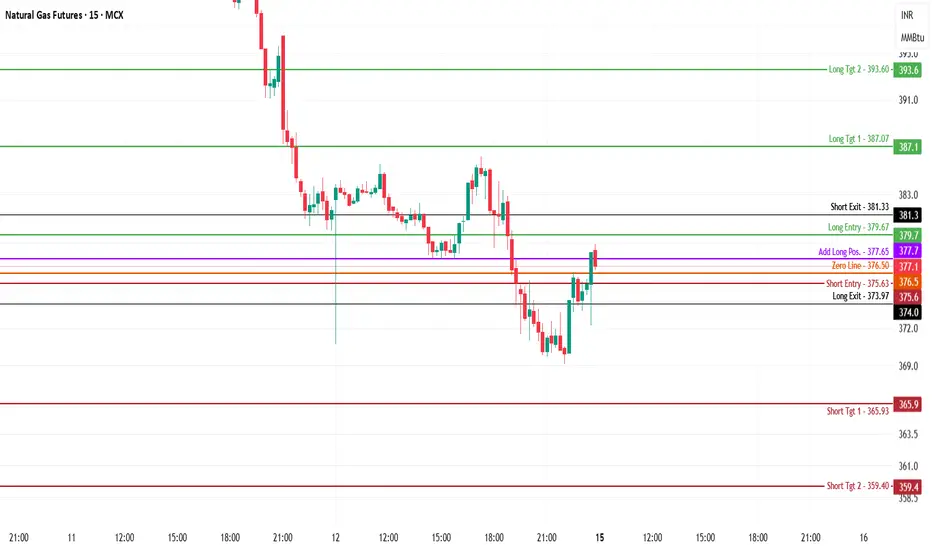
Natural Gas MCX Futures — Chart Pathik Intraday Levels for 15-Dec-2025
(If these levels add value to your trades, a quick boost or comment goes a long way in supporting this free content and keeping our trading community thriving!)
Natural Gas Futures are trading near 377.1, bo
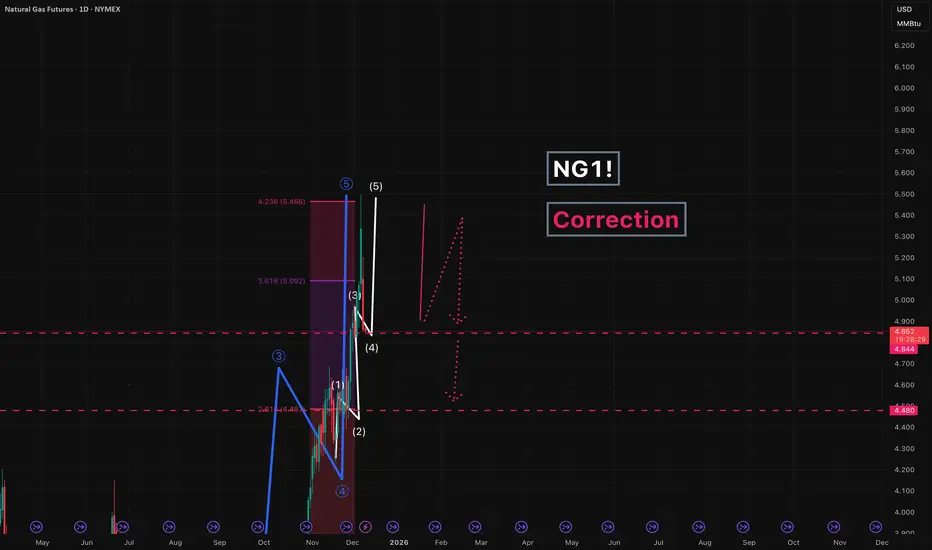
NG1! - correctionWe are currently correcting the impulsive move in Natural Gas.
First, we expect a pullback toward 4.850 (a move that is already in progress), followed by a continuation down into the 4.480 area.
---
Please subscribe and leave a comment.
You’ll get new information faster than anyone else.
---
Natural Gas Stock Forecast | Oil | Dollar | Silver | GoldNatural Gas Stock Forecast | Oil | Dollar | Silver | Gold
NYMEX:NG1! NYMEX:CL1! COMEX:GC1! COMEX:SI1!

NATGAS Free Signal! Sell!
Hello,Traders!
NATGAS price is reacting from a clear horizontal supply area after an aggressive displacement down, suggesting smart-money orderflow remains bearish. A retest into the imbalance aligns with premium pricing before continuation lower.
--------------------
Stop Loss: 4.724$
Take Profi

NATGAS What Next? SELL!
My dear friends,
NATGAS looks like it will make a good move, and here are the details:
The market is trading on 5.337 pivot level.
Bias - Bearish
Technical Indicators: Supper Trend generates a clear short signal while Pivot Point HL is currently determining the overall Bearish trend of the mar

Natural Gas MCX Futures — Intraday Technical Analysis - 9 Dec.MCX:NATURALGAS1!
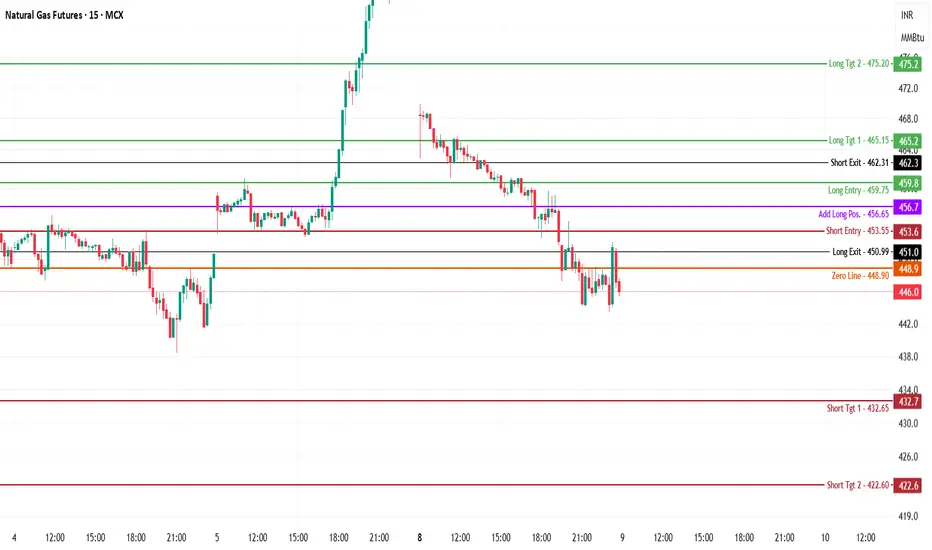
Natural Gas MCX Futures — Chart Pathik Intraday Levels for 09-Dec-2025
(If these levels add value to your trades, a quick boost or comment goes a long way in supporting this free content and keeping our trading community thriving!)
Natural Gas Futures are trading near 446, slid
See all ideas
A representation of what an asset is worth today and what the market thinks it will be worth in the future.
Displays a symbol's price movements over previous years to identify recurring trends.