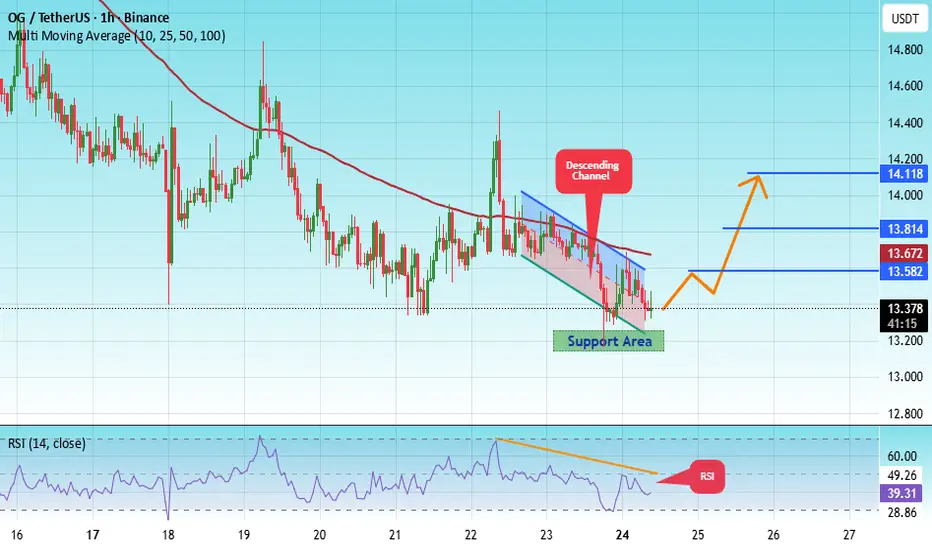
#OG/USDT Analysis. Long Setup#OG
The price is moving within an ascending channel on the 1-hour timeframe and is adhering to it well. It is poised to break out strongly and retest the channel.
We have a downtrend line on the RSI indicator that is about to break and retest, which supports the upward move.
There is a key suppor
Related pairs
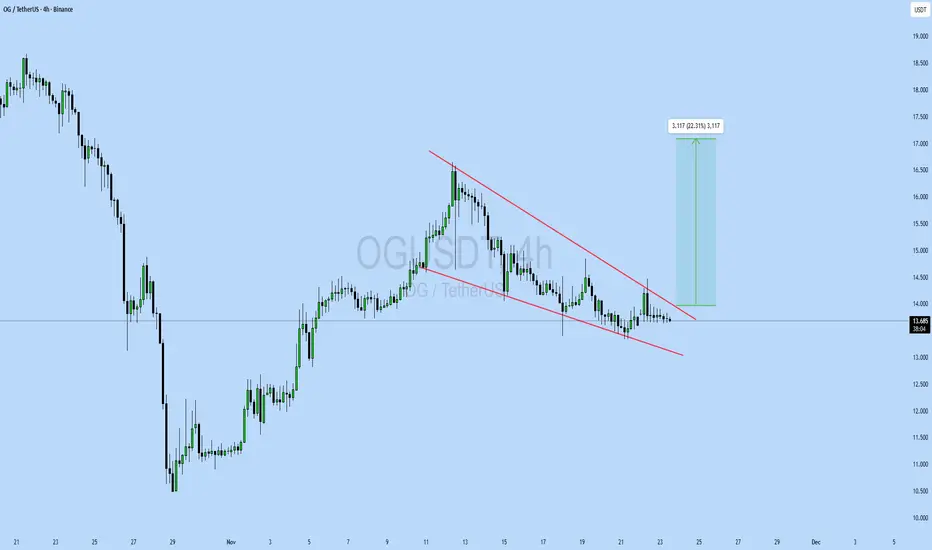
OGUSDT UPDATE#OG
UPDATE
OG Technical Setup
Pattern: Falling Wedge Pattern
Current Price: $13.67
Target Price: $16.78
Target % Gain: 22.31%
Technical Analysis: OG is breaking out of a falling wedge pattern on the 4H chart, showing early bullish momentum. The price has moved above the resistance trendline wit
OGUSDT 12H#OG is facing the descending resistance and the 12H SMA100. Consider buying here and near the support levels at:
$13.792
$12.833
$12.126
In case of a breakout above both resistances, the potential targets are:
🎯 $17.126
🎯 $18.616
🎯 $20.738
🎯 $23.441
⚠️ Always use a tight stop-loss and apply prope

OG/USDT Analysis. Long Setup
On this asset, we’ve detected a large number of volume anomalies, which suggests strong accumulation by a major player. Additionally, there’s a structural breakout on the chart, and above the current price, we can see a volume gap, creating potential for upward movement.
In the order book, below $

Scalp Long – OG💎 Scalp Long – OG
RSI indicates strong oversold conditions, forming a double-bottom pattern that suggests a potential reversal.
Price is consolidating, while buying volume is gradually increasing, showing signs of a recovery setup.
🎯 Plan:
→ Enter after confirmation of bullish breakout from the ac

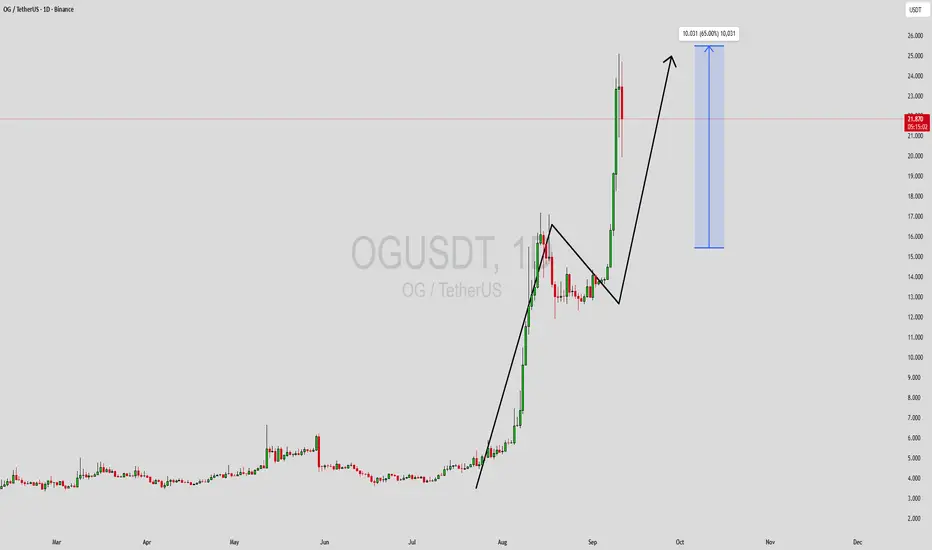
OG road map OG is trading near the upper boundary of the parallel channel formation on the weekly timeframe.The price action indicates potential for an upward breakout as momentum builds
If the resistance level breaks, we could witness a strong surge toward $70

OGUSDT Forming Bullish ContinuationOGUSDT is currently displaying a strong bullish continuation setup, as seen in the recent price breakout and consolidation phase. After a massive rally, the pair entered a brief period of correction, which acted as a healthy retest before momentum returned to the upside. With strong buyer interest a
OGUSDT Forming Bullish ContinuationOGUSDT is currently displaying a strong bullish continuation setup, as seen in the recent price breakout and consolidation phase. After a massive rally, the pair entered a brief period of correction, which acted as a healthy retest before momentum returned to the upside. With strong buyer interest a
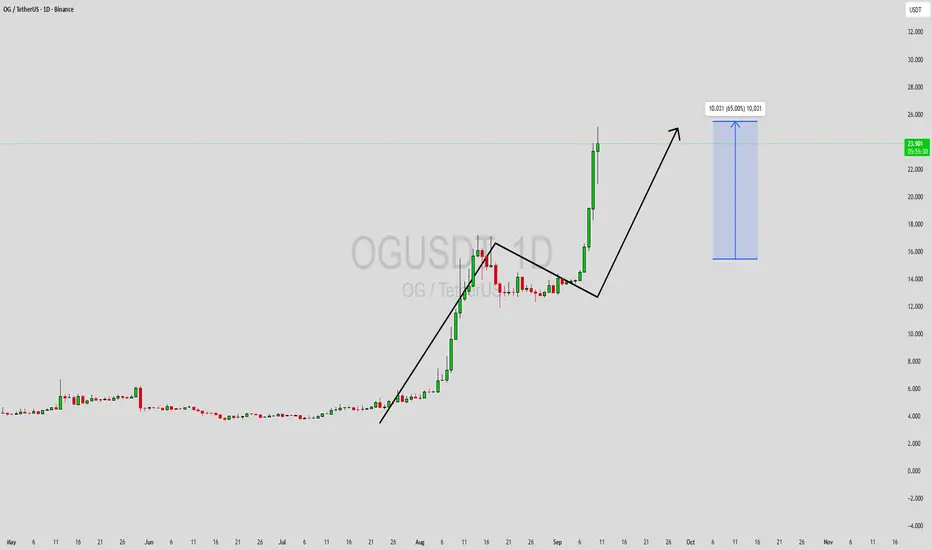
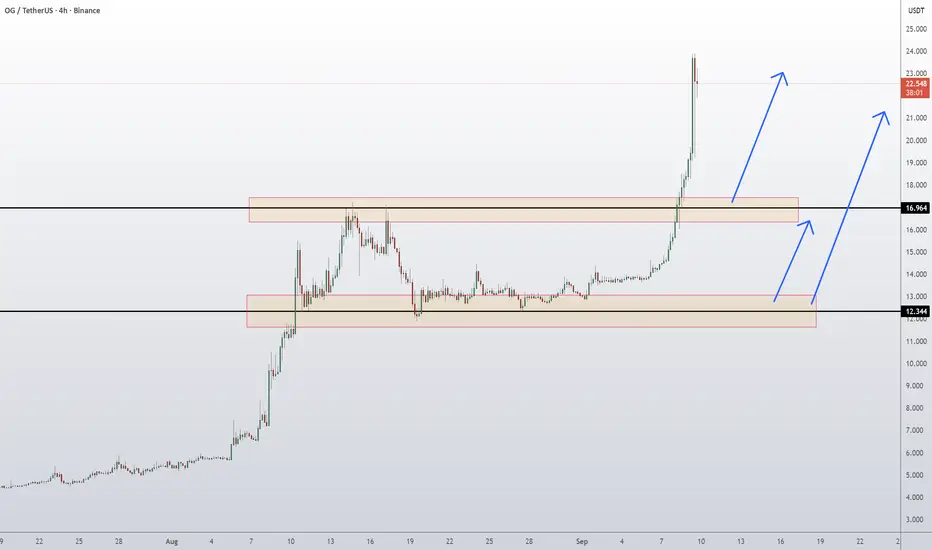
OG Fan Token Coin Price Prediction and Technical AnalysisOG/USDT has exploded higher with a parabolic move, surging from the consolidation range and breaking past the 16.964 resistance with strength. Price is now trading near 22.7, showing signs of possible short-term exhaustion after the steep rally. If buyers manage to hold above 16.964, continuation to
OG more than 4 years of accumulation!OG / USDT
Price is playing in long term accumulation between 2$ as support and 14$/16$ as resistance
Every time price hit resistance zone it rejected hard but once again we see another try to breakout with big volume
Breakout here and we will see fireworks
Keep an eye on it

See all ideas
Summarizing what the indicators are suggesting.
Oscillators
Neutral
SellBuy
Strong sellStrong buy
Strong sellSellNeutralBuyStrong buy
Oscillators
Neutral
SellBuy
Strong sellStrong buy
Strong sellSellNeutralBuyStrong buy
Summary
Neutral
SellBuy
Strong sellStrong buy
Strong sellSellNeutralBuyStrong buy
Summary
Neutral
SellBuy
Strong sellStrong buy
Strong sellSellNeutralBuyStrong buy
Summary
Neutral
SellBuy
Strong sellStrong buy
Strong sellSellNeutralBuyStrong buy
Moving Averages
Neutral
SellBuy
Strong sellStrong buy
Strong sellSellNeutralBuyStrong buy
Moving Averages
Neutral
SellBuy
Strong sellStrong buy
Strong sellSellNeutralBuyStrong buy
Displays a symbol's price movements over previous years to identify recurring trends.
Frequently Asked Questions
The current price of OG Fan Token / Tether USD (OG) is 15.816 USDT — it hasn't changed in the past 24 hours. Try placing this info into the context by checking out what coins are also gaining and losing at the moment and seeing OG price chart.
OG Fan Token / Tether USD price hasn't changed in a week, its month performance shows a 48.38% increase, and as for the last year, OG Fan Token / Tether USD has increased by 118.15%. See more dynamics on OG price chart.
Keep track of coins' changes with our Crypto Coins Heatmap.
Keep track of coins' changes with our Crypto Coins Heatmap.
OG Fan Token / Tether USD (OG) reached its highest price on Mar 16, 2023 — it amounted to 9,000.000 USDT. Find more insights on the OG price chart.
See the list of crypto gainers and choose what best fits your strategy.
See the list of crypto gainers and choose what best fits your strategy.
OG Fan Token / Tether USD (OG) reached the lowest price of 0.960 USDT on Mar 16, 2023. View more OG Fan Token / Tether USD dynamics on the price chart.
See the list of crypto losers to find unexpected opportunities.
See the list of crypto losers to find unexpected opportunities.
The safest choice when buying OG is to go to a well-known crypto exchange. Some of the popular names are Binance, Coinbase, Kraken. But you'll have to find a reliable broker and create an account first. You can trade OG right from TradingView charts — just choose a broker and connect to your account.
Crypto markets are famous for their volatility, so one should study all the available stats before adding crypto assets to their portfolio. Very often it's technical analysis that comes in handy. We prepared technical ratings for OG Fan Token / Tether USD (OG): today its technical analysis shows the buy signal, and according to the 1 week rating OG shows the buy signal. And you'd better dig deeper and study 1 month rating too — it's buy. Find inspiration in OG Fan Token / Tether USD trading ideas and keep track of what's moving crypto markets with our crypto news feed.
You can discuss OG Fan Token / Tether USD (OG) with other users in our public chats, Minds or in the comments to Ideas.