#OG/USDT Analysis. Long Setup#OG
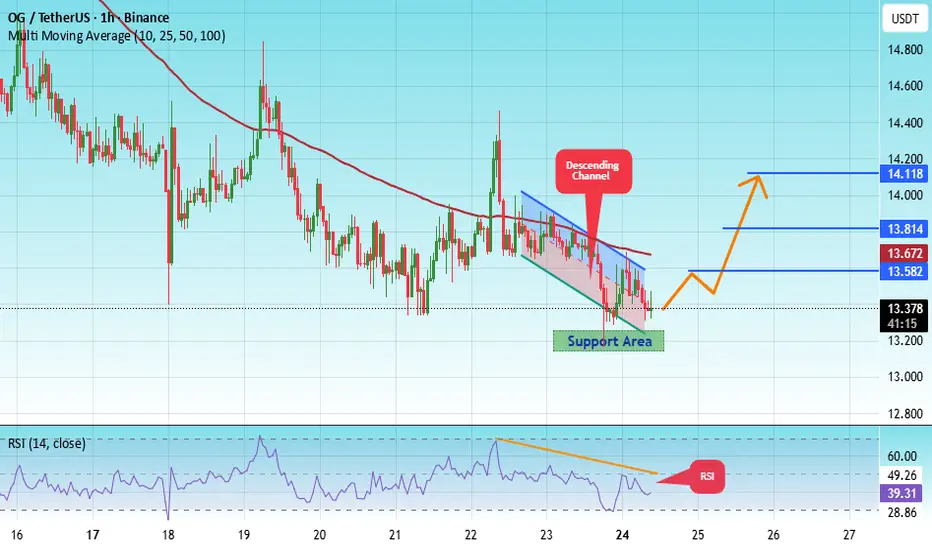
The price is moving within an ascending channel on the 1-hour timeframe and is adhering to it well. It is poised to break out strongly and retest the channel.
We have a downtrend line on the RSI indicator that is about to break and retest, which supports the upward move.
There is a key support zone in green at 13.20, representing a strong support point.
We have a trend of consolidation above the 100-period moving average.
Entry price: 13.38
First target: 13.58
Second target: 13.80
Third target: 14.10
Don't forget a simple money management rule:
Place your stop-loss order below the support zone in green.
Once the first target is reached, save some money and then change your stop-loss order to an entry order.
For any questions, please leave a comment.
Thank you.
Trade ideas
OGUSDT UPDATE#OG
UPDATE
OG Technical Setup
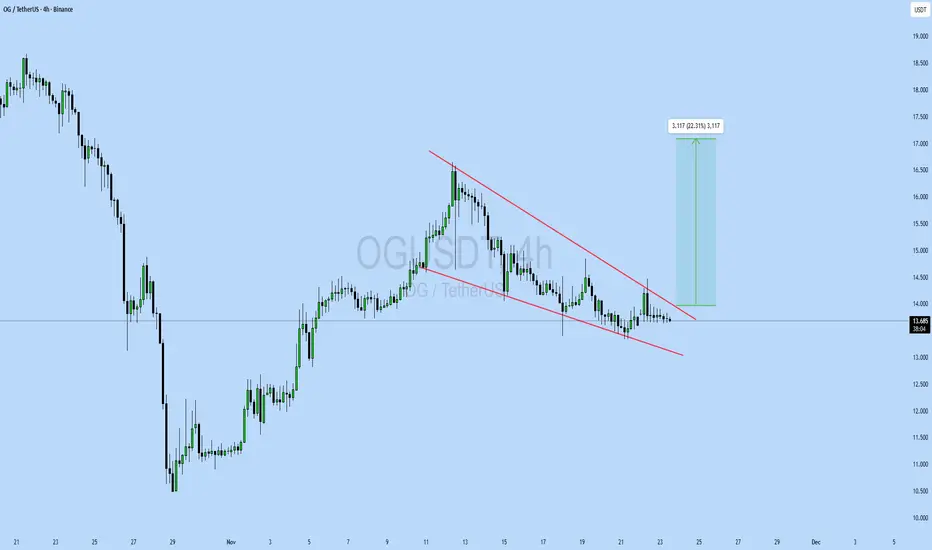
Pattern: Falling Wedge Pattern
Current Price: $13.67
Target Price: $16.78
Target % Gain: 22.31%
Technical Analysis: OG is breaking out of a falling wedge pattern on the 4H chart, showing early bullish momentum. The price has moved above the resistance trendline with steady candles forming near the breakout zone. The structure suggests a continuation toward the measured move target as long as the breakout holds and buyers maintain control.
Time Frame: 4H
Risk Management Tip: Always use proper risk management.
OGUSDT 12H#OG is facing the descending resistance and the 12H SMA100. Consider buying here and near the support levels at:
$13.792
$12.833
$12.126
In case of a breakout above both resistances, the potential targets are:
🎯 $17.126
🎯 $18.616
🎯 $20.738
🎯 $23.441
⚠️ Always use a tight stop-loss and apply proper risk management.

OG/USDT Analysis. Long Setup
On this asset, we’ve detected a large number of volume anomalies, which suggests strong accumulation by a major player. Additionally, there’s a structural breakout on the chart, and above the current price, we can see a volume gap, creating potential for upward movement.
In the order book, below $10.8, there are limit buy orders totaling around $1.7 million, which is a significant volume for this coin.
We’re considering a long position from current levels or after a false breakout of $10.5, where the first signs of abnormal activity appeared.
Growth target: $12.7.
This publication is not financial advice.

Scalp Long – OG💎 Scalp Long – OG
RSI indicates strong oversold conditions, forming a double-bottom pattern that suggests a potential reversal.
Price is consolidating, while buying volume is gradually increasing, showing signs of a recovery setup.
🎯 Plan:
→ Enter after confirmation of bullish breakout from the accumulation zone.
→ TP: 13.63 | SL: 10.38 | RR: 1 : 5.98
Market structure favors a rebound.
Keep positions lean, trail SL as price gains momentum.
Stay patient — only enter once the setup confirms clearly.

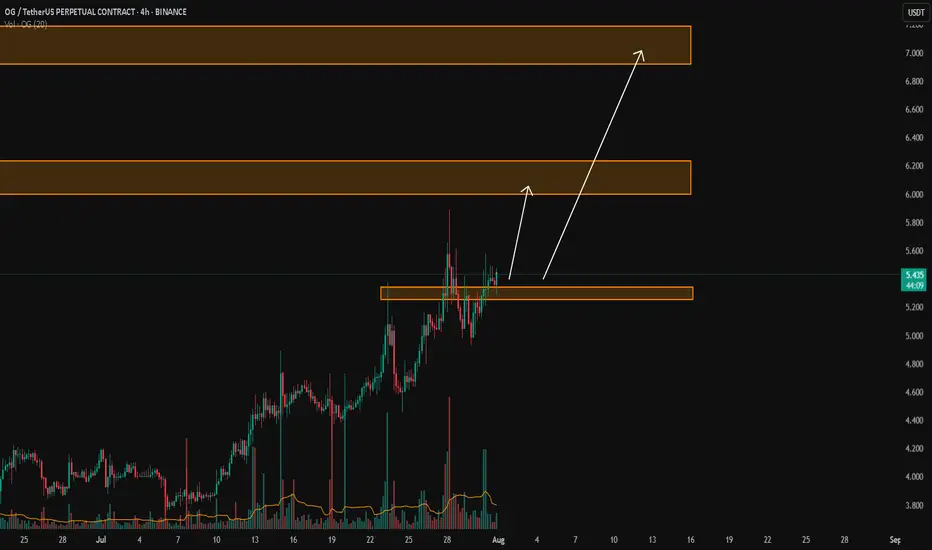
OG road map OG is trading near the upper boundary of the parallel channel formation on the weekly timeframe.The price action indicates potential for an upward breakout as momentum builds
If the resistance level breaks, we could witness a strong surge toward $70

OGUSDT Forming Bullish ContinuationOGUSDT is currently displaying a strong bullish continuation setup, as seen in the recent price breakout and consolidation phase. After a massive rally, the pair entered a brief period of correction, which acted as a healthy retest before momentum returned to the upside. With strong buyer interest and a clear uptrend, the structure is pointing toward further gains, aligning with the 40% to 50%+ profit expectation.
Volume analysis supports this move, as trading activity has remained consistently strong throughout the rally. Sustained volume during bullish retracements is often a sign of smart accumulation, indicating that investors are positioning themselves for the next leg higher. The momentum breakout has confirmed renewed strength, signaling that OGUSDT is ready to push toward new resistance levels.
Investor confidence in OGUSDT continues to grow as the project gains attention in the market. The current setup provides traders with a favorable risk-to-reward ratio, especially given the clear breakout structure and potential upside targets. If momentum continues, we may see OGUSDT extend its bullish trend in the coming sessions.
✅ Show your support by hitting the like button and
✅ Leaving a comment below! (What is You opinion about this Coin)
Your feedback and engagement keep me inspired to share more insightful market analysis with you!
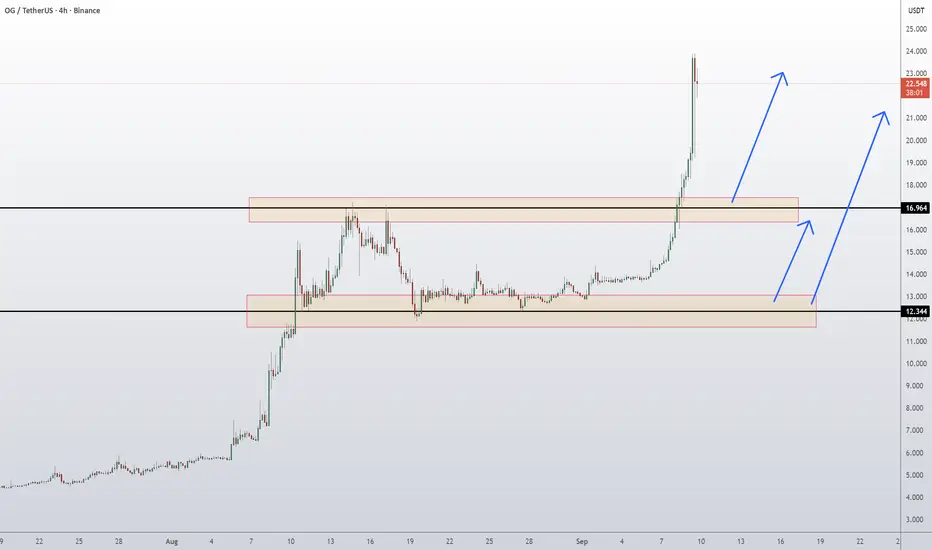
OG Fan Token Coin Price Prediction and Technical AnalysisOG/USDT has exploded higher with a parabolic move, surging from the consolidation range and breaking past the 16.964 resistance with strength. Price is now trading near 22.7, showing signs of possible short-term exhaustion after the steep rally. If buyers manage to hold above 16.964, continuation toward higher levels remains likely. However, if momentum cools, a retest of 16.964 or even the deeper 12.344 demand zone could occur before another bullish leg.
📈 Key Levels:
Buy trigger: Retest/hold above 16.964 support
Buy zone: 16.96 – 17.20 region (secondary at 12.34 if deeper pullback)
Target: 22.70+ continuation zone
Invalidation: Daily close below 12.344 (would signal weakening bullish momentum)
👉 Follow me for More Real Time Opportunities.
Share your Thoughts if you have any?
OG more than 4 years of accumulation!OG / USDT
Price is playing in long term accumulation between 2$ as support and 14$/16$ as resistance
Every time price hit resistance zone it rejected hard but once again we see another try to breakout with big volume
Breakout here and we will see fireworks
Keep an eye on it

Unleash the Power of $OG A Winning Trading Strategy Revealed!BINANCE:OGUSDT
Unleash the Power of SEED_ALEXDRAYM_SHORTINTEREST2:OG A Winning Trading Strategy Revealed!
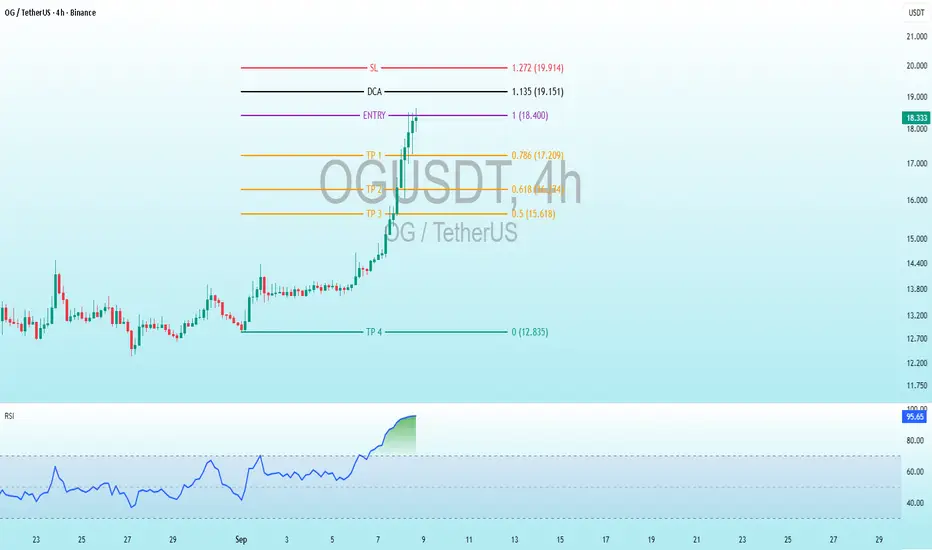
Entry Level: The suggested entry point is at 18.400 - 18.300 USDT.
Take Profit Levels (TP):
TP1: 0.786 (17.209 USDT)
TP2: 0.618 (16.274 USDT)
TP3: 0.5 (15.618 USDT)
TP4: 0 (12.835 USDT)
Stop Loss (SL): Set at 1.272 (19.914 USDT).
DCA (Dollar Cost Averaging): Additional entry at 1.135 (19.151 USDT) if the price moves against the initial entry.
Trend and Movement:
The chart shows a recent upward movement, with the price breaking above the entry level of 18.400 - 18.300 USDT.
The candlestick pattern suggests a potential continuation upward toward the TP1 level (17.209 USDT) in the short term.
RSI (Relative Strength Index):
The RSI is currently at 95.66, indicating that the asset is in the overbought territory (above 70). This suggests a potential for a pullback or consolidation soon unless the upward momentum continues strongly.
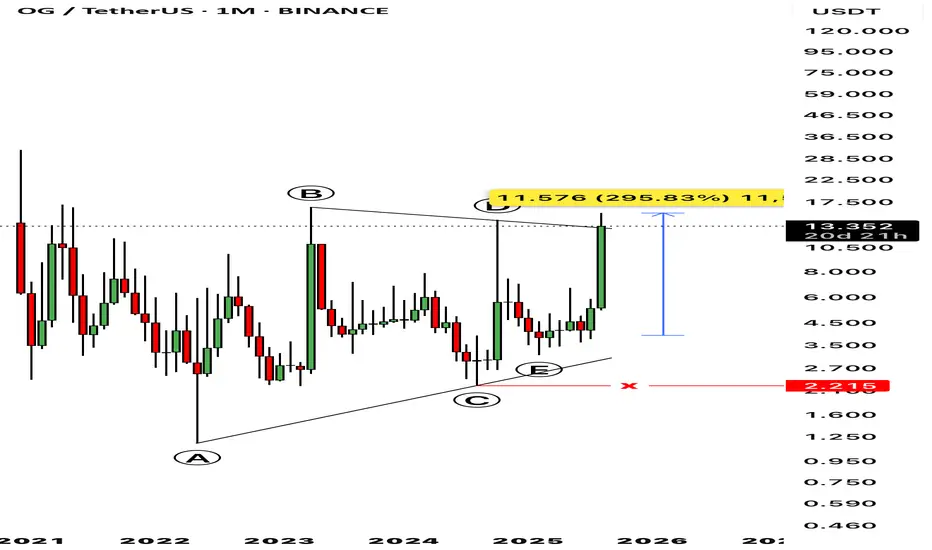
OG fan token 📌 going deliver 50x OG binance fan token analysis 📍
Pls 🙏 dyor & #nfa
Long term analysis 📌 according to wave theory 📍
Invalid below wave " C "
Accumulation zone 📌 $2.86-4.86
Target :: $18 & $35 later $70 & $100 above
Closing below wave C i keep new analysis
Pls support me ☺️ give boost to post and pls share 🙏
Pls do comment 👍

OG/USDT update for the previous analysis Eventually OGUSDT chart has successfully moved uptrend strongly exactly as per my previous analysis (6 months earlier), the result is awesome, almost like 3X spot profits. To see the previous analysis please visit my profile.
OG Strong Chart Will Yield 888% Profits Within 6 MonthsI had to choose between this one and Milan's fan token. I went with this one because the chart is different. Milan (ACMUSDT) has the same chart as Atlético de Madrid (ATMUSDT). So you know what to look for there and you can also know now that ACMUSDT too is also bullish and coming out of major market bottom and low.
OG's chart is much more different though, the bottom was hit in May 2022 with a long-term higher low in August 2024 and another higher low on the 3rd of February 2025. This is a strong pair based on TA and guess what? It is ready now for a new wave of growth.
"Higher lows lead to higher highs," is a saying that I like to repeat over and over because it sounds nice. It doesn't necessarily have to be true but it will be true this time.
Most of the Altcoins produced a lower low in April compared to February or March, the fact that OGUSDT produced a higher low in April is a signal strength. This is enough to support a bullish wave.
The four weeks of bullish consolidation (prices moving slowly higher and the sessions closing green) supports the higher low signal.
Low volume in this instance —context is always needed for a signal to be interpreted correctly—means that the real action is yet to start. Not that the "growth is weak" but rather that there is no growth yet. So this is a positive signal. The fact that the market isn't dropping and is slowly growing and consolidating will lead to a strong bullish jump.
Ok. The technical analysis and signals are in place.
Now that we are done with the technological jargon we can move to the part we like most, take profits targets (TP for short).
Spoiler alert! I use the fibonacci tool to extract my targets against all other methods because this has been proven the most accurate over the years. Period.
» The purple target at ~$43 can yield 888% profits.
» The red target at $32 can yield 634% profits.
» The blue target at $21 can give an easy 380% profits if you were to buy at the current price and sell when this target hits.
Will these target hit or will they miss?
Just wait and see.
I can assure you that the market will turn green. That's all that matters to me.
It matters to me to give you a great entry price and great timing.
You are the one that should focus on securing your profits, it is a win-win-win.
Abundance, love, wealth, health and peace.
Thanks for being with me.
When I am gone, you will miss me.
Namaste.

$OG Bearish DivergenceBINANCE:OGUSDT
Trade Setup:
Target 1: 12.422 (0.786 Fibonnaci Golden Zone).
Target 2: 10.976 (0.618 Fibonnaci Golden Zone).
Target 3: 9.959 (0.5 Fibonnaci Golden Zone).
Target 4: 5.654 (0 Fibonnaci).
DCA : 15.427 (1.135 Fibonacci)
Stop Loss: 16.607 (1.272 Fibonacci).
RSI Analysis: The RSI is showing a bearish divergence, suggesting potential bearish momentum. The current RSI is around 87.49, approaching oversold territory, so caution is advised.

OG Bearish DivergenceBINANCE:OGUSDT
Trade Setup:
Target 1: 6.714(0.786 Fibonnaci Golden Zone).
Target 2: 6.051 (0.618 Fibonnaci Golden Zone).
Target 3: 5.584 (0.5 Fibonnaci Golden Zone).
Target 4: 3.609 (0 Fibonnaci).
DCA : 8.093 (1.135 Fibonacci)
Stop Loss: 8.635 (1.272 Fibonacci).
RSI Analysis: The RSI is showing a bearish divergence, suggesting potential bearish momentum. The current RSI is around 84.67, approaching oversold territory, so caution is advised.

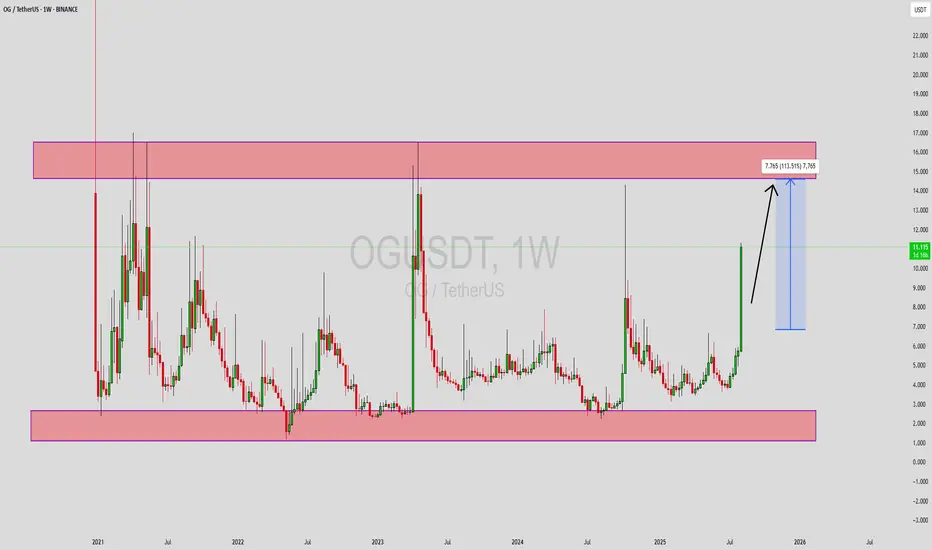
OGUSDT Forming Bullish MomentumOGUSDT is staging a compelling breakout from a multi-year range, with price now pushing sharply higher and well above a key resistance zone. The weekly chart reveals a large rectangular range defined by significant long-term support below and supply above, and OG has decisively broken the upper band with strong volume and bullish candlestick confirmation.
Technical indicators align with this expansion: OG has risen rapidly—approaching a potential 112% upside to the next major resistance area. This move is reinforced by recent breakout patterns including a falling wedge and a broadening rising wedge, signaling a transition from accumulation to a strong bullish trend. Furthermore, market volume remains elevated, validating buyer conviction on the breakout
Adding to technical strength, institutional and retail attention has surged. Notable is the launch of the OGUSDT-margined perpetual futures contract on KuCoin, offering up to 30x leverage and likely increasing speculation and liquidity in the token. Bullish engulfing patterns and momentum indicators (RSI, MACD, etc.) in higher timeframes further attest to strong upside bias
OGUSDT has emerged from a prolonged multi-year consolidation and is now rallying with conviction. The sharp breakout above resistance, underpinned by high volume, breakout structures, and fresh derivative infrastructure, sets the stage for a strong mid-term move. The target zone near $16–17 USDT represents a potential 110%+ upside if momentum sustains.
Traders should monitor retests of the breakout level for entry opportunities—proof of support here could validate continuation toward the target range.
✅ Show your support by hitting the like button and
✅ Leaving a comment below! (What is your opinion about this Coin)
Your feedback and engagement keep me inspired to share more insightful market analysis with you!
OG/USDTKey Level Zone: 5.250 - 5.340
LMT v2.0 detected.
The setup looks promising—price previously trended upward with rising volume and momentum, then retested this zone cleanly. This presents an excellent reward-to-risk opportunity if momentum continues to align.
Introducing LMT (Levels & Momentum Trading)
- Over the past 3 years, I’ve refined my approach to focus more sharply on the single most important element in any trade: the KEY LEVEL.
- While HMT (High Momentum Trading) served me well—combining trend, momentum, volume, and structure across multiple timeframes—I realized that consistently identifying and respecting these critical price zones is what truly separates good trades from great ones.
- That insight led to the evolution of HMT into LMT – Levels & Momentum Trading.
Why the Change? (From HMT to LMT)
Switching from High Momentum Trading (HMT) to Levels & Momentum Trading (LMT) improves precision, risk control, and confidence by:
- Clearer Entries & Stops: Defined key levels make it easier to plan entries, stop-losses, and position sizing—no more guesswork.
- Better Signal Quality: Momentum is now always checked against a support or resistance zone—if it aligns, it's a stronger setup.
- Improved Reward-to-Risk: All trades are anchored to key levels, making it easier to calculate and manage risk effectively.
- Stronger Confidence: With clear invalidation points beyond key levels, it's easier to trust the plan and stay disciplined—even in tough markets.
Whenever I share a signal, it’s because:
- A high‐probability key level has been identified on a higher timeframe.
- Lower‐timeframe momentum, market structure and volume suggest continuation or reversal is imminent.
- The reward‐to‐risk (based on that key level) meets my criteria for a disciplined entry.
***Please note that conducting a comprehensive analysis on a single timeframe chart can be quite challenging and sometimes confusing. I appreciate your understanding of the effort involved.
Important Note: The Role of Key Levels
- Holding a key level zone: If price respects the key level zone, momentum often carries the trend in the expected direction. That’s when we look to enter, with stop-loss placed just beyond the zone with some buffer.
- Breaking a key level zone: A definitive break signals a potential stop‐out for trend traders. For reversal traders, it’s a cue to consider switching direction—price often retests broken zones as new support or resistance.
My Trading Rules (Unchanged)
Risk Management
- Maximum risk per trade: 2.5%
- Leverage: 5x
Exit Strategy / Profit Taking
- Sell at least 70% on the 3rd wave up (LTF Wave 5).
- Typically sell 50% during a high‐volume spike.
- Move stop‐loss to breakeven once the trade achieves a 1.5:1 R:R.
- Exit at breakeven if momentum fades or divergence appears.
The market is highly dynamic and constantly changing. LMT signals and target profit (TP) levels are based on the current price and movement, but market conditions can shift instantly, so it is crucial to remain adaptable and follow the market's movement.
If you find this signal/analysis meaningful, kindly like and share it.
Thank you for your support~
Sharing this with love!
From HMT to LMT: A Brief Version History
HM Signal :
Date: 17/08/2023
- Early concept identifying high momentum pullbacks within strong uptrends
- Triggered after a prior wave up with rising volume and momentum
- Focused on healthy retracements into support for optimal reward-to-risk setups
HMT v1.0:
Date: 18/10/2024
- Initial release of the High Momentum Trading framework
- Combined multi-timeframe trend, volume, and momentum analysis.
- Focused on identifying strong trending moves high momentum
HMT v2.0:
Date: 17/12/2024
- Major update to the Momentum indicator
- Reduced false signals from inaccurate momentum detection
- New screener with improved accuracy and fewer signals
HMT v3.0:
Date: 23/12/2024
- Added liquidity factor to enhance trend continuation
- Improved potential for momentum-based plays
- Increased winning probability by reducing entries during peaks
HMT v3.1:
Date: 31/12/2024
- Enhanced entry confirmation for improved reward-to-risk ratios
HMT v4.0:
Date: 05/01/2025
- Incorporated buying and selling pressure in lower timeframes to enhance the probability of trending moves while optimizing entry timing and scaling
HMT v4.1:
Date: 06/01/2025
- Enhanced take-profit (TP) target by incorporating market structure analysis
HMT v5 :
Date: 23/01/2025
- Refined wave analysis for trending conditions
- Incorporated lower timeframe (LTF) momentum to strengthen trend reliability
- Re-aligned and re-balanced entry conditions for improved accuracy
HMT v6 :
Date : 15/02/2025
- Integrated strong accumulation activity into in-depth wave analysis
HMT v7 :
Date : 20/03/2025
- Refined wave analysis along with accumulation and market sentiment
HMT v8 :
Date : 16/04/2025
- Fully restructured strategy logic
HMT v8.1 :
Date : 18/04/2025
- Refined Take Profit (TP) logic to be more conservative for improved win consistency
LMT v1.0 :
Date : 06/06/2025
- Rebranded to emphasize key levels + momentum as the core framework
LMT v2.0
Date: 11/06/2025
- Fully restructured lower timeframe (LTF) momentum logic
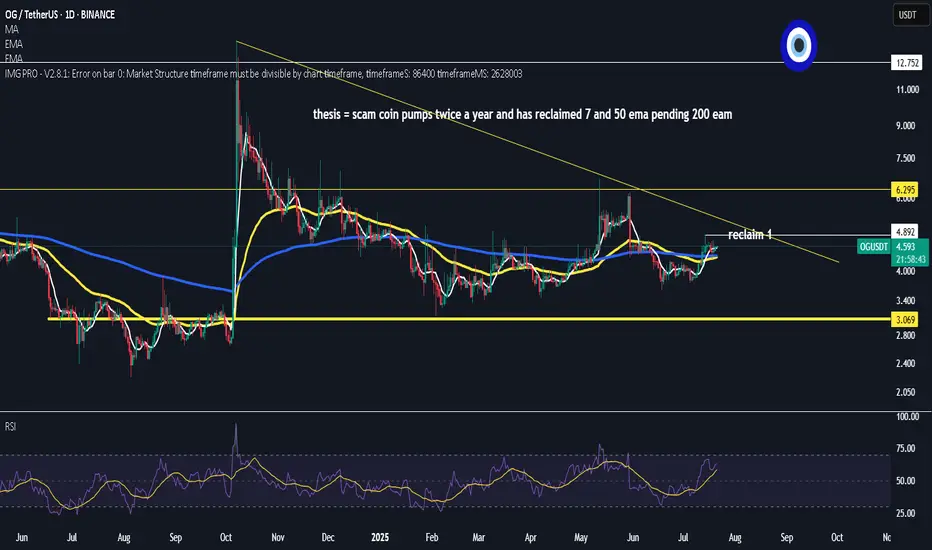
$OG fan token
scam coin as they all are till we progress as an industry and adoption picks up
for now low cap rotation play
above all ema's
50 ema 1-2 days to cross 200
golden cross
BTFD mode
using low leverage
risking $1 to make $10-$12
rsi looking nice.. dominance has some way to go down
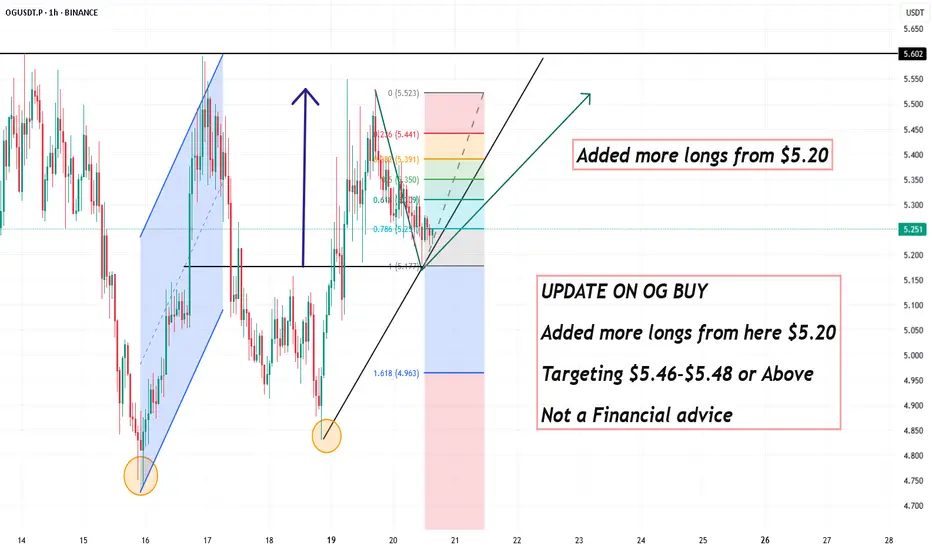
UPDATE ON OG BUY ,More Longs from $5.20UPDATE ON OG BUY
Added more longs from here $5.20
Targeting $5.46-$5.48 or Above
Its Not a Financial advice
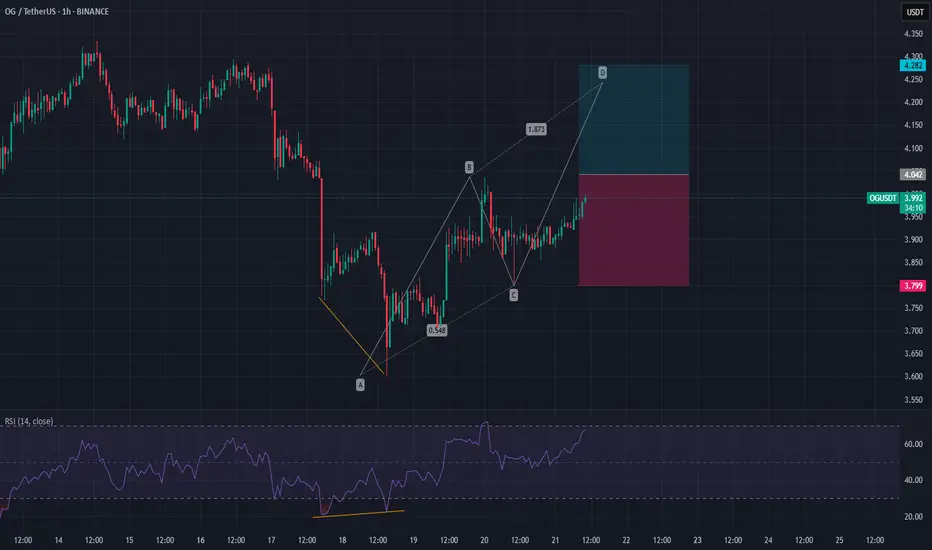
OG PERPETUAL TRADE ,Bought From $5.34OG PERPETUAL TRADE
OG BUY SETUP
Currently $5.34
Bought From $5.34
(Trading plan If OG go down to $5.15
will add more longs)
Expecting target $5.48 OR ABOVE
Incase of early exist will update this anaylsis
Its not a Financial advice

OG ANALYSIS📊 #OG Analysis
✅There is a formation of Descending Channel Pattern in daily time frame in #OG .
Also there is a perfect breakout and retest. Now we can expect a bullish move. If the price successful retest the major support zone then we will see more bullish move
👀Current Price: $5.226
🎯 Target Price : $6.152
⚡️What to do ?
👀Keep an eye on #OG price action and volume. We can trade according to the chart and make some profits⚡️⚡️
#OG #Cryptocurrency #Breakout #TechnicalAnalysis #DYOR
