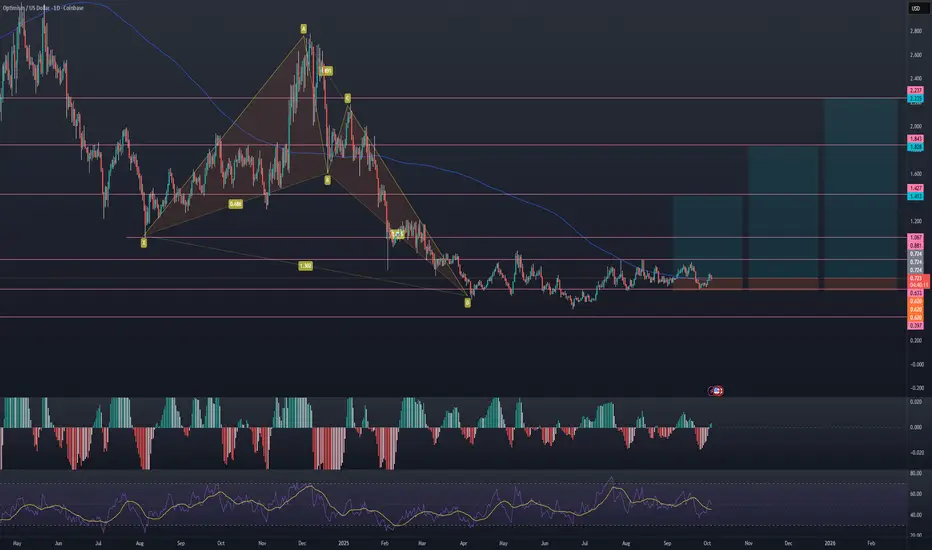
$OPUSD looks good for a long hereSince 2024, OP has been falling inside of a wedge, and it recently broke out and has now backtested it. We've also formed a capitulation low on Oct 6th, and now we look set to make a move higher.
I think we could see between a 2x-10x move from here potentially all the way up to the top of the range
Trading activity
Transactions 1.21 K
BuysSells
651562
Volume 135.03 KUSD
Buys volumeSells volume
66.29 K68.74 K
Traders 209
BuyersSellers
107102
About OPUSDC_B533C1.USD
Related DEX pairs

OP Seller Exhaustion Long IdeaOPUSD has an imperfect potential Bullish Crab Harmonic pattern down here in the dumpster at the June 2022 lows there on the left. The RSI is showing some classic bullish divergence. It seems like there could be at least some kind of exhaustion rally soon even if it just manifests into another lower

OPUSD Long IdeaOP is still at/near the pattern completion zone of the potential Bullish Butterfly Harmonic Pattern. It's not perfect, but there is definitely an "M-shape" there and sellers are failing to push the price below .63 cents now for multiple months, which is a key level that goes all the way back to 2022
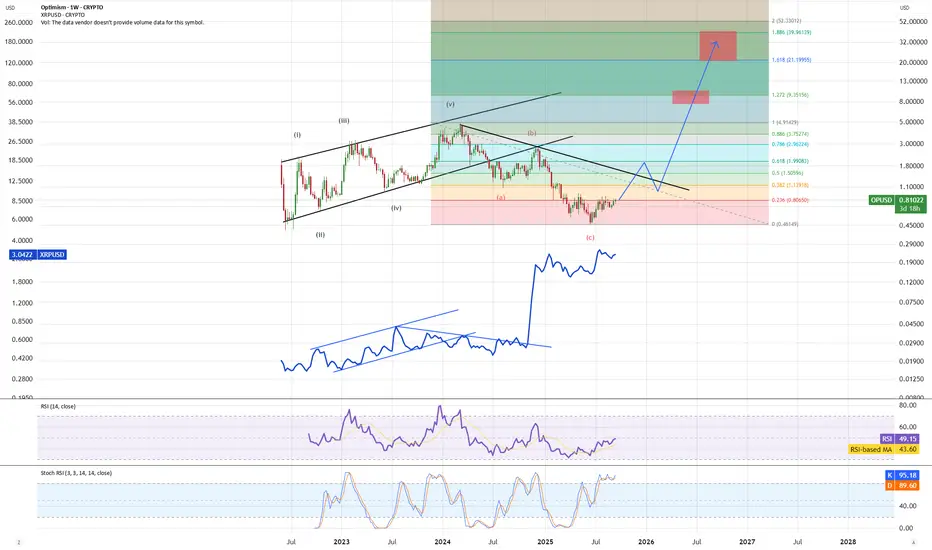
OP - time to push higherOP had a deeper correction as expected. Looking at pattern we have algo similar to XRP where we had a final correction and are now bouncing up. In order to continue following XRP algo we need to push higher, to break local diagonal resistance line, consolidate a bit and then blast to new ATH.
Optimism is PhysicsConservation of Energy and Conservation of Momentum.
Time to dig up those physics laws. We could have a flip in momentum from red to green. Will be massive.
Technically that can happen, and fundamentally Optimism is like a train system for the ETH mainnet. Once gas becomes too heavy, this thing w

Optimism will be a grand slamMany alts run up up when btc goes up and likewise they fall when btc falls.
Except optimism. It is off-phase, similar to xrp back in 2016-2017 before the boom.
Lot of alts have no adx against their btc pair. Optimism has what it takes, and I bet you the algos will pick this one up.
Fundamentall

OP 4H – Bounce From Golden Pocket, But Will It Hold Above $0.65?Optimism is bouncing directly from the 0.618 Fibonacci retracement ($0.620), showing respect to the golden pocket region — but with Stoch RSI flipping into overbought, this bounce could be tested quickly.
📊 Fibonacci Zones:
– 0.5 = $0.668
– 0.618 = $0.620 (current reaction)
– 0.786 = $0.551 (last l

OP: Once in a Life-Time Chance?#Optimism may have completed its correction, showing a rare opportunity.
If the current low holds, it would mark the major bottom, completing a diagonal 1st wave followed by a WXY correction.
Passing $2.78 confirms targeting the ATH.
Breaking $0.39 invalidates the idea.

Optimism: The Optimistic ViewNASDAQ:OP
The all-time chart of #OP suggests a completed major diagonal first wave, followed by a double combo correction.
The recent bottom is either the final low or a last drop is needed to end the correction since March 2024.
Passing $2.78 confirms the correction’s end and signals a new all-ti

Optimism💰 Optimism
Timeframe: D
The scenario is almost complete, but we may see one more downward impulse. The most likely target for the decline is 0.60.
#OP

See all ideas
Summarizing what the indicators are suggesting.
Oscillators
Neutral
SellBuy
Strong sellStrong buy
Strong sellSellNeutralBuyStrong buy
Oscillators
Neutral
SellBuy
Strong sellStrong buy
Strong sellSellNeutralBuyStrong buy
Summary
Neutral
SellBuy
Strong sellStrong buy
Strong sellSellNeutralBuyStrong buy
Summary
Neutral
SellBuy
Strong sellStrong buy
Strong sellSellNeutralBuyStrong buy
Summary
Neutral
SellBuy
Strong sellStrong buy
Strong sellSellNeutralBuyStrong buy
Moving Averages
Neutral
SellBuy
Strong sellStrong buy
Strong sellSellNeutralBuyStrong buy
Moving Averages
Neutral
SellBuy
Strong sellStrong buy
Strong sellSellNeutralBuyStrong buy