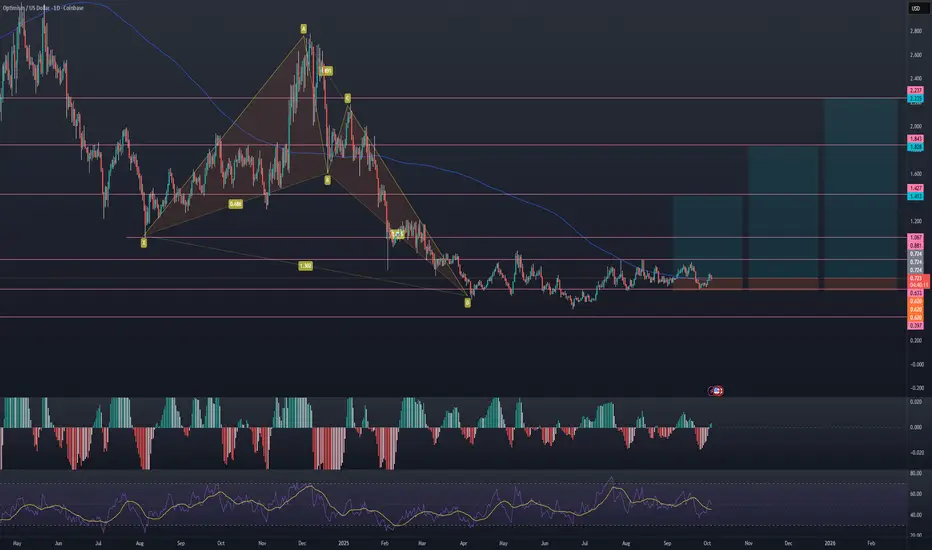
$OPUSD looks good for a long hereSince 2024, OP has been falling inside of a wedge, and it recently broke out and has now backtested it. We've also formed a capitulation low on Oct 6th, and now we look set to make a move higher.
I think we could see between a 2x-10x move from here potentially all the way up to the top of the range.
Let's see how it plays out over the comings weeks.
Market insights

OP Seller Exhaustion Long IdeaOPUSD has an imperfect potential Bullish Crab Harmonic pattern down here in the dumpster at the June 2022 lows there on the left. The RSI is showing some classic bullish divergence. It seems like there could be at least some kind of exhaustion rally soon even if it just manifests into another lower high. Performance on these alt coins has been abysmal, but maybe some bids can come in. Let's see what happens.

OPUSD Long IdeaOP is still at/near the pattern completion zone of the potential Bullish Butterfly Harmonic Pattern. It's not perfect, but there is definitely an "M-shape" there and sellers are failing to push the price below .63 cents now for multiple months, which is a key level that goes all the way back to 2022. However, market participants are unable to create any local higher highs, which is somewhat concerning. Overall, it is probably more of a neutral likelihood of up vs. down here, but there is a lot of upside if market participants can keep the price above 63 cents long enough. Something to keep an eye on. Let's see what happens. It will be dependent on BTC not dumping here soon.
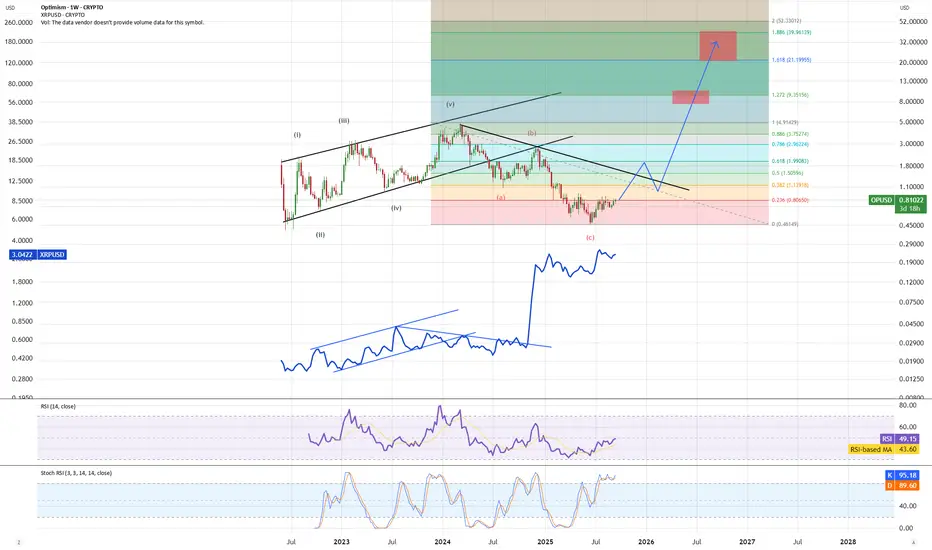
OP - time to push higherOP had a deeper correction as expected. Looking at pattern we have algo similar to XRP where we had a final correction and are now bouncing up. In order to continue following XRP algo we need to push higher, to break local diagonal resistance line, consolidate a bit and then blast to new ATH.
Optimism is PhysicsConservation of Energy and Conservation of Momentum.
Time to dig up those physics laws. We could have a flip in momentum from red to green. Will be massive.
Technically that can happen, and fundamentally Optimism is like a train system for the ETH mainnet. Once gas becomes too heavy, this thing will blast off. Arbitum seems to be rising first, but imo the first move is always the false move. Optimism is where its at.

Optimism will be a grand slamMany alts run up up when btc goes up and likewise they fall when btc falls.
Except optimism. It is off-phase, similar to xrp back in 2016-2017 before the boom.
Lot of alts have no adx against their btc pair. Optimism has what it takes, and I bet you the algos will pick this one up.
Fundamentally, once eth transactions become too expensive and network gets congested, we will have no choice but to use an L2 to club the transactions together for a lower individual gas fee.
Arbitum has weaker adx and the boomerang from would ideally be weaker than that of OP

OP 4H – Bounce From Golden Pocket, But Will It Hold Above $0.65?Optimism is bouncing directly from the 0.618 Fibonacci retracement ($0.620), showing respect to the golden pocket region — but with Stoch RSI flipping into overbought, this bounce could be tested quickly.
📊 Fibonacci Zones:
– 0.5 = $0.668
– 0.618 = $0.620 (current reaction)
– 0.786 = $0.551 (last line of defense)
So far, the reaction is strong — but to confirm continuation, bulls will need to reclaim the $0.66–$0.68 range with volume.
A failure to hold may trigger a deeper move toward $0.55.

OP: Once in a Life-Time Chance?#Optimism may have completed its correction, showing a rare opportunity.
If the current low holds, it would mark the major bottom, completing a diagonal 1st wave followed by a WXY correction.
Passing $2.78 confirms targeting the ATH.
Breaking $0.39 invalidates the idea.

Optimism: The Optimistic ViewNASDAQ:OP
The all-time chart of #OP suggests a completed major diagonal first wave, followed by a double combo correction.
The recent bottom is either the final low or a last drop is needed to end the correction since March 2024.
Passing $2.78 confirms the correction’s end and signals a new all-time high.
Breaking the all-time low at $0.39 invalidates this idea.
#Optimism

Optimism💰 Optimism
Timeframe: D
The scenario is almost complete, but we may see one more downward impulse. The most likely target for the decline is 0.60.
#OP

OP (Y25.P1.E1). More lows to comeHi Traders,
Been on holidays for some time and now looking to come back with many videos and chart reads.
Optimism looks bearish as it loses a key level and now waiting to see if it can regain the weekly levels which I doubt.
Alts are likely to bleed a little more and with #OP, I'm looking for another 5 wave count.
Looking to short, like to see it get above current price and hit the weekly along with the 0.5 fib and find a nice daily rejection candle or even some reversal pattern on the smaller time frames.
Liquidity has been taken out but it might not be enough unless the ETH narrative gets a big boost but in the climate of today, tariffs of the USA have put doubt into the financial markets and so its likely to be very volatile in the coming months which will be good for trading but not for hodling.
All the best,
Regards SSAri.

Optimism/USD AnalysisOptimism/USD Analysis:
The pair has been in a short-term downtrend but is now approaching a strong support level. A bullish reversal is expected if the price respects this support, confirmed by technical signals such as a bullish engulfing candlestick pattern or other momentum indicators.
Key Takeaways:
Support Zone: A critical level to monitor for potential bullish confirmation.
Confirmation Signals: Bullish engulfing candle or shifts in momentum indicators.
Bias: Bullish reversal potential if the support holds.
What are your thoughts on this setup? Let’s discuss!

OP/USD. It's time to RETURN! Technical analysis from 27.01.25Hello everyone, dear friends!
While bitcoin is holding in the phase of uncertainty, I suggest to consider the Op/Usd pair.
The price has been trading in a wedge structure for a long time, having formed a divergence. The spring is compressed for a long time and at the current moment I expect a breakdown on volume of the upper boundary of the triangle. Targets, entry point and stop loss are indicated on the chart.
From the recent:
Ldo from January 19:
Current picture:
Want more and, most importantly, for free, write in private messages, I will give access because here is forbidden advertising of third-party links.
Happy bidding!

OPUSD (1W) - buy the dipHi traders,
Here it is my idea for a long position on OPUSD (1 week time frame).
the price hit a local high in April 2024 and hit another high in November 2024, meanwhile the price hit the SMA that acted as a resistance and the price bounced back and is currently experiencing the pullback. The idea is to enter in the buy area, which is determined by a previous resistance zone that can be a support for a bounce up now. The buy area is between 1.968 and 1.703.
We will put our first take profit at 3.014 where there was an high in April 2024 and the second take profit at 4.526 where there is the higher high.
Good luck!

Weis Wave Vol back in sync with Heikin Ashi - good tidings 2025Coinbase deFi is riding on this protocol - would not surprise me to see OP go up 10x in two years, good HODL lotto ticket. March target, 100% win. Monthly time frame just under Gann High Low line - well, just an idea, do your own diligence. Let us be glad.

Optimism attempting an invh&s breakoutOptimism leading the pack today, no guarantee it will maintain the neckline as support just yet though. I believe the fundamental news about it being one of the new 5 chains BUIDL will be on is contributing to the bullish momentum. This would make since because arbitrum is doing equally well right now also. *not financial advice*

Optimism (OP)Optimism is a layer-two blockchain on top of Ethereum which uses Optimistic Rollups to scale the Ethereum ecosystem. The project is new and there are not enough candles to draw the big picture. But anyway, it seems a triangle pattern with ABCDE waves is forming, so have to wait and see when the current corrective wave end and ride the 5th wave to the top. Let's see what happens.

OP setupGreat setup, 3 targets. Lets go. Nice harmonic, and a 3 rising valleys to boot. Accumulation happening at a key level.

BEST ENTRY IN A LONG TIME!Keeping this VERY SIMPLE. #Optimism is currently trading close to all time lows! after sweeping a few high timeframe weekly lows, and holding above the level, in my opinion, this can be a great entry for higher prices to come.
Calculate Your Risk/Reward so you don't lose more than 1% of your account per trade.
Every day the charts provide new information. You have to adjust or get REKT.
Love it or hate it, hit that thumbs up and share your thoughts below!
This is not financial advice. This is for educational purposes only.

100% Positive uptrend continuation Weekly Bullish, Daily chart bullish, 4 hrs still bullish. We have a long up to go.
But for your safety of price actions, you might need to consider using lower leverages like 4x.
Buying on spot is good choice as well.
🎯Short-Term Target - 4.2$
🎯Mid-Term Target - 7.65$
🎯Long-Term Target - 11.6$
🎯Long-Term Target - 15.5$
🎯Long-Term Target - 19.6$

OP - Massive Buy SignalHere we have an amazing development on the 2W chart for OP. Most people do not watch the 2 week chart which is why this will probably fly under the radar for most, but here we are providing you with the most up-to-date content.
We have a dragonfly doji forming on the 2W after a 112 day downtrend (>3 months) and after a capitulatory event. This absolutely looks like a bottom and with ETF approval on the horizon we could see some explosive price action. Looks like a great time to accumulate.
Also some key take aways on lower timeframe RSIs. The weekly bounced off a 33 (very close to oversold conditions at a 30).
The 3D RSI did bounce from oversold conditions at a 27 which is the exact same level it bounced from on June 12, 2023 before OP went from $1.08 to $4.80.

Optimism in a reload zone. Optimism has come down around 85% from its recent high pushing into major support levels. With the test of their superchain this week and the events in Brussels I can see a turnaround in current trend.

OPTIMISM QUICK SCALPPotential Buy Opportunity
Price breaking up
Take Profits & stop Loss On Chart
Leverage (MT4) and Exchange (Both spot & Leverage)
