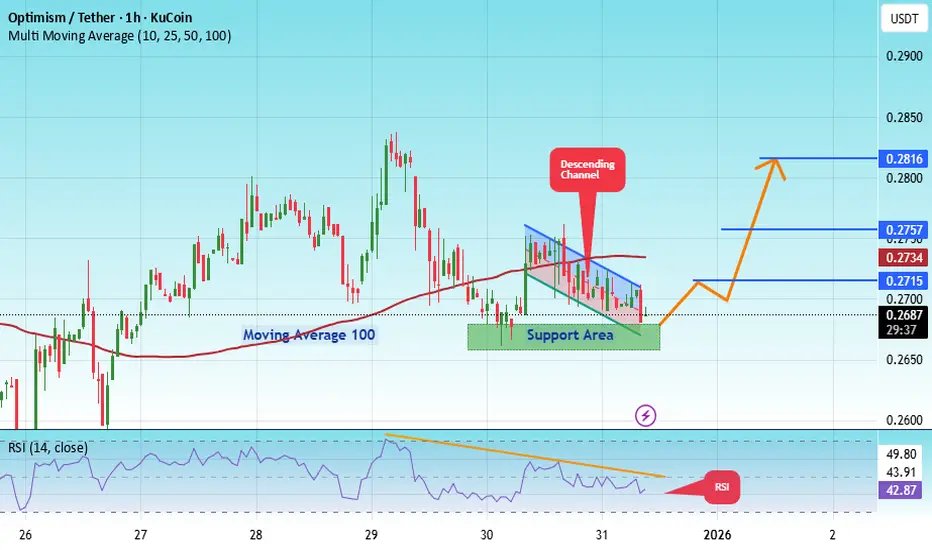
#OP/USDT – Triangle Pattern Breakout Loading?#OP
The price is moving in a descending channel on the 1-hour timeframe. It has reached the lower boundary and is heading towards breaking above it, with a retest of the upper boundary expected.
We have a downtrend on the RSI indicator, which has reached near the lower boundary, and an upward rebo

FireHoseReel | Optimism Near Key Breakout Level as Volume Builds🔥 Welcome To FireHoseReel !
Let’s dive into Optimism (OP) analysis.
⛳️ OP Fundamental Overview
Optimism (OP) helps people use Ethereum faster and cheaper by reducing fees and speeding up transactions for DeFi, NFTs, and apps. Ranked around top 80 on CoinMarketCap, it’s a strong mid-cap Layer-2.
👀

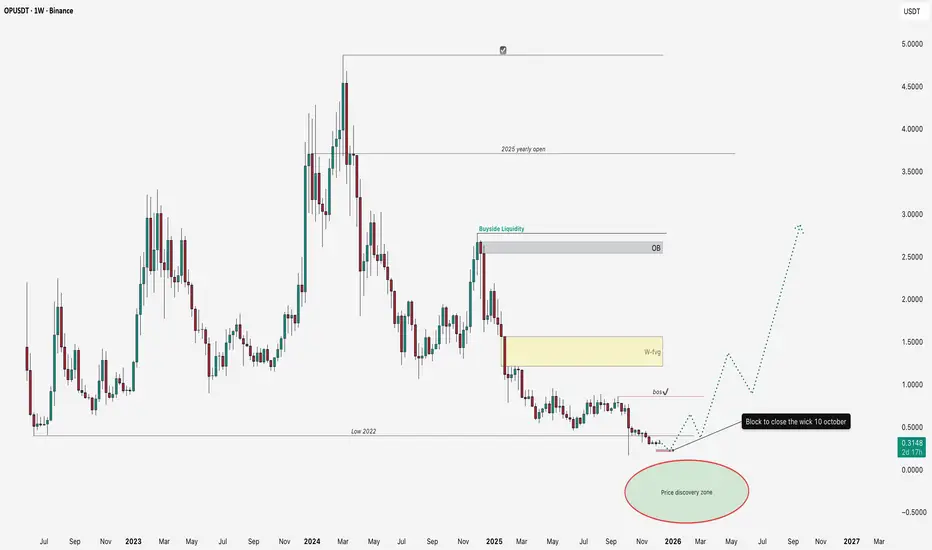
$OP 1W Broke Major Support — Be Careful📌This is a weekly chart, so this shows the long-term direction of $OP.
📌Blue arrows on the chart show support zones.Every time price came to these areas before, buyers stepped in and price moved up from there.
📌Red arrows on the chart show rejection points.Price tried to move up, but sellers pushe

#OP/USDT – Triangle Pattern Breakout Loading?#OP
The price is moving in a descending channel on the 1-hour timeframe. It has reached the lower boundary and is heading towards breaking above it, with a retest of the upper boundary expected.
We have a downtrend on the RSI indicator, which has reached near the lower boundary, and an upward rebo
Optimism goes to rest and gain strengthComplemented the full vision of the picture regarding optimism.
Optimism has fulfilled all its goals and can already go on a well-deserved rest.

Optimism Next Wave: Mid-Term Targets UncoveredWe are not taking BINANCE:OPUSDT fundamental factors into account because, let’s be honest, they have absolutely no impact on the price movement on the chart!
We’ll focus exclusively on the price action setup. For over a year, we’ve been in a downtrend.
Nothing can fall forever, so considering th
#OP/USDT Ready to launch upwards#OP
The price is moving in a descending channel on the 1-hour timeframe. It has reached the lower boundary and is heading towards breaking above it, with a retest of the upper boundary expected.
We have a downtrend on the RSI indicator, which has reached near the lower boundary, and an upward rebo

OP CURRENT EXPECTATIONS It is not finical advice at all . It just fro learning purpose .
My snap is Moja.25

OPUSDT 1D#OP is moving inside a falling wedge pattern on the daily chart and has bounced off the support. Consider buying a small bag here and near the support. Short-term targets are:
🎯 $0.4396
🎯 $0.4979
🎯 $0.5438
If price breaks above the wedge resistance, the next potential upside targets are:
🎯 $0.666

OP market forms a bullish descending expanding wedgeThe open market has formed a bullish pattern, a descending expanding wedge, and the coin is actively testing its lower boundary
Support is holding the price, if a breakout occurs, it is more likely to be false
The pattern is most likely expected to play out and move above the moving averages
Curr

See all ideas
Summarizing what the indicators are suggesting.
Oscillators
Neutral
SellBuy
Strong sellStrong buy
Strong sellSellNeutralBuyStrong buy
Oscillators
Neutral
SellBuy
Strong sellStrong buy
Strong sellSellNeutralBuyStrong buy
Summary
Neutral
SellBuy
Strong sellStrong buy
Strong sellSellNeutralBuyStrong buy
Summary
Neutral
SellBuy
Strong sellStrong buy
Strong sellSellNeutralBuyStrong buy
Summary
Neutral
SellBuy
Strong sellStrong buy
Strong sellSellNeutralBuyStrong buy
Moving Averages
Neutral
SellBuy
Strong sellStrong buy
Strong sellSellNeutralBuyStrong buy
Moving Averages
Neutral
SellBuy
Strong sellStrong buy
Strong sellSellNeutralBuyStrong buy
Displays a symbol's price movements over previous years to identify recurring trends.