#OP/USDT – Triangle Pattern Breakout Loading?#OP
The price is moving in a descending channel on the 1-hour timeframe. It has reached the lower boundary and is heading towards breaking above it, with a retest of the upper boundary expected.
We have a downtrend on the RSI indicator, which has reached near the lower boundary, and an upward rebo
Related pairs

$OP 1W Broke Major Support — Be Careful📌This is a weekly chart, so this shows the long-term direction of $OP.
📌Blue arrows on the chart show support zones.Every time price came to these areas before, buyers stepped in and price moved up from there.
📌Red arrows on the chart show rejection points.Price tried to move up, but sellers pushe

FireHoseReel | Optimism Near Key Breakout Level as Volume Builds🔥 Welcome To FireHoseReel !
Let’s dive into Optimism (OP) analysis.
⛳️ OP Fundamental Overview
Optimism (OP) helps people use Ethereum faster and cheaper by reducing fees and speeding up transactions for DeFi, NFTs, and apps. Ranked around top 80 on CoinMarketCap, it’s a strong mid-cap Layer-2.
👀

Optimism goes to rest and gain strengthComplemented the full vision of the picture regarding optimism.
Optimism has fulfilled all its goals and can already go on a well-deserved rest.

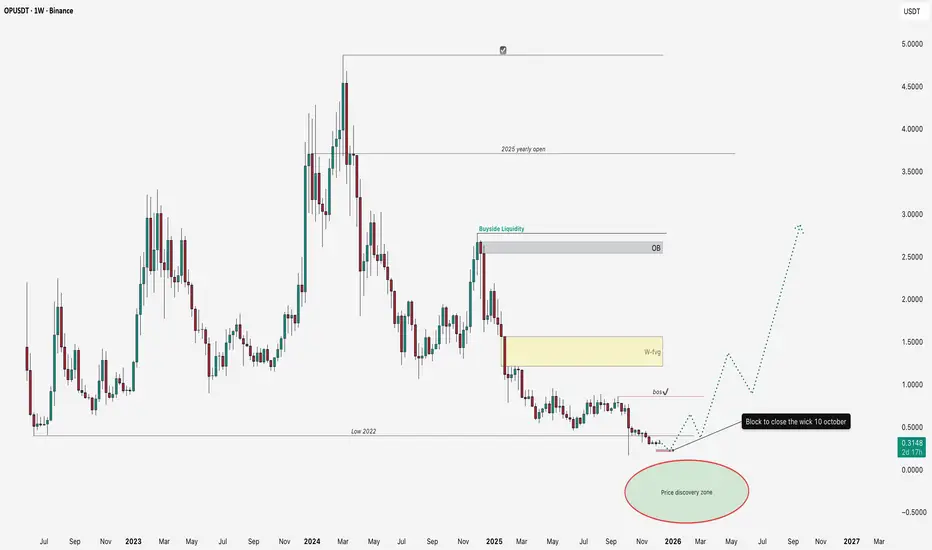
Optimism Next Wave: Mid-Term Targets UncoveredWe are not taking BINANCE:OPUSDT fundamental factors into account because, let’s be honest, they have absolutely no impact on the price movement on the chart!
We’ll focus exclusively on the price action setup. For over a year, we’ve been in a downtrend.
Nothing can fall forever, so considering th
#OP/USDT Ready to launch upwards#OP
The price is moving in a descending channel on the 1-hour timeframe. It has reached the lower boundary and is heading towards breaking above it, with a retest of the upper boundary expected.
We have a downtrend on the RSI indicator, which has reached near the lower boundary, and an upward rebo

OP CURRENT EXPECTATIONS It is not finical advice at all . It just fro learning purpose .
My snap is Moja.25

OPUSDT 1D#OP is moving inside a falling wedge pattern on the daily chart and has bounced off the support. Consider buying a small bag here and near the support. Short-term targets are:
🎯 $0.4396
🎯 $0.4979
🎯 $0.5438
If price breaks above the wedge resistance, the next potential upside targets are:
🎯 $0.666

OP market forms a bullish descending expanding wedgeThe open market has formed a bullish pattern, a descending expanding wedge, and the coin is actively testing its lower boundary
Support is holding the price, if a breakout occurs, it is more likely to be false
The pattern is most likely expected to play out and move above the moving averages
Curr

Might be time to dip back into OPBTC just smashed through $100K, and ETH's hovering right around $3K.
Might be time to dip back into OP—looks like the liq map shows they flushed out every last long trader.
Entry: $0.3547
Take Profit: $0.6800
Stop Loss: $0.3098
Playing it with a 1:8 RR.
If this one gets stopped out, I'll eye th

See all ideas
Summarizing what the indicators are suggesting.
Oscillators
Neutral
SellBuy
Strong sellStrong buy
Strong sellSellNeutralBuyStrong buy
Oscillators
Neutral
SellBuy
Strong sellStrong buy
Strong sellSellNeutralBuyStrong buy
Summary
Neutral
SellBuy
Strong sellStrong buy
Strong sellSellNeutralBuyStrong buy
Summary
Neutral
SellBuy
Strong sellStrong buy
Strong sellSellNeutralBuyStrong buy
Summary
Neutral
SellBuy
Strong sellStrong buy
Strong sellSellNeutralBuyStrong buy
Moving Averages
Neutral
SellBuy
Strong sellStrong buy
Strong sellSellNeutralBuyStrong buy
Moving Averages
Neutral
SellBuy
Strong sellStrong buy
Strong sellSellNeutralBuyStrong buy
Displays a symbol's price movements over previous years to identify recurring trends.
Frequently Asked Questions
The current price of OPUSDT SPOT (OP) is 0.2700 USDT — it has risen 0.63% in the past 24 hours. Try placing this info into the context by checking out what coins are also gaining and losing at the moment and seeing OP price chart.
OPUSDT SPOT price has fallen by −0.33% over the last week, its month performance shows a −17.11% decrease, and as for the last year, OPUSDT SPOT has decreased by −85.21%. See more dynamics on OP price chart.
Keep track of coins' changes with our Crypto Coins Heatmap.
Keep track of coins' changes with our Crypto Coins Heatmap.
OPUSDT SPOT (OP) reached its highest price on May 31, 2022 — it amounted to 14.0000 USDT. Find more insights on the OP price chart.
See the list of crypto gainers and choose what best fits your strategy.
See the list of crypto gainers and choose what best fits your strategy.
OPUSDT SPOT (OP) reached the lowest price of 0.2289 USDT on Oct 10, 2025. View more OPUSDT SPOT dynamics on the price chart.
See the list of crypto losers to find unexpected opportunities.
See the list of crypto losers to find unexpected opportunities.
The safest choice when buying OP is to go to a well-known crypto exchange. Some of the popular names are Binance, Coinbase, Kraken. But you'll have to find a reliable broker and create an account first. You can trade OP right from TradingView charts — just choose a broker and connect to your account.
Crypto markets are famous for their volatility, so one should study all the available stats before adding crypto assets to their portfolio. Very often it's technical analysis that comes in handy. We prepared technical ratings for OPUSDT SPOT (OP): today its technical analysis shows the sell signal, and according to the 1 week rating OP shows the strong sell signal. And you'd better dig deeper and study 1 month rating too — it's sell. Find inspiration in OPUSDT SPOT trading ideas and keep track of what's moving crypto markets with our crypto news feed.
OPUSDT SPOT (OP) is just as reliable as any other crypto asset — this corner of the world market is highly volatile. Today, for instance, OPUSDT SPOT is estimated as 1.45% volatile. The only thing it means is that you must prepare and examine all available information before making a decision. And if you're not sure about OPUSDT SPOT, you can find more inspiration in our curated watchlists.
You can discuss OPUSDT SPOT (OP) with other users in our public chats, Minds or in the comments to Ideas.