ORCAUSDT Forming Falling WedgeORCAUSDT is forming a clear falling wedge pattern, a classic bullish reversal signal that often indicates an upcoming breakout. The price has been consolidating within a narrowing range, suggesting that selling pressure is weakening while buyers are beginning to regain control. With consistent volum

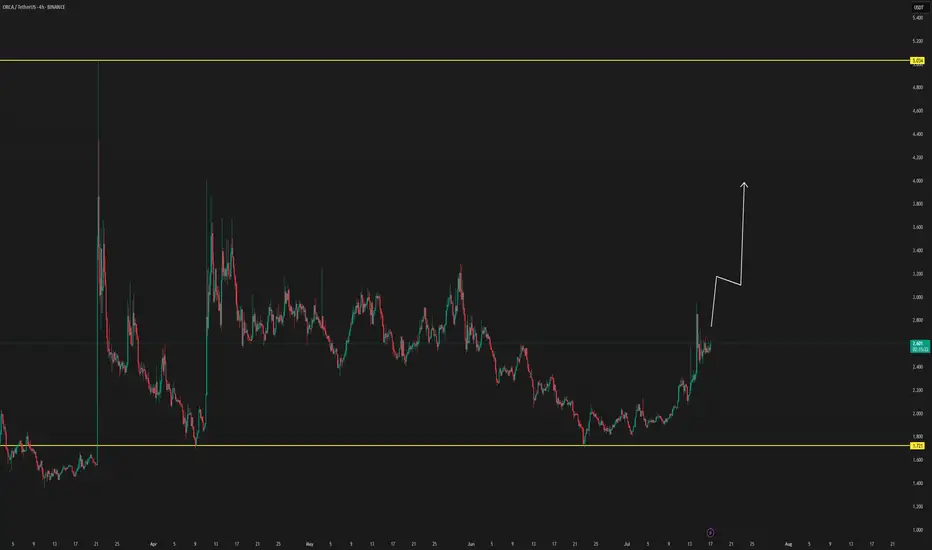
ORCA Approaching Trendline Test—Watching Move Toward $1.85–$1.90ORCA / USDT is showing strength and moving toward the $1.85–$1.90 zone to test the trendline resistance. Momentum looks solid, but risk management is important. Any breakdown below the marked horizontal levels will invalidate this setup.

ORCAUSDT 1D#ORCA is trading inside a well-defined descending channel on the daily timeframe. Price is now testing a multi-layer resistance cluster consisting of the daily SMA50, the channel midline, and the Ichimoku cloud, which together form a strong structural barrier.
A breakout with confirmed daily closes

ORCAUSDT Forming Falling WedgeORCAUSDT is forming a clear falling wedge pattern, a classic bullish reversal signal that often indicates an upcoming breakout. The price has been consolidating within a narrowing range, suggesting that selling pressure is weakening while buyers are beginning to regain control. With consistent volum

ORCA ShortWe have a short print in ORCA. Targets on the charts DYOR
Check our successful trades of XION

ORCALSE:ORCA has formed a clean descending wedge pattern, signaling a potential bullish reversal. From the current price, the setup offers around 170% upside once the breakout confirms. Strong R:R opportunity for those positioning early.

ORCA/USDT — Symmetrical Triangle Apex: The Calm Before the Storm🔎 Chart Overview
ORCA/USDT has been forming a massive Symmetrical Triangle since early 2024. The pattern is defined by lower highs (gradual selling pressure) and higher lows (steady accumulation by buyers). This represents a phase of tight consolidation, and as the price approaches the apex, the pro

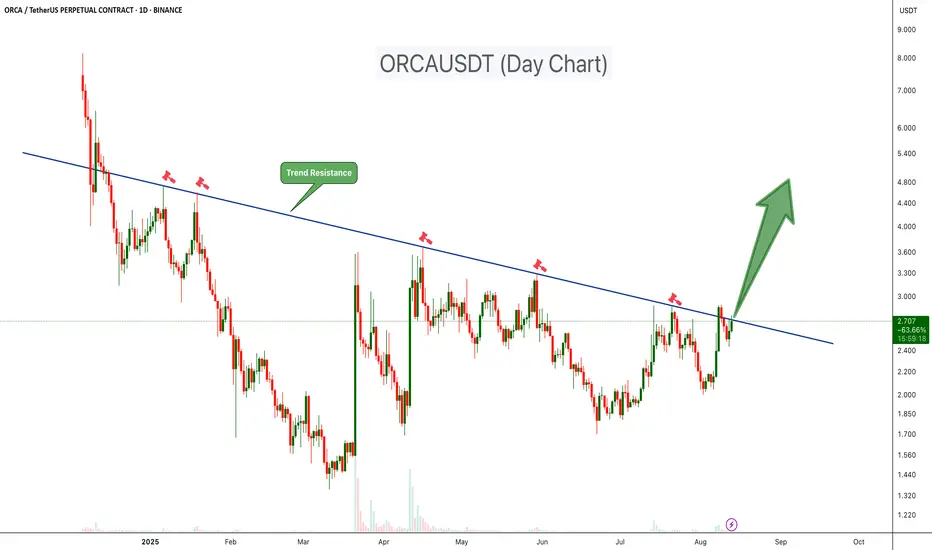
ORCAUSDT at Key Trendline: Big Move Loading!ORCAUSDT has been trading under a clear descending trendline resistance since late 2024, with multiple failed breakout attempts marked by sharp rejections. This trendline has consistently acted as a strong supply zone, pushing prices lower each time it was tested.
Key Points:
-Trend Resistance:
This is eth 2.0, grab your seat before pumpingSame chart pattern like eth 2.0
If smart money tp eth, they will move this counter next.
Grab the seat before the rocket is fire.

ORCA/USDT NEW VOLUME ENTERYORCA shows for the first time in long time ago a new volume uptrend, which can get confirmed in the next hours to a new volume.
When there are new confirmations or updates, they will be listed here below.
If there is new confirmations coming, we could see this coin soon to targets
$3.17
$4.20
B
See all ideas
Summarizing what the indicators are suggesting.
Oscillators
Neutral
SellBuy
Strong sellStrong buy
Strong sellSellNeutralBuyStrong buy
Oscillators
Neutral
SellBuy
Strong sellStrong buy
Strong sellSellNeutralBuyStrong buy
Summary
Neutral
SellBuy
Strong sellStrong buy
Strong sellSellNeutralBuyStrong buy
Summary
Neutral
SellBuy
Strong sellStrong buy
Strong sellSellNeutralBuyStrong buy
Summary
Neutral
SellBuy
Strong sellStrong buy
Strong sellSellNeutralBuyStrong buy
Moving Averages
Neutral
SellBuy
Strong sellStrong buy
Strong sellSellNeutralBuyStrong buy
Moving Averages
Neutral
SellBuy
Strong sellStrong buy
Strong sellSellNeutralBuyStrong buy
Displays a symbol's price movements over previous years to identify recurring trends.