PENGU ready for touching upper levels 60% gain toward 0.0188$Hi,
The support and resistances on the chart are based on the previous data and weekly candlesticks,
BINANCE:PENGUUSDT nis in the descending channel now and close to the resistance side if it holds this position and these last support the potential of 60% gain is logical toward 0.0188$.
and break
Related pairs

PENGUUSDT 12H#PENGU is moving inside a descending channel on the 12H timeframe. It is currently facing a heavy resistance cluster that includes the Ichimoku cloud, the channel resistance, and the SMA50. Consider buying a small bag near the support zone. In case of a breakout above the channel, the potential targ

PENGU/USDT - Will it move?Hallo,
its 1:3 trade
wait for closed candle 1 D, then entry. Dont forget to put ur SL and TP

PENGU Update🚨📊 PENGU Update
PENGU is testing the blue support level right now 🔵.
If this support breaks down,
it could become a short opportunity,
with the green line level 🟢 as the main target.
If price drops from here,
we could see PENGU fall at least 40% —
this is a critical support zone and losing it wou

PENGU/USDT: Critical Decision Point - Reclaim or Cascade?💡 Scenario Mapping
🚀 BULLISH Case: 3D frame :
If price holds above $0.012 and reclaims $0.0125:
Potential bounce toward the $0.025-0.028 range
Accumulation phase begins (blue box scenario)
Higher lows formation = trend reversal confirmation
⚡ Trading Gameplan
For Long-Term Holders:
Wait for conf

PENGU has now broken out above the right shoulder🚨📊 PENGU Update
PENGU has now broken out above the right shoulder
of the previous Head & Shoulders pattern 🔄 —
a structure that was originally bearish,
but this breakout invalidates the downside and shows new strength.
Right now, price looks like it’s making a pullback
after the breakout — a norma

PENGU/USDT Breakout LongWhy: The 5m chart shows the price consolidating around 0.0112. The daily analysis suggests a "long target" higher up, but you are currently stuck in a choppy range. You need to wait for momentum to return.
Direction: LONG
The Trigger: Wait for a 5-minute candle to close ABOVE 0.0120. (This clear

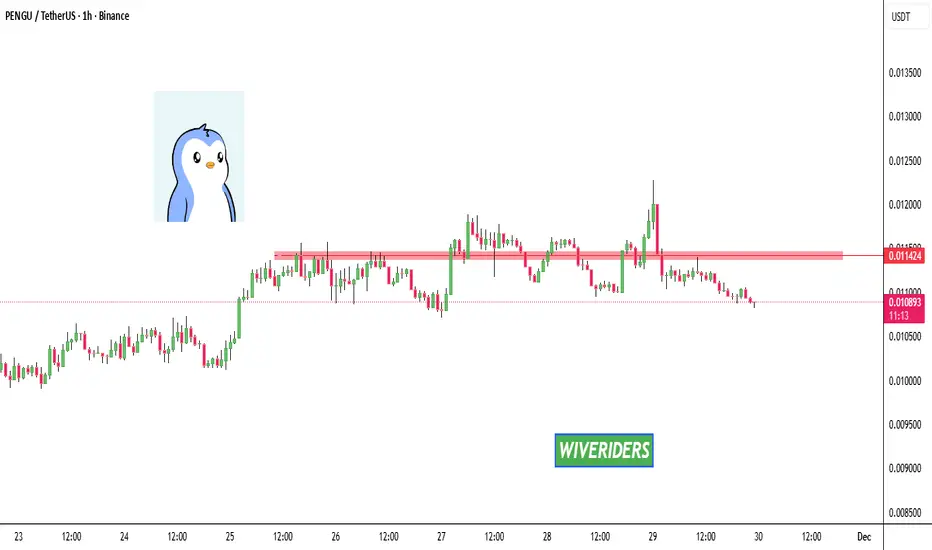
PENGU couldn’t break out above the red resistance zone📊 PENGU Update
PENGU couldn’t break out above the red resistance zone 🔴
and got rejected again, showing sellers are still strong at this level.
As long as price stays below this resistance,
upside remains limited.

PENGU Update🚨📊 PENGU Update
PENGU has also formed a new resistance zone in red 🔴.
This level is now acting as a strong ceiling,
and price must break out above this red resistance
to show any real bullish momentum again.
Until that breakout happens,
sellers remain in control and upside stays limited.
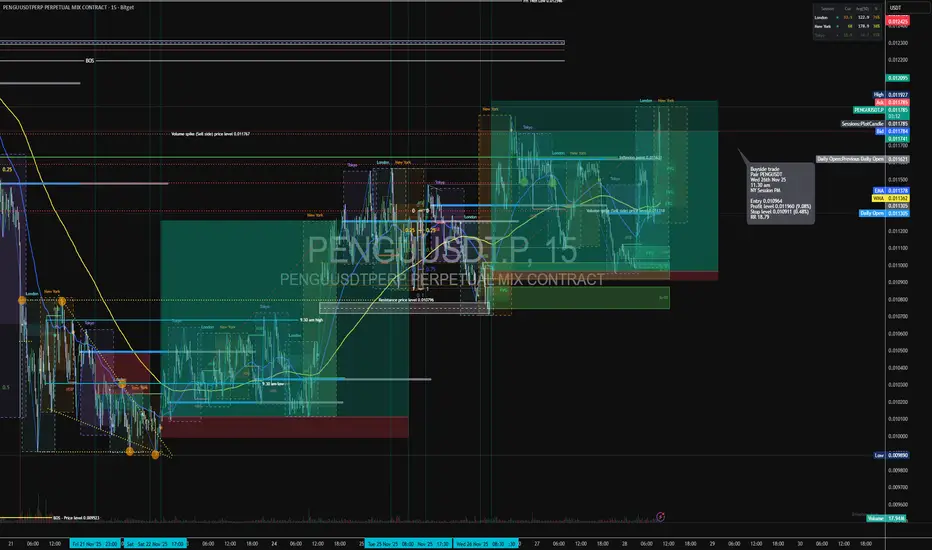
Long trade
🟦 Trade Details
Direction: Buyside Trade
Pair: PENGUSDT
Date: Wed 26th Nov 25
Time: 11:30 am
Session: NY Session PM
🟩 Execution Metrics
Entry: 0.010964
Take Profit: 0.011960 (+9.08%)
Stop Loss: 0.010911 (–0.48%)
Risk-to-Reward: 18.79
🟧 Market Structure Context
Price respects session highs/lows a
See all ideas
Summarizing what the indicators are suggesting.
Oscillators
Neutral
SellBuy
Strong sellStrong buy
Strong sellSellNeutralBuyStrong buy
Oscillators
Neutral
SellBuy
Strong sellStrong buy
Strong sellSellNeutralBuyStrong buy
Summary
Neutral
SellBuy
Strong sellStrong buy
Strong sellSellNeutralBuyStrong buy
Summary
Neutral
SellBuy
Strong sellStrong buy
Strong sellSellNeutralBuyStrong buy
Summary
Neutral
SellBuy
Strong sellStrong buy
Strong sellSellNeutralBuyStrong buy
Moving Averages
Neutral
SellBuy
Strong sellStrong buy
Strong sellSellNeutralBuyStrong buy
Moving Averages
Neutral
SellBuy
Strong sellStrong buy
Strong sellSellNeutralBuyStrong buy
Displays a symbol's price movements over previous years to identify recurring trends.
Frequently Asked Questions
The current price of PENGUUSDT SPOT (PENGU) is 0.010877 USDT — it has risen 1.15% in the past 24 hours. Try placing this info into the context by checking out what coins are also gaining and losing at the moment and seeing PENGU price chart.
PENGUUSDT SPOT price has fallen by −2.60% over the last week, its month performance shows a −22.60% decrease, and as for the last year, PENGUUSDT SPOT has increased by 54.28 K%. See more dynamics on PENGU price chart.
Keep track of coins' changes with our Crypto Coins Heatmap.
Keep track of coins' changes with our Crypto Coins Heatmap.
PENGUUSDT SPOT (PENGU) reached its highest price on Dec 17, 2024 — it amounted to 0.065000 USDT. Find more insights on the PENGU price chart.
See the list of crypto gainers and choose what best fits your strategy.
See the list of crypto gainers and choose what best fits your strategy.
PENGUUSDT SPOT (PENGU) reached the lowest price of 0.000020 USDT on Dec 17, 2024. View more PENGUUSDT SPOT dynamics on the price chart.
See the list of crypto losers to find unexpected opportunities.
See the list of crypto losers to find unexpected opportunities.
The safest choice when buying PENGU is to go to a well-known crypto exchange. Some of the popular names are Binance, Coinbase, Kraken. But you'll have to find a reliable broker and create an account first. You can trade PENGU right from TradingView charts — just choose a broker and connect to your account.
Crypto markets are famous for their volatility, so one should study all the available stats before adding crypto assets to their portfolio. Very often it's technical analysis that comes in handy. We prepared technical ratings for PENGUUSDT SPOT (PENGU): today its technical analysis shows the sell signal, and according to the 1 week rating PENGU shows the sell signal. And you'd better dig deeper and study 1 month rating too — it's sell. Find inspiration in PENGUUSDT SPOT trading ideas and keep track of what's moving crypto markets with our crypto news feed.
PENGUUSDT SPOT (PENGU) is just as reliable as any other crypto asset — this corner of the world market is highly volatile. Today, for instance, PENGUUSDT SPOT is estimated as 0.92% volatile. The only thing it means is that you must prepare and examine all available information before making a decision. And if you're not sure about PENGUUSDT SPOT, you can find more inspiration in our curated watchlists.
You can discuss PENGUUSDT SPOT (PENGU) with other users in our public chats, Minds or in the comments to Ideas.