The market is dead unless the 0.000014$ breakThe technical structure for SHIB presents a high-potential setup, with a measured growth projection of 5x to 7x from the current price of $0.000008. However, this bullish scenario is contingent upon a decisive breakout above the two key descending trendlines, with a confirmed move beyond the $0.000014 resistance level required to validate the reversal and initiate the next upward phase.
DISCLAIMER: ((trade based on your own decision))
<<press like👍 if you enjoy💚
Trade ideas

Shiba Inu (SHIB): Looking For Breakout of 200EMA | BullishSHIB is holding its local bottom well, showing that buyers are stepping in at the same zone each time. The key here is the 200 EMA — every attempt to break above it has been rejected so far, but the reactions are getting stronger. Once buyers finally secure a clean break and hold above the 200 EMA, we should see a decent upside continuation toward the major target.
Until then, this remains a buildup phase where we wait for confirmation before taking the long.
Swallow Academy

SHIB approaching a key reversal zone inside a descending channelSHIB continues to move inside a clear descending channel that has been respected since mid October. Price is once again approaching the mid zone of the channel while holding above a short term support created by recent higher lows.
The structure is now offering two possible scenarios.
Bullish idea
A reclaim of the short term trendline resistance can trigger a recovery toward the upper boundary of the descending channel.
Important focus points:
• Price stability above the short term support
• Breakout of the diagonal resistance
• Room toward the liquidity cluster at 0.00000913
• A full channel rotation opens the path to 0.00001035
Bearish idea
Failure to hold the mid support area invites continuation inside the channel.
What to watch:
• Loss of the support zone
• Return toward 0.00000827 then 0.00000779
• Deeper liquidity around 0.00000755 at the channel bottom
This level is an important pivot inside the overall channel. SHIB is preparing for a directional decision and the next breakout or rejection should define the coming weeks.

SHIBUSDT 12H#SHIB has broken above the descending resistance and the SMA50 on the 12H timeframe. In case of a breakout above the Ichimoku cloud, the potential upside targets are:
🎯 $0.00000988
🎯 $0.00001039
🎯 $0.00001112
🎯 $0.00001205
⚠️ Always remember to use a tight stop-loss and maintain proper risk management.

SHIB fighting EMAHey guys, SHIB is setting up for a potential breakdown on the 1H timeframe, and the risk-reward is looking pretty clean for short positions right now.
Price is trading at $0.00000853, sandwiched between EMA20/50 resistance at $0.00000857-858 and the make-or-break EMA200 support at $0.00000852. The ADX reading of 56.0 confirms we're in a strong trending environment, and that trend is decidedly bearish. RSI at 30.8 is approaching oversold, but without bullish divergence and with volume running 77% below average, there's no conviction for a reversal yet.
The setup: short entries around $0.00000855 with a tight stop above $0.00000865 (invalidation if we reclaim the EMA cluster). First target sits at the Bollinger Band lower support at $0.00000844, with an extended target at $0.00000838 if the EMA200 breaks. That gives us roughly 1:2.5 risk-reward on the conservative target and 1:4+ if we get the full move. The MACD remains bearish, MFI shows weak money flow at 36.5, and the internal market state is reading choppy with only 17% directional confidence, but the sell signals are stacking up.
Key risk: if price reclaims $0.00000859 (BB middle band) with volume, this whole setup gets invalidated and we could see a squeeze back toward $0.00000874. But until that happens, the path of least resistance is down, especially with such weak participation on bounces.
How are you playing this move? Waiting for the EMA200 break or already positioned short?

Shiba in daily timeIt seems that the downtrend will continue and there is a possibility of reaching the bottom of the descending channel.

SHIBUSDTWe are in correction at big short but should failed short and continue move price to high levels.
I wait for take trade with breakout 0.0000900 for buy and breakout 0.0000810 for short position.
CRYPTOCAP:PEPE KRAKEN:PEPEUSD BINANCE:PEPEUSDT

Lingrid | SHIBUSDT Potential Buy After Support Fake BreakBINANCE:SHIBUSDT perfectly played out my previous trading idea . Price is testing lower boundary of the descending channel. The market structure remains bearish overall, but the reaction at support hints at early absorption as the market forms yet another lower low near the key demand zone. If buyers defend the 0.00000741–0.00000767 area, a corrective bounce toward 0.00000890 becomes the likely scenario as liquidity builds beneath the trendline. The broader context still shows a controlled downtrend, but fake breaks at support often trigger short-term relief moves before the trend resumes.
⚠️ Risks:
A clean breakdown below 0.00000741 may open the way toward deeper lows in the support area.
Broader market weakness—especially BTC volatility—could invalidate any developing rebound.
Failure to reclaim the descending trendline may limit upside movement and keep SHIB consolidating near the lows.
If this idea resonates with you or you have your own opinion, traders, hit the comments. I’m excited to read your thoughts!

Shiba Inu (SHIB) Update — Yearly Low DefendedShiba Inu is holding its yearly low after retesting long-term support and posting multiple candle closes above it. The structure shows signs of stabilisation while burn rates surge sharply.
The 1,000% jump in token burns highlights increased network activity, which may support a reversal attempt if price continues to hold above this zone. Still, SHIB needs stronger confirmation before any sustained move higher.
Key Points
- Yearly low defended with multiple closes above support
- Burn-rate spike suggests heightened on-chain activity
- Early stabilisation may precede a short-term rebound
What to Expect
If the yearly low remains intact, SHIB may attempt a rotation toward upper range levels. Losing this support would expose the price to further downside.

SHIBUSDT the massive pump is ahead SHIBUSDT is currently testing a critical weekly support level. A strong defense of this zone could potentially catalyze a technical rebound. The subsequent price trajectory would depend on consecutive breakouts above two significant descending trendlines that have contained previous rallies. Each confirmed breakout would represent a key technical milestone, potentially unlocking further upward targets as market structure progressively strengthens.
DISCLAIMER: ((trade based on your own decision))
<<press like👍 if you enjoy💚

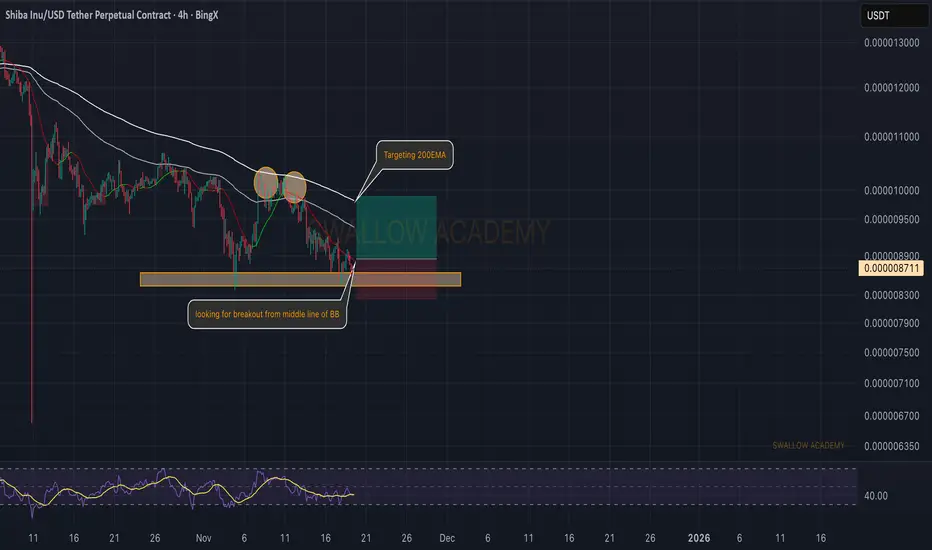
Shiba Inu (SHIB): Looking For Break of Middle Line of BB SHIB is hovering inside a small accumulation area, and buyers are slowly trying to take back control. What we want to see now is a clean breakout from the middle line of the Bollinger Bands — that would give us the first sign of strength.
If buyers manage to secure that breakout, the next target becomes the 200 EMA. Until then, we stay patient and wait for that confirmation candle.
Swallow Academy
Shiba Inu Will Become Bullish Soon (3D)Shiba Inu is completing a very large correction across higher degrees and larger time frames.
It appears to be in a double or multiple correction, currently in the second phase. This phase itself is a complex correction, and it is now finishing wave C of this complex corrective structure.
The green zone is where Shiba can enter wave D in the higher time frames | a bullish wave.
Remember, we do not make decisions based on emotions; we analyze based on signals and indications.
For risk management, please don't forget stop loss and capital management
When we reach the first target, save some profit and then change the stop to entry
Comment if you have any questions
Thank You

SHIB/USDT — Critical Demand Zone: Reversal or Full Capitulation?SHIB is now revisiting the major demand zone at 0.000007–0.0000055, a level that has acted as the foundation of every major multi-month rally since 2021.
This zone is not just support — it is a psychological pivot that separates long-term accumulation from market capitulation.
Each historical touch of this zone has triggered strong bullish reactions, yet the current structure is different:
Weekly price action continues to print lower highs, signaling that institutional selling pressure remains active while buyer conviction has not yet shown dominance. SHIB is entering a transitional phase, where the next few weekly candles can redefine its macro direction.
---
Price Structure and Market Pattern
1. Descending Structure / Lower Highs
Indicates weakening long-term momentum and the need for strong confirmation before any sustainable bullish reversal.
2. Major Demand Zone (0.000007–0.0000055)
A multi-year accumulation area with repeated deep wicks and strong historical rejections, showing where large players have entered previously.
3. Layered Horizontal Supply Zones
Key resistance levels created by previous distribution phases:
0.0000107
0.0000160
0.0000326
0.0000667
4. Market Compression
The longer price compresses against this demand zone, the larger the eventual breakout impulse — in either direction.
---
Bullish Scenario: A Major Reversal Begins Here
Bullish confirmation requires:
1. A weekly close above 0.000007
2. A strong reversal candle (bullish engulfing, hammer with solid body)
3. Increasing buying volume
4. Early bullish divergence on RSI/MACD (weekly or daily)
If confirmed, upside levels open in stages:
Target 1: 0.0000107
Target 2: 0.0000160
Target 3: 0.0000326
Breaking above Target 3 would signal a potential macro trend shift, turning SHIB from long-term bearish to structurally bullish.
---
Bearish Scenario: Breakdown and Capitulation Phase
Bearish continuation is confirmed if:
1. Weekly close breaks below 0.0000055
2. Retest of 0.000007 fails to reclaim
3. Selling volume accelerates, showing loss of long-term accumulation interest
If this breakdown holds, price opens the door to deeper downside:
0.0000040
0.0000030
These levels represent historical liquidity pockets where capitulation tends to occur before larger players begin accumulating again.
---
Key Takeaway
SHIB is not just sitting at a support — it is testing the macro decision zone that will determine its long-term direction into 2026.
From a probability perspective:
Holding the 0.000007–0.0000055 zone = potential for a major swing rally
Losing it on a weekly close = activation of a deeper bearish leg
The upcoming weekly closures will define whether SHIB resets its long-term trend or enters a prolonged capitulation phase.
---
#SHIB #SHIBUSDT #CryptoAnalysis #MarketStructure #WeeklyChart #SupportZone #DemandZone #PriceAction #AltcoinAnalysis

Shiba inu (SHIB): Looking For Bullish Payout | Targeting200EMA SHIB has been in an accumulation phase for a while, with buyers slowly building strength near the lows. What we want to see next is a proper breakout from this range — once that happens, it could open a clear path toward the 200EMA.
Until then, patience is key, as pressure from EMAs has repeatedly rejected attempts to push higher.
Swallow Academy

SHIBUSDT soon two major resistance will break and then pump As observed on the SHIBUSDT chart, the price is undergoing a significant correction, consistently facing rejection at two distinct descending trendline resistance levels. Each test of these dynamic resistances has resulted in a sell-off.
However, the current technical structure suggests a potential for an upside breakout. The primary scenario is a decisive break above the first, more immediate trendline. This initial breakout would project a move toward the second, higher trendline as the initial technical target. Following a potential consolidation period, a subsequent breakout above the second trendline would signal a much stronger bullish trend activation, potentially initiating a sustained and significant upward movement.
DISCLAIMER: ((trade based on your own decision))
<<press like👍 if you enjoy💚

Lingrid | SHIBUSDT Market Consolidation ContinuesThe price perfectly fulfilled my previous idea . BINANCE:SHIBUSDT rejected from the upper boundary of its descending structure, continuing to trade within a well-defined bearish channel. The price structure shows repeated lower lows and consolidations inside a mid-range zone under the downward trendline. If CRYPTOCAP:SHIB fails to close above 0.00001100, selling pressure could extend toward 0.00000835.Overall momentum remains bearish with no strong reversal signs yet.
⚠️ Risks:
A sudden breakout above the descending trendline could invalidate short bias.
Positive macro data or Bitcoin strength may trigger risk-on sentiment and lift altcoins.
Oversold conditions could lead to a temporary corrective rebound before further decline.
If this idea resonates with you or you have your own opinion, traders, hit the comments. I’m excited to read your thoughts!

SHIBA INU: Don't Miss This TradeSHIBA INU: Don't Miss This Trade
Currently, SHIBA INU is in a Long-Term Accumulation Before Next Move
SHIBA INU is approaching a major historical support zone around 0.0000067, a level that has triggered strong bullish reactions in the past.
Price has been consolidating for months, suggesting accumulation before a potential larger bullish movement.
We cannot predict when SHIBA INU may rise, but the current area is a historical area that turned out to be the lowest level in years for this crypto.
The first target has a potential of almost +150% and the second target of almost +250%.
If this zone holds, SHIB could start a new bullish cycle targeting:
🎯 0.0000170
🎯 0.0000320
🎯 0.0000420
Patience is key here — long-term investors may see this as a potential accumulation phase ahead of the next crypto market expansion.
You may find more details in the chart!
Thank you and Good Luck!
❤️PS: Please support with a like or comment if you find this analysis useful for your trading day❤️

SHIBUSDT strong support zone can pump it hard soonObservation: Correct. While a significant portion of the market, particularly older tokens, has experienced substantial rallies, SHIBUSDT has notably underperformed.
Current State: The asset is currently dead and trading within a tight consolidation range, showing a distinct lack of momentum.
Forward Outlook: However, this period of consolidation is likely nearing its conclusion. We anticipate a decisive breakout from this range, which could catalyze a significant bullish impulse and drive price appreciation.
We are monitoring for a volume-backed breakout to confirm the initiation of this next move.
DISCLAIMER: ((trade based on your own decision))
<<press like👍 if you enjoy💚

support and resistance levels in shibusdtYou can see the chart of this currency on the weekly time frame. The support and resistance levels are clear

SHIBUSDT
Volume is rising and has reached oversold levels. It’s time for a rebound based on the current data.
"The expected movement in the upcoming period is shown on the chart"
Do you agree with my view ?

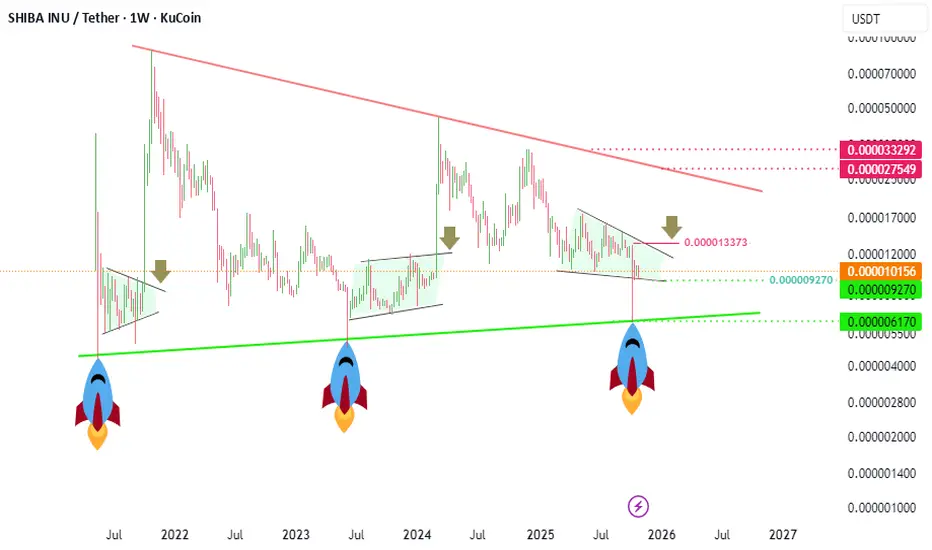
#SHIBUSDT ( pump ? )Whenever it hits the green support line,
it becomes a rocket.
Before it becomes a rocket,
it also formed a green compression pattern and
reached the ceiling by breaking out of the ceiling of the pattern.
SHIB the dead coin soon again will pump hardSHIB has been undergoing a prolonged period of consolidation, characterized by low volatility and a notable absence of significant bullish momentum over recent months. Such phases of compression and quiet price action often occur after a prior trending period and typically precede a new directional move.
Technical analysis suggests this accumulation phase may be nearing its conclusion. We are now monitoring for a potential catalyst that could trigger a robust bullish impulse. The anticipated outcome of such a move would be a decisive breakout, likely manifested as a series of strong bullish candles, propelling the asset toward the predefined technical targets established on the chart.
DISCLAIMER: ((trade based on your own decision))
<<press like👍 if you enjoy💚

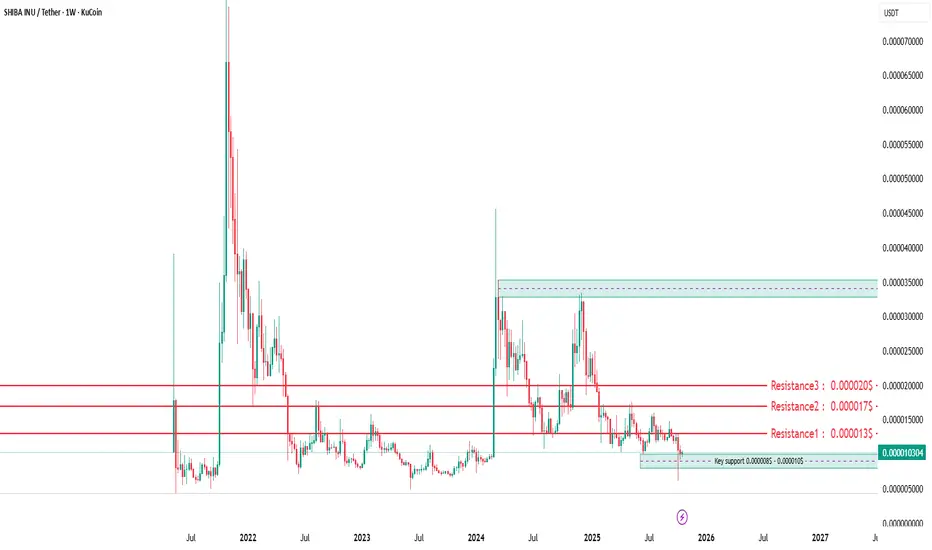
Shiba Inu (SHIB/USDT) Technical Overview (Weekly Timeframe)Shiba Inu is still in a long-term accumulation phase, moving sideways after its huge 2021 spike. The price has been consolidating between 0.000006 and 0.000018 for almost two years.
Key Observations:
Major Support Zone: 0.000008–0.000009 — this is the area where long-term buyers usually step in.
Resistance Zone: 0.000017–0.000020 — strong selling pressure every time price touches this zone.
The chart shows multiple “mini-rallies” that failed to hold above resistance — a typical pattern before a breakout.
Volume is relatively low but steady, indicating smart money accumulation at the bottom.
If SHIB breaks and holds above 0.000012, the next key target zone is 0.000017–0.000020, followed by 0.000028 in a strong bullish wave.
📊 Short-Term (Daily Timeframe)
Currently, SHIB is hovering around 0.000010, very close to a historical support level.
Technical Insights:
The market has printed several long wicks to the downside, showing buyers defending the support zone.
A descending triangle seems to be forming — which can break either way, but considering the low volatility, the probability of a false breakdown then a sharp recovery is high.
RSI is near oversold territory, and momentum is flat → potential energy buildup for a move.
Important Levels:
Support: 0.0000095 – 0.0000100
Immediate Resistance: 0.0000125
Breakout Confirmation: Above 0.0000130 (strong volume required)
🚀 Possible Scenarios
Scenario Description Targets
🟢 Bullish Reversal Bounce from 0.000010 + breakout above 0.000013 0.000017 → 0.000020 → 0.000028
🔴 Bearish Continuation Break below 0.000009 0.000007 → 0.000006
⚪ Neutral Range Sideways between 0.000009–0.000012 Accumulation phase continues
💬 Summary (for showing off 😏)
“SHIB is sitting on a long-term accumulation zone around 0.000010. Price compression and flat momentum suggest a big move is coming — a breakout above 0.000013 could start a new rally toward 0.00002 and beyond.”