How Emotions Sneak Into Your Trades (and How to Catch Them)Because the market doesn’t care how you feel — but your portfolio absolutely does.
Every trader likes to believe they’re rational. Calm. Data-driven. A master of charts and probabilities.
And sometimes that’s true — at least until price starts moving faster than expected, your P&L flickers red, a

Spx lowerI'm in the hospital and using the app to trade. Hopefully I'll be out of here today or tomorrow.
I think it's a short from here 10:05 Eastern. If they continue rallying the rest of today, I'm wrong. From here we should test and possible break the lows.
Good luck 🤞

S&P 500 to 10,000 inside the next 4 years - December 2025** This is an outlook for the next 3 to 4 years **
** The bull market is not yet done, sorry bears **
Yes, read that right, 10,000 or 10k for the S&P 500.
The markets shall continue to grind higher during this 10-year bear market everyone is talking about.
Upwards and onwards for investors as u

SP500 Price Update – Clean Clear ExplanationSP500 Price has broken down from the rising channel, signalling a shift in short-term market structure. After multiple rejections near the upper channel resistance, sellers stepped in aggressively, pushing price below key support.
🔹 Current Structure
Breakdown below mid-range support (~6770)
Fai

US500: Beware of a Possible DowntrendUS500: Beware of a Possible Downtrend
US500 found a strong resistance area near 6920, as we can see the price reacting quickly. There is a high possibility that we will have a strong resistance area near the top of the structure, which could push the price back down to the bottom of a larger corre

The Retail Trend-Following MythThe Illusion of Simple Profits: A Quantitative Analysis of Moving Average Trend Following Strategies and the Gap Between Retail Mythology and Institutional Reality
The proliferation of retail trading education has created a widespread belief that trend following through moving average crossover sy

S&P 500 index at PRZ — Next Bullish Rally!!!In general, I place significant importance on the S&P 500 index( SP:SPX ), especially over the past month, because of its strong correlation with the crypto market, particularly Bitcoin( BINANCE:BTCUSDT ). When sharp movements occur in the S&P 500 index, we often see a mirrored effect in the crypto

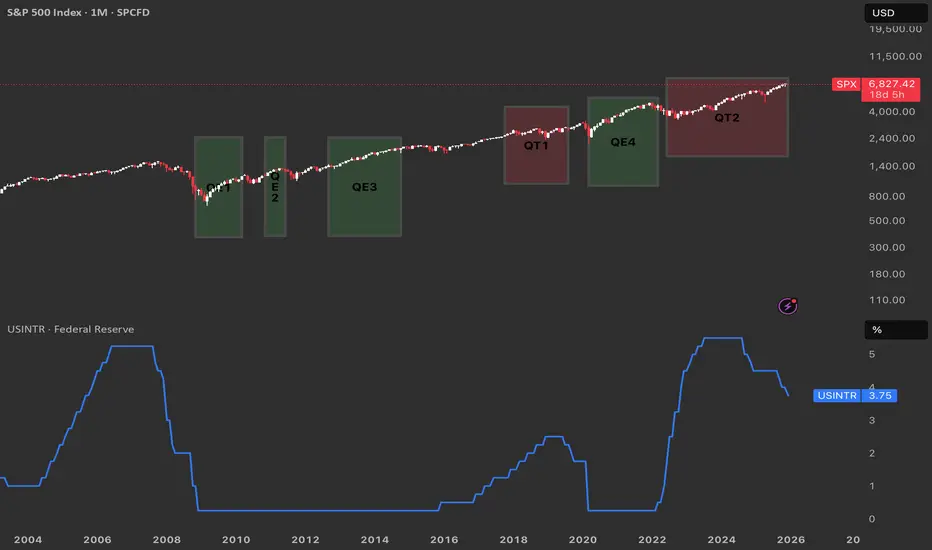
From QE to QT. Reading the Fed’s Cycle from the ChartQuantitative Easing (QE) is when the Federal Reserve buys large amounts of Treasuries and mortgage‑backed securities to expand its balance sheet, inject liquidity, and push interest rates lower across the curve.
Quantitative Tightening (QT) is the opposite: the Fed allows its bond holdings to
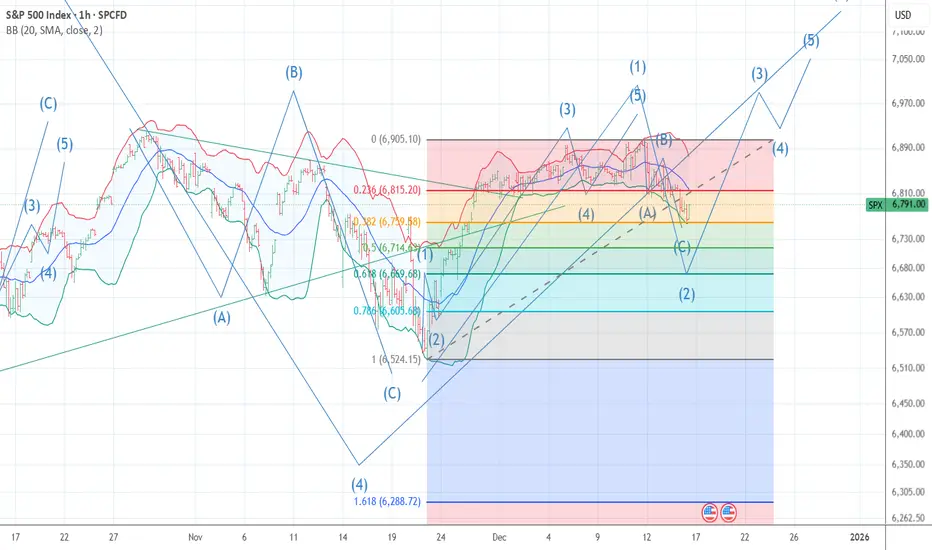
SP 500 abc decline has ENDED wave a=c to a .382 pullback 3 UPThe chart posted is the sp 500 I am calling the decline as Over and wave 3 up to start waves and c are equal and the drop was .382 > I now look for the santa rally to start in wave 3 up it should be .618 of wave 1 wave 3 should now see 6996 plus or minus 5. best of trades WAVETIMER I am NOW l
Be careful with S&P500 !!!The price can form a head and shoulders pattern. If that is happen, expect a significant price increase.

See all ideas
Displays a symbol's value movements over previous years to identify recurring trends.
Frequently Asked Questions
S&P Index Cash CFD (USD) reached its highest quote on Dec 11, 2025 — 6,934.40 USD. See more data on the S&P Index Cash CFD (USD) chart.
The lowest ever quote of S&P Index Cash CFD (USD) is 2,177.62 USD. It was reached on Mar 23, 2020. See more data on the S&P Index Cash CFD (USD) chart.
S&P Index Cash CFD (USD) is just a number that lets you track performance of the instruments comprising the index, so you can't invest in it directly. But you can buy S&P Index Cash CFD (USD) futures or funds or invest in its components.