SPELL/USDT — Falling Wedge: Is a Big Reversal on the Horizon?The SPELL/USDT (2D – Binance) pair is currently forming a large Falling Wedge pattern, a classic technical formation that often signals the end of a prolonged downtrend and the potential beginning of a bullish reversal.
Since the early-year peak, SPELL has been locked inside a downward-sloping chan
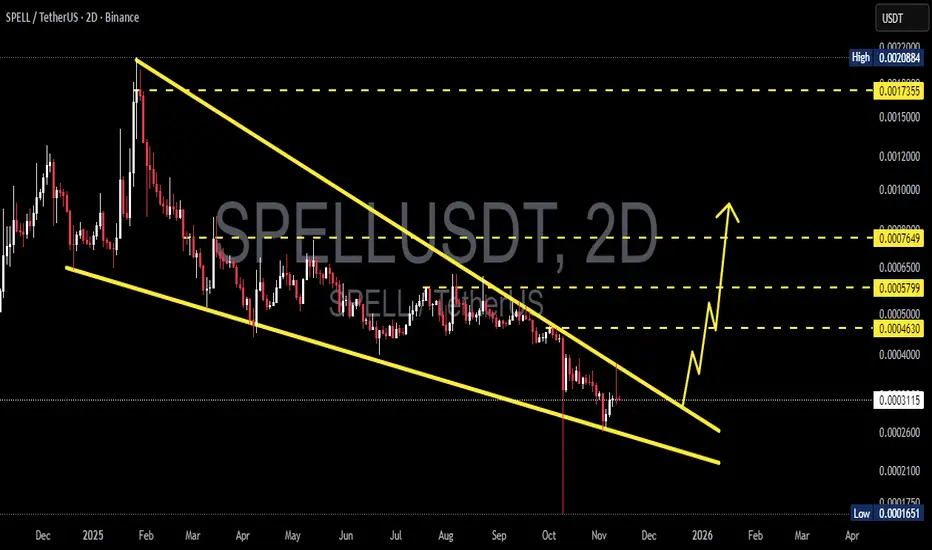
SPELLUSDT 1D#SPELL is moving inside a falling wedge pattern on the daily chart. Consider buying near the support. In case of a breakout above the pattern resistance and the daily SMA50, the potential targets are:
🎯 $0.0003916
🎯 $0.0004880
🎯 $0.0006182
🎯 $0.0007234
🎯 $0.0008285
🎯 $0.0009783
⚠️ Always use a tig


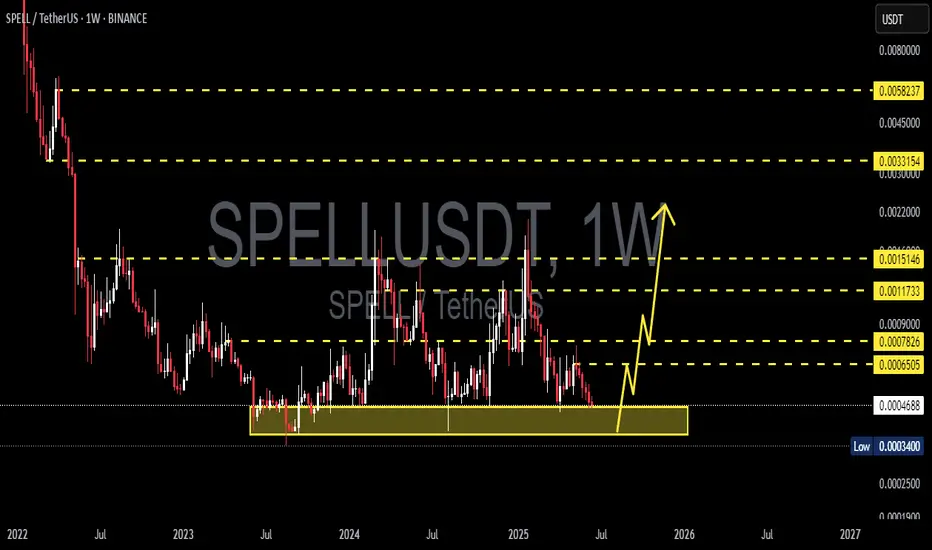
CYCLE UPDATE FOR SPELL/USDT $0,002 2025SPELL/USDT – Loading Next Cycle? 🚀
Looking at SPELL on the weekly chart, the structure looks very clear to me.
We had big cycle tops before (A → B → C), and every time after a long accumulation, the price came back with a strong pump.
Right now, SPELL is sitting at the bottom around 0.0005, a leve

SPELL/USDT HAS HIGH CHANCE TO BREAK UP $0,001Depending on last data and since BTC is positive Spell show that this can be the bottom and for new reenter to up $0,001, we will follow the coin for confirmations.

SPELL/USDT — Long-Term Accumulation or Final Breakdown?Since early 2022, SPELL has been in a strong downtrend, followed by a multi-year consolidation. Right now, the price is once again sitting inside the critical accumulation zone (0.00034 – 0.00047), which has been tested multiple times over the past 2+ years. This area represents a major battleground

Spell Token (SPELL)On the above 2-day chart price action has corrected over 80%. A number of reasons now exist to be long, including:
1) Price action and RSI resistance breakouts.
2) Price action corrects to past resistance/support.
3) Price action backtest is also the Fibonacci 0.236
4) Finally, the flag breakou

SPELL — the pattern may repeat📉 Technical overview:
SPELL has gone through a dramatic decline since launch, but the chart reveals a consistent pattern: long accumulation phases in a descending wedge formation, followed by sharp upward impulses.
Currently, the price is once again consolidating near the same zone where previous

SPELLUSDT Descending ChannelSPELLUSDT Technical analysis update
SPELL price exceeded the resistance line of a descending channel pattern on the day chart, accompanied by high volume. While this could indicate potential upward movement in the coming days
Buy level: Below $0.00070
Stop loss : $0.00057
Regards
Hexa

SPELLUSDT 1W AnalysisSPELL ~ 1W Analysis
#SPELL This is the lowest support for now. Buy from here if you still have faith in this coin with a short term target of at least 20%+.
See all ideas
Summarizing what the indicators are suggesting.
Oscillators
Neutral
SellBuy
Strong sellStrong buy
Strong sellSellNeutralBuyStrong buy
Oscillators
Neutral
SellBuy
Strong sellStrong buy
Strong sellSellNeutralBuyStrong buy
Summary
Neutral
SellBuy
Strong sellStrong buy
Strong sellSellNeutralBuyStrong buy
Summary
Neutral
SellBuy
Strong sellStrong buy
Strong sellSellNeutralBuyStrong buy
Summary
Neutral
SellBuy
Strong sellStrong buy
Strong sellSellNeutralBuyStrong buy
Moving Averages
Neutral
SellBuy
Strong sellStrong buy
Strong sellSellNeutralBuyStrong buy
Moving Averages
Neutral
SellBuy
Strong sellStrong buy
Strong sellSellNeutralBuyStrong buy
Displays a symbol's price movements over previous years to identify recurring trends.