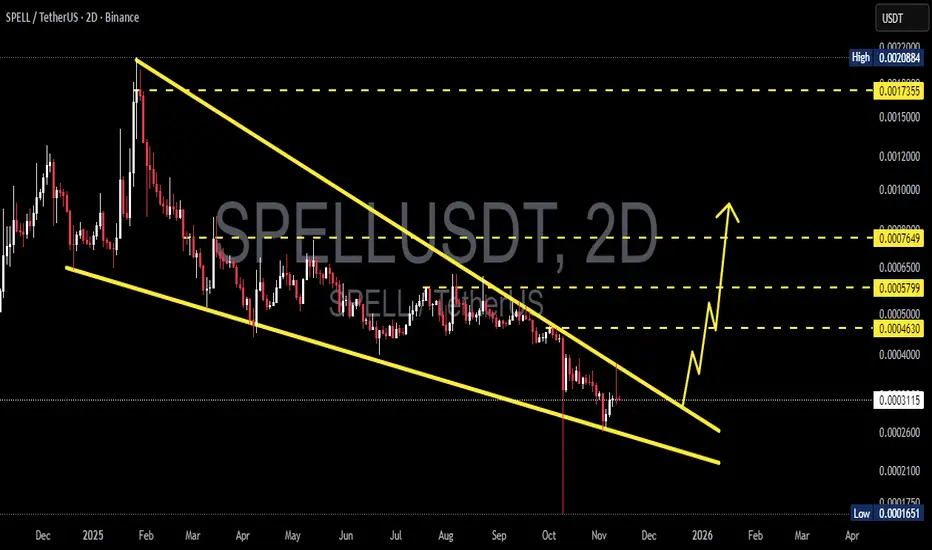
SPELL/USDT — Falling Wedge: Is a Big Reversal on the Horizon?The SPELL/USDT (2D – Binance) pair is currently forming a large Falling Wedge pattern, a classic technical formation that often signals the end of a prolonged downtrend and the potential beginning of a bullish reversal.
Since the early-year peak, SPELL has been locked inside a downward-sloping channel, consistently printing lower highs and lower lows. However, each drop toward the wedge’s lower boundary has triggered buying reactions, hinting that accumulation may be taking place quietly among strong hands.
Now, as price moves closer to the apex of the wedge, volatility is compressing — setting the stage for a decisive breakout or breakdown.
This is the make-or-break zone for SPELL.
---
Pattern & Key Levels
🔹 Main pattern: Falling Wedge (potential bullish reversal setup).
🔹 Current price: Around 0.0003138 USDT.
🔹 Critical support: Lower wedge boundary and the historical low at 0.0001651 (strong invalidation level).
🔹 Key resistance / breakout targets:
0.0004630 → initial breakout target
0.0005799 → structural shift confirmation
0.0007649 → mid-term target
0.0017355 → extended target if momentum accelerates
---
Bullish Scenario
1. Breakout Confirmation:
A strong 2D candle close above the descending resistance line with a clear rise in volume would confirm a potential trend reversal.
2. Retest for Validation:
After the breakout, a retest of the former resistance (now turned support) could offer a low-risk entry opportunity.
3. Progressive Targets:
Target 1: 0.0004630 — first reaction zone
Target 2: 0.0005799 → 0.0007649 — continuation targets
Extended Target: 0.0017355 — possible in a strong altcoin rally
4. Momentum Confirmation:
Sustained volume growth + higher closes above the wedge will reinforce bullish sentiment.
---
Bearish Scenario
1. Rejection at Upper Wedge:
Price fails to break the upper resistance and faces rejection → potential retest of the lower wedge line.
2. Breakdown Below Support:
If SPELL closes below the wedge and loses 0.0001651, it would confirm continuation of the macro downtrend.
3. Downside Targets:
Initial support zone between 0.00022 – 0.00018, then down to 0.0001651 if selling pressure intensifies.
4. Bearish Confirmation:
Rising sell volume and strong candles below support would indicate distribution and further downside risk.
---
Conclusion
SPELL has been trapped in a multi-month descending wedge, and now approaches a critical decision point. Historically, such wide wedge formations often precede explosive reversals when breakout confirmation is supported by volume.
However, if the price fails to break out and instead closes below support, the bearish continuation remains in play.
This is the decisive moment for SPELL:
📈 Breakout → potential trend reversal.
📉 Breakdown → extended bearish continuation.
---
Technical Notes
Wait for 2D candle confirmation and volume validation before acting on a breakout.
Use multi-timeframe confluence (4H + 1D) for better entry confirmation.
Apply strict risk management due to SPELL’s volatility and low liquidity nature.
---
#SPELL #CryptoAnalysis #Altcoin #TechnicalAnalysis #FallingWedge #BullishSetup #BreakoutWatch #PriceAction #MarketStructure #SwingTrade #CryptoChart #AltcoinReversal
Market insights
SPELLUSDT 1D#SPELL is moving inside a falling wedge pattern on the daily chart. Consider buying near the support. In case of a breakout above the pattern resistance and the daily SMA50, the potential targets are:
🎯 $0.0003916
🎯 $0.0004880
🎯 $0.0006182
🎯 $0.0007234
🎯 $0.0008285
🎯 $0.0009783
⚠️ Always use a tight stop-loss and apply proper risk management.


CYCLE UPDATE FOR SPELL/USDT $0,002 2025SPELL/USDT – Loading Next Cycle? 🚀
Looking at SPELL on the weekly chart, the structure looks very clear to me.
We had big cycle tops before (A → B → C), and every time after a long accumulation, the price came back with a strong pump.
Right now, SPELL is sitting at the bottom around 0.0005, a level where it has been building support for a long time. If this cycle repeats, the next big wave (D) could target around 0.002 in 2025.
We see here a view that every time it started around the same time.
And the last pattern structure shows the same trend as it did before (exactly the same patterns)
For the trading update SEP/OCT
There is an expectation for $0,001
My view:
As long as we hold this base, I expect a breakout first toward 0.0010 – 0.0012.
If that zone flips into support, then the next leg up could reach 0.0019 – 0.0020.
This would match the previous cycle moves we saw before.
But at the same time, know that cycles go with a study plan and not just random.
There is a trend on this coin where the cycles can run between 32 days and 91 days to targets.
I’m watching closely. Accumulation is boring, but that’s usually where the best moves start. Patience could pay off big here. always do your study and make only choices depending your view as Cycles can take time.

SPELL/USDT HAS HIGH CHANCE TO BREAK UP $0,001Depending on last data and since BTC is positive Spell show that this can be the bottom and for new reenter to up $0,001, we will follow the coin for confirmations.

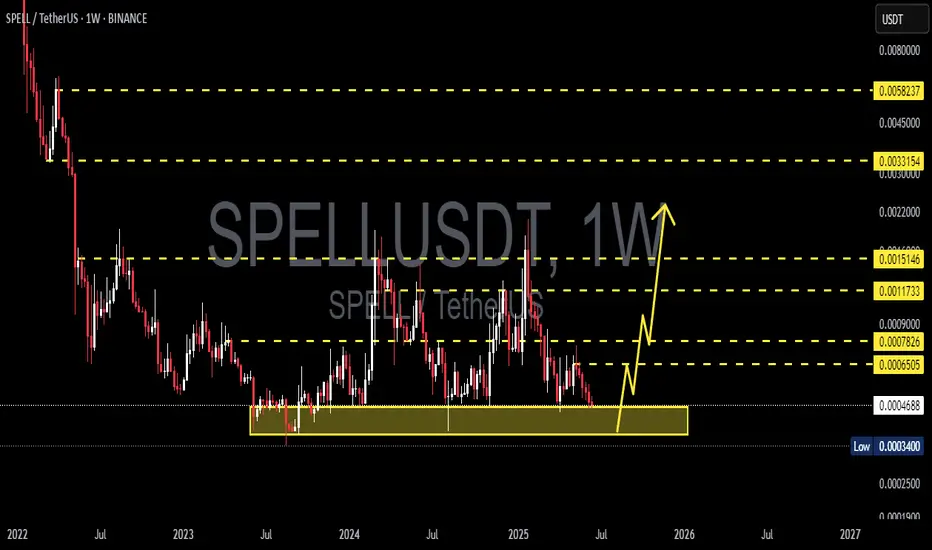
SPELL/USDT — Long-Term Accumulation or Final Breakdown?Since early 2022, SPELL has been in a strong downtrend, followed by a multi-year consolidation. Right now, the price is once again sitting inside the critical accumulation zone (0.00034 – 0.00047), which has been tested multiple times over the past 2+ years. This area represents a major battleground between long-term buyers looking for undervaluation and sellers maintaining downward pressure.
---
🔎 Chart Structure & Pattern
Macro Downtrend: clear series of lower highs and lower lows since 2022, showing dominant selling pressure.
Rectangle Accumulation: since 2023, price has been moving sideways inside the yellow support box (0.00034 – 0.00047).
Repeated Rejections: every dip into this zone was met with sharp wicks upward, showing demand.
But... if this zone fails, it may confirm exhaustion of buyers and open the door for deeper downside.
---
🚀 Bullish Scenario (Rebound & Reversal)
For SPELL to flip bullish, these conditions must be met:
1. Support Holds: weekly close remains above 0.00034.
2. Breakout Confirmation: price must break and hold above resistance levels at 0.00065 → 0.00078 → 0.00117.
3. Volume Expansion: strong volume on the breakout to confirm real demand.
🎯 Bullish Targets:
Short-term: 0.00065 – 0.00078
Mid-term: 0.00117 – 0.00151
Long-term (major reversal): 0.00331 – 0.00582
---
⚠️ Bearish Scenario (Breakdown & Continuation)
If SPELL closes below 0.00034 on the weekly, it will confirm a major breakdown:
Long-term holders may cut losses, adding further selling pressure.
With no strong historical support below, price may seek psychological levels lower.
This could trigger a capitulation phase, creating new lows before a potential cycle reset.
🎯 Bearish Targets:
Psychological support at 0.00020 – 0.00025 or even deeper levels due to lack of structure below.
---
🧩 Conclusion & Narrative
SPELL is at a make-or-break zone:
If 0.00034 – 0.00047 holds, we could see a significant rebound with multi-level rally potential.
If it breaks, we may enter a new bearish leg with much lower prices ahead.
For traders, this area can be approached two ways:
Aggressive Strategy: accumulate inside support with a tight stop below 0.00034.
Conservative Strategy: wait for a confirmed breakout above 0.00078 and enter on the retest.
📌 Bottom line: This zone is not just numbers — it’s the cycle-defining area for SPELL in the coming months and possibly years.
---
#SPELL #SPELLUSDT #Crypto #Altcoin #TechnicalAnalysis #SupportResistance #PriceAction #CryptoAnalysis #Accumulation

Spell Token (SPELL)On the above 2-day chart price action has corrected over 80%. A number of reasons now exist to be long, including:
1) Price action and RSI resistance breakouts.
2) Price action corrects to past resistance/support.
3) Price action backtest is also the Fibonacci 0.236
4) Finally, the flag breakout projects a 150% target.
Is it possible price action falls further? Sure.
Is it probable? no.
Ww
Type: trade
Risk: <=6%
Timeframe: Longs from now until month end
Return: 150%

SPELL — the pattern may repeat📉 Technical overview:
SPELL has gone through a dramatic decline since launch, but the chart reveals a consistent pattern: long accumulation phases in a descending wedge formation, followed by sharp upward impulses.
Currently, the price is once again consolidating near the same zone where previous breakouts occurred. The structure resembles past setups, which eventually led to explosive moves.
📊 Key zones:
Accumulation support remains intact
Previous breakout zones overhead serve as potential targets
Full pattern continuation could offer significant upside
🧠 Opinion:
SPELL behaves like a typical speculative token with a clear memory on the chart. Price reactions appear to follow historical fractals, which makes it an interesting candidate for trend-based speculation.
🎯 Conclusion:
Price is back in a familiar range where major reversals began previously. The setup is worth watching as a high-risk/high-reward opportunity for those who follow pattern-based strategies.

SPELLUSDT Descending ChannelSPELLUSDT Technical analysis update
SPELL price exceeded the resistance line of a descending channel pattern on the day chart, accompanied by high volume. While this could indicate potential upward movement in the coming days
Buy level: Below $0.00070
Stop loss : $0.00057
Regards
Hexa

SPELLUSDT 1W AnalysisSPELL ~ 1W Analysis
#SPELL This is the lowest support for now. Buy from here if you still have faith in this coin with a short term target of at least 20%+.
SPELLUSDT Forming Bullish Falling WedgeSPELLUSDT is currently exhibiting a bullish falling wedge pattern, a formation that often precedes a significant upward breakout. The price has been gradually compressing between converging trendlines, and recent candles suggest growing bullish pressure near the wedge’s support. With a good volume profile backing this consolidation, the chart structure is lining up for a potential breakout that could yield a projected gain of 90% to 100% in the near term.
Spell Token (SPELL) powers the Abracadabra.money ecosystem, a DeFi lending protocol that allows users to borrow stablecoins using interest-bearing assets as collateral. As DeFi begins to regain traction in the broader crypto market, SPELL is drawing more investor attention due to its utility and role within a growing protocol. This resurgence in investor interest is aligning well with the technical setup, indicating strong potential for bullish price action.
Technically, a breakout from the falling wedge pattern with sustained volume could confirm the bullish reversal. Once the resistance line is breached, it may trigger an impulsive rally with minimal overhead resistance, creating an ideal scenario for swing traders and short-term investors targeting explosive moves. The projected upside from the current pattern breakout points toward levels not seen since previous local highs, reinforcing a bullish narrative.
In summary, SPELLUSDT is showing strong signs of a trend reversal with an ideal bullish chart pattern and healthy volume. The convergence of technical indicators, pattern formation, and growing market interest sets the stage for a potential high-reward setup in the coming weeks.
✅ Show your support by hitting the like button and
✅ Leaving a comment below! (What is You opinion about this Coin)
Your feedback and engagement keep me inspired to share more insightful market analysis with you!

SPELL/USDT Analysis: Long Setup
We previously analyzed this coin for a short setup, which played out well.
Now we’re noticing seller weakness and a failure to push new lows. A local support zone has formed at $0.00065–$0.000598, and we’ve already seen an initial bullish reaction from it.
We are considering a long from this zone or on a false breakout below the local low at $0.000589.
The primary target for the move is $0.000665.
This publication is not financial advice.

SPELLUSD | Long Bias | Watching Key Liquidity Zone | (May 2025)SPELLUSD | Long Bias | Watching Key Liquidity Zone | (May 2025)
1️⃣ Insight Summary:
SPELL is trading at ultra-low levels and sitting below a key value area. Despite concerns about fundamentals and major selling pressure, we're watching for a potential bounce opportunity if liquidity steps in.
2️⃣ Trade Parameters:
Bias: Long (Speculative Play)
Entry: Around $0.00050 or slightly below — deep within value area low
Stop Loss: Below recent wick low to avoid fakeouts
TP1: $0.00083
TP2: $0.000913
Partial Exits: Consider trimming if price shows weakness before TP1
3️⃣ Key Notes:
SPELL is the governance token of the Abracadabra Money platform. While it offers yield-bearing deposits and borrowing via Magic Internet Money (MIM), there are serious doubts about its long-term viability.
There's been a major increase in open interest, with aggressive buyers stepping in — but also heavy spot selling, possibly from insiders or large holders.
Price momentum is weak, and volatility is high. This trade is high risk and based on technical liquidity zones, not fundamental strength.
Keep in mind, if price can reclaim and hold above the value area high, we may see better continuation and chances for compounding positions.
4️⃣ Follow-up Note:
This idea will be updated if SPELL reclaims key levels or shows stronger bullish structure. Otherwise, we stay cautious and patient.
Please LIKE 👍, FOLLOW ✅, SHARE 🙌 and COMMENT ✍ if you enjoy this idea! Also share your ideas and charts in the comments section below! This is best way to keep it relevant, support us, keep the content here free and allow the idea to reach as many people as possible.
Disclaimer: This is not a financial advise. Always conduct your own research. This content may include enhancements made using AI.

SPELL/USDT Analysis – Possible Strong Correction
This asset is completing the formation of a reversal structure.
Above the current price levels, there are strong volume-based sell zones. If a reaction occurs from these zones, a sharp decline may follow, with the potential to reach the current low at $0.00051.
Sell Zones:
$0.00068–$0.000706,
$0.000724–$0.00074.
This publication is not financial advice

SPELL good risk ratio here R:R = 1:3.6Successfully breakout this resistant line with a short -term target of at least +20-50%

SPELLUSDT | Buyers Are Stepping In, Green Box Marks Key SupportVolume and order-flow data show genuine buying interest in SPELLUSDT right now. The green box on our chart highlights a zone where buyers have consistently defended price, making it a reliable area for potential entries.
🟢 Support Zone to Watch
The green box aligns with previous demand levels. When price revisits this area, it often pauses or rebounds as buyers step back in.
A clean bounce off this zone coupled with a higher-low on a 5‑ or 15‑minute chart gives us the confirmation we need.
🔍 Confirmation Criteria
Lower-Time-Frame Structure
Wait for price to form a solid base inside the green box before getting involved.
CDV and Volume
Look for a shift in cumulative delta volume and an uptick in buying volume to validate the move.
🎯 Trade Plan
• Long Entry when the green box holds and confirmation appears on lower time frames.
• Stop Placement just below the green box to keep risk defined.
• Adapt if Price Breaks Down: I will not insist on a long if support fails without a retest. In that case, I’ll step aside and look for the next setup.
This approach helps you trade with confidence rather than guesswork. By waiting for clear signs of buyer strength in the green box, you align yourself with the market’s true intent. Stay patient, watch the signals, and let’s capture the next move together.
📌I keep my charts clean and simple because I believe clarity leads to better decisions.
📌My approach is built on years of experience and a solid track record. I don’t claim to know it all but I’m confident in my ability to spot high-probability setups.
📌If you would like to learn how to use the heatmap, cumulative volume delta and volume footprint techniques that I use below to determine very accurate demand regions, you can send me a private message. I help anyone who wants it completely free of charge.
🔑I have a long list of my proven technique below:
🎯 ZENUSDT.P: Patience & Profitability | %230 Reaction from the Sniper Entry
🐶 DOGEUSDT.P: Next Move
🎨 RENDERUSDT.P: Opportunity of the Month
💎 ETHUSDT.P: Where to Retrace
🟢 BNBUSDT.P: Potential Surge
📊 BTC Dominance: Reaction Zone
🌊 WAVESUSDT.P: Demand Zone Potential
🟣 UNIUSDT.P: Long-Term Trade
🔵 XRPUSDT.P: Entry Zones
🔗 LINKUSDT.P: Follow The River
📈 BTCUSDT.P: Two Key Demand Zones
🟩 POLUSDT: Bullish Momentum
🌟 PENDLEUSDT.P: Where Opportunity Meets Precision
🔥 BTCUSDT.P: Liquidation of Highly Leveraged Longs
🌊 SOLUSDT.P: SOL's Dip - Your Opportunity
🐸 1000PEPEUSDT.P: Prime Bounce Zone Unlocked
🚀 ETHUSDT.P: Set to Explode - Don't Miss This Game Changer
🤖 IQUSDT: Smart Plan
⚡️ PONDUSDT: A Trade Not Taken Is Better Than a Losing One
💼 STMXUSDT: 2 Buying Areas
🐢 TURBOUSDT: Buy Zones and Buyer Presence
🌍 ICPUSDT.P: Massive Upside Potential | Check the Trade Update For Seeing Results
🟠 IDEXUSDT: Spot Buy Area | %26 Profit if You Trade with MSB
📌 USUALUSDT: Buyers Are Active + %70 Profit in Total
🌟 FORTHUSDT: Sniper Entry +%26 Reaction
🐳 QKCUSDT: Sniper Entry +%57 Reaction
📊 BTC.D: Retest of Key Area Highly Likely
📊 XNOUSDT %80 Reaction with a Simple Blue Box!
📊 BELUSDT Amazing %120 Reaction!
I stopped adding to the list because it's kinda tiring to add 5-10 charts in every move but you can check my profile and see that it goes on..

$SPELL/USDT Breakout Alert!🚀 $SPELL/USDT Breakout Alert!
SPELL has broken out of a symmetrical triangle on the 4h chart, confirming a strong bullish move!
• Entry: CMP
• TP: 0.0008612
• SL: 0.0005143 for risk management.
Momentum looks after consolidation — eyes on continuation if volume stays strong!
DYOR, NFA

SPELLUSDT 1WSPELL ~ 1W Analysis
#SPELL Buy gradually from here if you still have a Conviction on this coin with a short -term target of at least 15%+.

SPELL/USDTHello friends
Given the strong support of the price, you can buy within the specified ranges with capital and risk management.
Price targets are also specified...
*Trade safely with us*
SPELLUSDT 1WSPELL ~ 1W Analysis
#SPELL Buy gradually from here if you still have a Conviction on this coin with a short -term target of at least 20%+.
SPELL LONG SETUP ALL trading ideas have entry point + stop loss + take profit + Risk level.
hello Traders, here is the full analysis for this pair, let me know in the comment section below if you have any questions, the entry will be taken only if all rules of the strategies will be satisfied. I suggest you keep this pair on your watchlist and see if the rules of your strategy are satisfied. Please also refer to the Important Risk Notice linked below.
Disclaimer
SPELL LONG SETUP
ENTRY : 0.0006140
PROFIT : 0.0009537
STOP : 0.0005156

Bullish opportunity in SPELLPrice has cleared major sellside
We have price reacting off the entry pd array as the large FVG
We have price creating a CISD plus CISD OB+
We have draw on liquidity as the wick at 50% fib and 62% fib OB+ a the final draw

#SPELLUSDT continuation of the downtrend📉 SHORT BYBIT:SPELLUSDT.P from $0.0009866
🛡 Stop Loss: $0.0010430
⏱ 1H Timeframe
✅ Overview:
➡️ BYBIT:SPELLUSDT.P remains in a downtrend, forming lower highs and lower lows. The price failed to hold above $0.0010000, signaling weak buying momentum.
➡️ POC at $0.0010250 suggests that major volume accumulation is above the current price, reinforcing the bearish outlook.
➡️ If the price stays below $0.0009866, a continuation towards $0.0009485 and $0.0008901 is expected.
➡️ Volume remains moderate, indicating declining demand and a likely continuation of the downtrend.
⚡ Plan:
📉 Bearish Scenario:
➡️ Enter SHORT from $0.0009866 if price confirms rejection at resistance.
➡️ Risk management with Stop-Loss at $0.0010430, above key resistance.
🎯 TP Targets:
💎 TP1: $0.0009485 — first profit-taking level.
🔥 TP2: $0.0008901 — major support zone.
🚀 BYBIT:SPELLUSDT.P Expecting a continuation of the downtrend!
📢 BYBIT:SPELLUSDT.P remains under selling pressure. If the price holds below $0.0009866, further downside movement towards $0.0009485 and then $0.0008901 is expected.
📢 However, if the price reclaims $0.0010430, the bearish scenario could be invalidated, leading to a potential upward correction.
