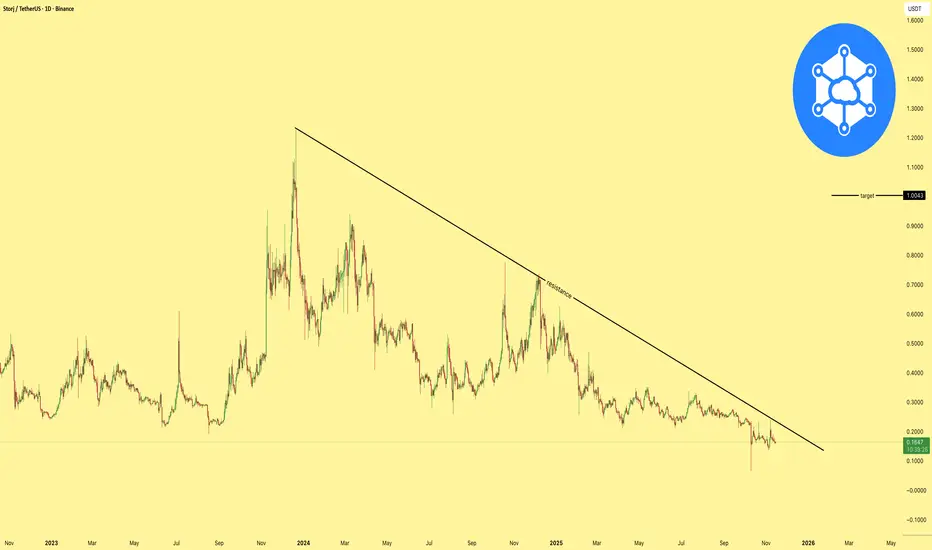
STORJCRYPTOCAP:STORJ has a clean setup forming, and once it breaks the diagonal resistance line there is a potential 500 percent gain from the current price. The structure is tight, momentum is building, and this breakout could be explosive.
STORJ LOOKS BULLISH LIKE ICPSTORAGE Coins are bullish, Keep an eye on them and use proper risk management. This Narrative Looks strong with bullish Technicals

STORJUSDT 1D#STORJ has spiked to the long-term descending resistance with strong volume on the daily chart, but has faced a rejection for now. Keep an eye on it — it looks promising. Consider buying only after a solid breakout. In that case, the potential targets are:
🎯 $0.2601
🎯 $0.2922
🎯 $0.3242
🎯 $0.3697
🎯

Storj end of cicleEnd of cicle for Storj, 100% of wave 1 done, 5 waves completed. Price at -90% discount
3PML 3PWL 3PDL

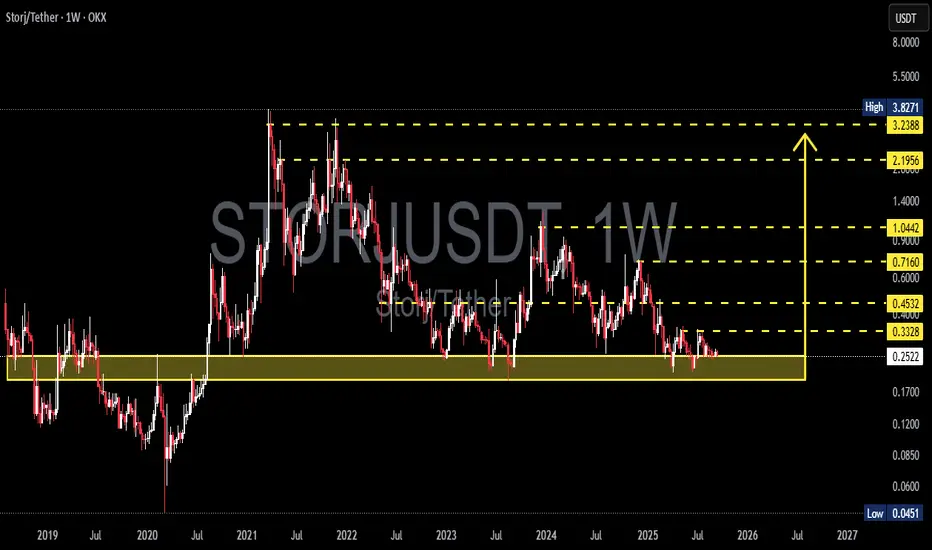
STORJ/USDT — Decisive Zone: Reversal or Breakdown?Current Situation:
STORJ/USDT is trading around 0.2523 USDT, sitting right on top of a multi-year support zone (0.17 – 0.33 USDT).
This is not just any technical level—it has acted as a foundation for price action multiple times since 2019.
Every dip into this zone has historically triggered demand
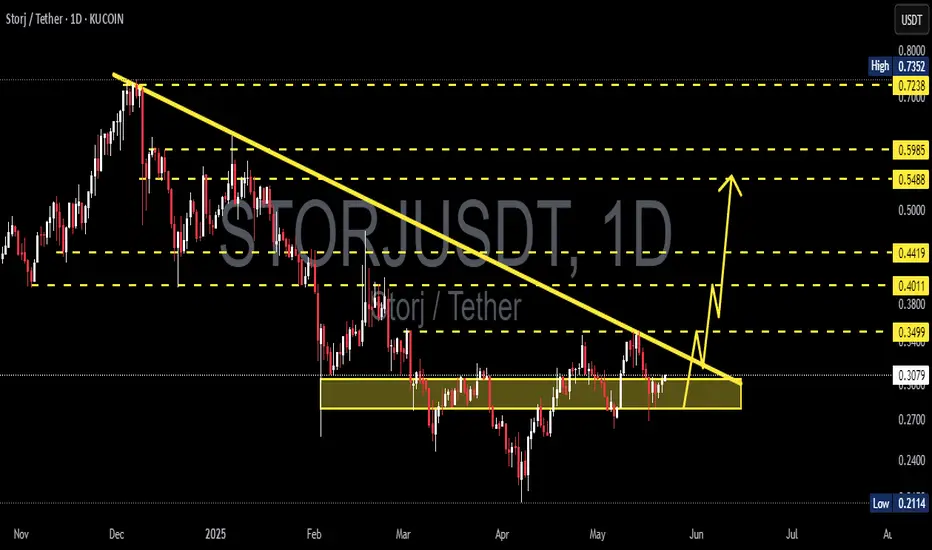
storjusdt buy opportunitySTORJUSDT is forming a classic double bottom within a symmetrical triangle structure. Price is currently reacting from the highlighted accumulation zone, which aligns with a strong demand area. The immediate objective is a move toward $0.525, the triangle’s upper boundary, where minor rejection is a

STORJ/ USDT - SHORT SET-UP 📊 Key Technical Insights
1. Price Structure
Price recently rejected near 0.2550–0.2575 zone (supply/resistance).
Lower highs forming, indicating bearish market structure.
Current price (~0.2444) is just under minor resistance, which may confirm the start of a new leg down.
2. Risk-Reward Ratio

STORJUSDT 1W Analysis STORJ ~ 1W Analysis
#STORJ This is the closest support for now. Buy if you still have confidence in this coin with a short term target of at least 20%+ from this support.

$STORJ – Testing Descending Trendline Support📊 GATEIO:STORJUSDT.P STORJ is testing the descending trendline support on the daily timeframe, and it’s holding firm for now.
⚠️ This level is crucial — will it act as a springboard for a bullish reversal or let the bears take over?
👀 Watch price action closely for clues!

STORJUSDT 1D AnalysisSTORJ ~ 1D Analysis
#STORJ Buy gradually from here if you still have confidence in this coin with a short term target of at least 10%++
See all ideas
Summarizing what the indicators are suggesting.
Oscillators
Neutral
SellBuy
Strong sellStrong buy
Strong sellSellNeutralBuyStrong buy
Oscillators
Neutral
SellBuy
Strong sellStrong buy
Strong sellSellNeutralBuyStrong buy
Summary
Neutral
SellBuy
Strong sellStrong buy
Strong sellSellNeutralBuyStrong buy
Summary
Neutral
SellBuy
Strong sellStrong buy
Strong sellSellNeutralBuyStrong buy
Summary
Neutral
SellBuy
Strong sellStrong buy
Strong sellSellNeutralBuyStrong buy
Moving Averages
Neutral
SellBuy
Strong sellStrong buy
Strong sellSellNeutralBuyStrong buy
Moving Averages
Neutral
SellBuy
Strong sellStrong buy
Strong sellSellNeutralBuyStrong buy
Displays a symbol's price movements over previous years to identify recurring trends.