TNSRUSDT Forming Falling WedgeTNSRUSDT is forming a clear falling wedge pattern, a classic bullish reversal signal that often indicates an upcoming breakout. The price has been consolidating within a narrowing range, suggesting that selling pressure is weakening while buyers are beginning to regain control. With consistent volum

$TNSR is ready to flyTNSR’s surge reflects a mix of strategic tokenomics (supply burn), technical momentum, and speculative trading—not fundamental growth. While bullish signals persist, the disconnect from platform usage and reliance on whale activity heighten downside risks.

TNSRWaiting for this breakout on $TNSR. The structure is tightening and momentum is starting to shift. Target is $0.30, which offers a potential 105 percent gain from the current price once the breakout confirms.

Time to fly)Pennant Pattern(Pennant Pattern :
According to the flag pattern, there is a possibility of an increase soon.
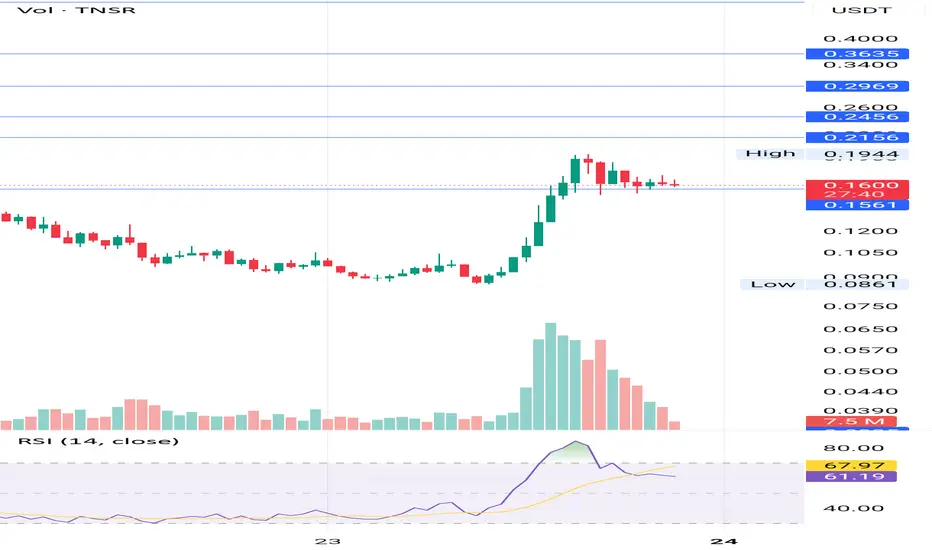
TNSRUSDT UPDATE#TNSR
UPDATE
TNSR Technical Setup
Pattern: Falling Wedge Pattern
Current Price: $0.27
Target Price: $0.43
Target % Gain: 60.00%
Technical Analysis: TNSR has broken out of a falling wedge pattern on the 1D chart, signaling bullish momentum. The price has surged strongly from the wedge’s lower bo

TNSRUSDT Forming Falling WedgeTNSR/USDT is forming a well-defined falling wedge pattern, which often signals that a strong bullish reversal is in the works. The price action is compressing — lows are holding steady while highs are gradually being pushed lower — and volume is starting to pick up, suggesting that buyers may be acc

Scalp SHORT – TNSR🐻 Scalp SHORT – TNSR
TNSR is exhibiting extreme overbought conditions across all timeframes, with a strong bearish divergence on the 15m chart, signaling clear buyer exhaustion. This combination of weakening momentum and excessively high pricing often precedes a sharp and rapid downside move.
🎯 Tr

TNSR READY FOR A MASSIVE REVERSALTNSR Technicals Looks Very Bullish at the moment and it looks highly oversold on HTF, signaling Oversold Technical Rebound. Such Technical Confirmations typically validate price reversals, suggesting strong buyer conviction rather than a dead-cat bounce. Use Proper Risk Management

TNSR Tensor $0.07 just saw on Bloomberg NFT season comingopen seas guested on Bloomberg and made a clear case
that like ai or meme even defi when season is about to come
projects go to nuts level such as tyhis one
NFT could be a great come back and SOLANAs Tensor which Anatloy sits on board is on the move
NFA NFA not financial advice
just puting in $

long TNSR/USDT.ptensor about to go higher, it made a H&S pattern, the recent rise it left a small consolidation. currently its trading back to that. the point of controll of that small range is imo good for a long entry to around 0.1114 or even higher. trade safe, cheers

See all ideas
Summarizing what the indicators are suggesting.
Oscillators
Neutral
SellBuy
Strong sellStrong buy
Strong sellSellNeutralBuyStrong buy
Oscillators
Neutral
SellBuy
Strong sellStrong buy
Strong sellSellNeutralBuyStrong buy
Summary
Neutral
SellBuy
Strong sellStrong buy
Strong sellSellNeutralBuyStrong buy
Summary
Neutral
SellBuy
Strong sellStrong buy
Strong sellSellNeutralBuyStrong buy
Summary
Neutral
SellBuy
Strong sellStrong buy
Strong sellSellNeutralBuyStrong buy
Moving Averages
Neutral
SellBuy
Strong sellStrong buy
Strong sellSellNeutralBuyStrong buy
Moving Averages
Neutral
SellBuy
Strong sellStrong buy
Strong sellSellNeutralBuyStrong buy
Displays a symbol's price movements over previous years to identify recurring trends.