TRBUSDT 1D#TRB has been moving inside a descending channel on the daily chart for a long time. Time to move up! In case of a breakout above the channel and the daily SMA100, the potential targets are:
🎯 $31.29
🎯 $38.28
🎯 $43.93
🎯 $49.58
🎯 $57.62
🎯 $67.86
⚠️ Always remember to use a tight stop-loss and maint

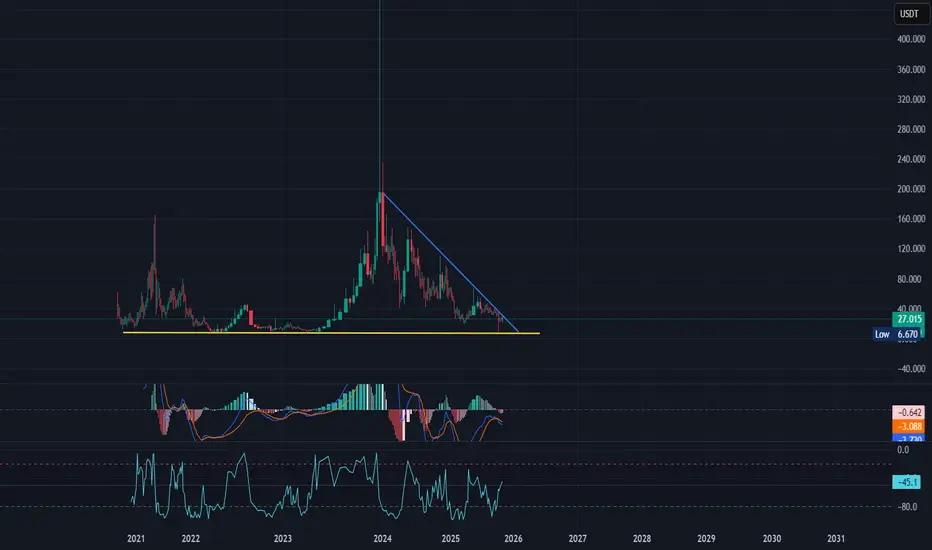
TRB Squeezing Into a Tight RangeLSE:TRB is holding above a key support zone while trading under a long-term downtrend line.
Price is stuck in a narrow consolidation, suggesting a bigger move is building.
A breakout from this range will likely decide the next direction.
DYOR, NFA
Please hit the like button if you like it, and s

TRBUSDT Forming Bullish Reversal TRB/USDT is setting up a potentially bullish reversal scenario, with price action forming a falling wedge pattern that suggests compression followed by an uplift. The pair has seen tightening price swings, several rejections of the lower trendline, and increasing volume, which indicates accumulatio

TRBTrb, looks like it is going to make a very sharp move and this it will hit in just matter of time
Targets to hit, 40$ the 1st one 65$ the second one and then lets see where it will stop.
nfa
dyor
TRBUSDT 1D#TRB is currently trading within a descending channel on the daily chart. In case of a breakout above the daily SMA50 and the channel resistance, the potential upside targets are:
🎯 $31.29
🎯 $38.28
🎯 $43.93
🎯 $49.58
🎯 $57.62
🎯 $67.86
⚠️ Always remember to use a tight stop-loss and maintain proper

TRB - PRICE UPDATE:LSE:TRB - price analysis:
Neutral area & tricky price action H4, strong rejection.
Price seems to be stuck inside a weekly falling wedge structure!
This can be a bullish retest of the pattern if the 26.00$ support zone hold 📈
26.00 - 26.10$ is key to hold here, otherwise, price might fall agai

#TRB/USDT About to Explode or Fake Out Everyone Again ?#TRB
The price is moving within a descending channel on the 1-hour frame, adhering well to it, and is heading for a strong breakout and retest.
We have a bearish trend on the RSI indicator that is about to be broken and retested, which supports the upward breakout.
There is a major support area i

TRBUSDT 1D#TRB is moving inside a falling wedge pattern on the daily chart. We can be bullish if it manages to hold the support zone and break above the wedge resistance and the daily SMA200. In that case, the potential targets are:
🎯 $37.02
🎯 $41.48
🎯 $45.08
🎯 $48.68
🎯 $53.81
🎯 $60.35
⚠️ Always remember to

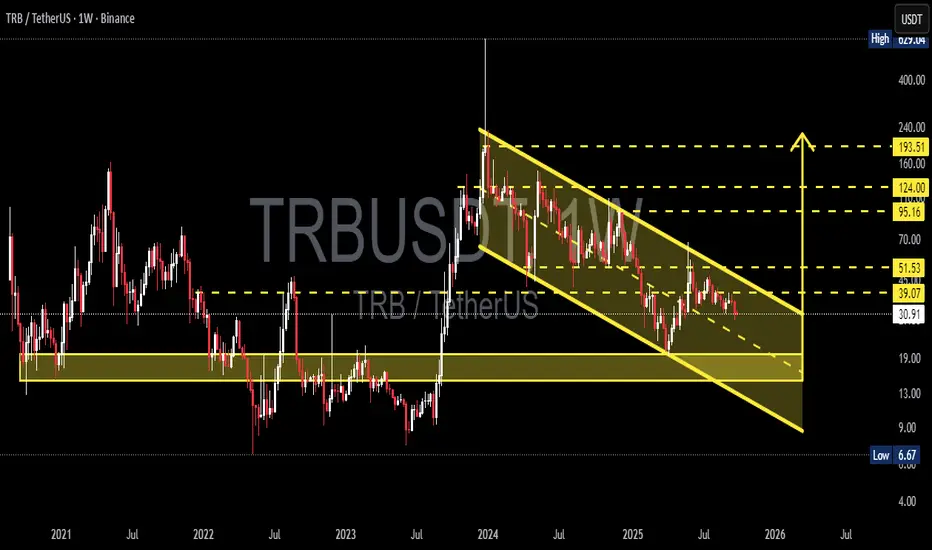
TRB/USDT — Breakout Toward 124 or Breakdown to 13?TRB (Tellor) is now entering a crucial phase. After the massive rally in 2024, the market has pushed TRB into a structured correction forming a clear descending channel on the weekly timeframe. This chart reflects the ongoing battle between long-term accumulation and medium-term selling pressure.
-
TRBUSDT 1D#TRB has formed a falling wedge pattern on the daily chart. If it breaks out above the wedge resistance and the daily SMA50, the targets are:
🎯 $43.52
🎯 $47.79
🎯 $52.05
🎯 $57.32
🎯 $65.84
⚠️ Always remember to use a tight stop-loss and follow proper risk management.

See all ideas
Summarizing what the indicators are suggesting.
Oscillators
Neutral
SellBuy
Strong sellStrong buy
Strong sellSellNeutralBuyStrong buy
Oscillators
Neutral
SellBuy
Strong sellStrong buy
Strong sellSellNeutralBuyStrong buy
Summary
Neutral
SellBuy
Strong sellStrong buy
Strong sellSellNeutralBuyStrong buy
Summary
Neutral
SellBuy
Strong sellStrong buy
Strong sellSellNeutralBuyStrong buy
Summary
Neutral
SellBuy
Strong sellStrong buy
Strong sellSellNeutralBuyStrong buy
Moving Averages
Neutral
SellBuy
Strong sellStrong buy
Strong sellSellNeutralBuyStrong buy
Moving Averages
Neutral
SellBuy
Strong sellStrong buy
Strong sellSellNeutralBuyStrong buy
Displays a symbol's price movements over previous years to identify recurring trends.