#XTZUSDT 1D#XTZ is moving inside a descending channel on the daily timeframe and is currently sitting on the support zone. For the bullish scenario, it must bounce from this zone with strong volume. Do not enter here yet — volume is weak, and the RSI suggests there is still room for further downside. If a successful bounce occurs, we can look for the following short-term targets:
🎯 $0.5746
🎯 $0.6305
And if price breaks above the channel resistance, the next upside targets are:
🎯 $0.6892
🎯 $0.7404
🎯 $0.8132
🎯 $0.9061
❌ Invalidation: a daily candle closing below the channel support.
⚠️ Always remember to use a tight stop-loss and maintain proper risk management.
Market insights

Algotrading XTZUSDTPress "Grab this chart", run strategy tester for entire history and make sure that is good time for a long to yellow line

XTZ USDT LONG SIGNAL---
📢 Trade Idea: XTZ/USDT
Type: Long
Entry Zone: 0.579 – 0.590
🎯 Take-Profit Targets (Partial Exits):
• TP1 = 0.604
• TP2 = 0.616
• TP3 = 0.626
• TP4 = 0.637
• TP5 = 0.665
🛑 Stop-Loss: 0.568
⏱ Timeframe: 1H
⚖️ Risk/Reward Ratio: 2.86
💥 Suggested Leverage: 5x – 10x
---
🧠 Technical Analysis Summary:
XTZ is showing a potential bullish reversal from the 0.57–0.58 accumulation zone, supported by higher lows and a tightening price range.
A confirmed breakout above 0.60 may trigger upward continuation toward 0.63–0.66 resistance levels.
RSI has recovered from the oversold area, and the 20 EMA is flattening, indicating a possible momentum shift in favor of buyers.
---
⚙️ Trade Management Tips:
• Take partial profits at TP1, and move SL to entry once reached.
• For higher targets (TP3–TP5), consider trailing stop-loss to secure profits.
• Avoid re-entry if price closes below 0.568 on 1H.
---
⚠️ Disclaimer:
This setup is for educational purposes only and not financial advice.
Always DYOR and manage your capital responsibly.
---
📌 Hashtags for TradingView:
#XTZUSDT #CryptoSignal #LongSetup #TechnicalAnalysis #CryptoTrading #TradingViewIdeas #Tezos
--

XTZ USDT LONG SIGNAL---
📢 Signal Alert
🔹 Pair: XTZ / USDT
📈 Trade Type: Long
💰 Entry: Market Price
🎯 Take-Profit Targets (Partial Management):
▫️ TP1 = 0.626
▫️ TP2 = 0.653
▫️ TP3 = 0.680
🛑 Stop-Loss: 0.600
📊 Timeframe: 1H
⚖️ Risk/Reward Ratio: 6.0
📌 Suggested Leverage: 5x – 10x
⚠️ Capital management is mandatory.
💬 Please review the chart before entering the trade.
---
🧠 Technical Analysis Summary:
XTZ is forming a bullish reversal pattern from the 0.60–0.61 support area.
Momentum is strengthening with higher lows and rising volume, indicating potential for upward continuation.
If price sustains above 0.620, a push toward 0.653–0.680 is expected.
RSI confirms recovery from the oversold zone, and EMA 20 crossover suggests a short-term bullish trend.
---
⚙️ Trade Management Tip:
• Take partial profit at TP1, move SL to entry once price holds above 0.63.
• Trail your stop for TP2–TP3 to secure profits.
• Avoid re-entry if price drops below 0.600.
---
⚠️ Disclaimer:
This analysis is for educational purposes only and not financial advice.
Always DYOR (Do Your Own Research) and apply proper risk management.
---

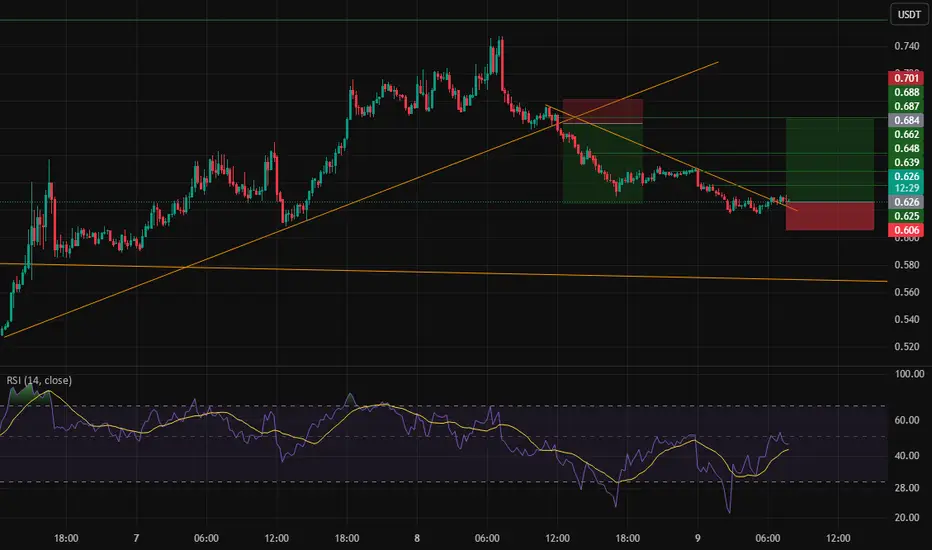
XTZ USDT LONG SIGNAL ---
📢 Signal Alert
🔹 Pair: XTZ / USDT
📈 Trade Type: Long
💰 Entry: 0.626
🎯 Take-Profit Targets (Partial Management):
▫️ TP1 = 0.639
▫️ TP2 = 0.648
▫️ TP3 = 0.662
▫️ TP4 = 0.683
🛑 Stop-Loss: 0.605
📊 Timeframe: 1H
⚖️ Risk/Reward Ratio: 5.73
📌 Suggested Leverage: 5x – 10x
⚠️ Capital management is mandatory.
💬 Please review the chart before entering the trade.
---
🧠 Technical Analysis Summary:
XTZ is currently rebounding from a strong support level near 0.615, forming a bullish reversal pattern on lower timeframes.
A clean breakout above 0.630 would confirm bullish continuation toward 0.648 – 0.683.
The RSI has crossed above 50, showing renewed bullish momentum, and MACD is forming a positive crossover.
Stop-loss is placed just below the latest swing low to protect against volatility.
---
⚙️ Trade Management Tip:
Take partial profit at TP1, then move stop-loss to breakeven.
Let the rest of the position run toward TP3–TP4 if momentum continues.
Avoid entering before confirmation candle close above 0.628.
---
⚠️ Disclaimer:
This signal is for educational purposes only and not financial advice.
Always DYOR (Do Your Own Research) and use proper risk management before trading.
---
XTZ USDT SHORT SIGNAL---
📢 Signal Alert
🔹 Pair: XTZ / USDT
📉 Trade Type: Short
💰 Entry Zone: 0.790 – 0.845
🎯 Take-Profit Targets:
TP1 = 0.759
TP2 = 0.695
TP3 = 0.625
🛑 Stop-Loss: 0.846
📊 Timeframe: 1H
⚖️ Risk/Reward Ratio: 3.0
📌 Suggested Leverage: 3x – 5x
⚠️ Capital management is mandatory.
Please analyze the chart carefully before entering the trade.
---
🧠 Technical Analysis Summary:
XTZ is showing clear bearish pressure after rejecting the 0.84–0.85 resistance zone, which previously acted as a strong supply area.
Price action confirms a lower-high structure with bearish candles gaining strength.
🔸 Key Observations:
RSI has crossed below 50, supporting bearish continuation.
Volume is increasing on red candles, showing strong seller dominance.
EMA alignment favors short positions, confirming downside momentum.
First target (0.759) aligns with short-term support; deeper targets (0.695–0.625) match major daily demand zones.
Stop-loss is placed safely above recent liquidity highs to avoid false breakouts.
---
⚙️ Trade Management Tip:
Once TP1 is reached, move SL to Entry and take partial profit to secure gains.
Let the rest ride toward TP2–TP3 for extended profits.
---
⚠️ Disclaimer:
This analysis is for educational and informational purposes only and not financial advice.
Always Do Your Own Research (DYOR) and use proper risk management before entering any trade.
---

XTZUSDT Forming Falling WedgeXTZUSDT is forming a clear falling wedge pattern, a classic bullish reversal signal that often indicates an upcoming breakout. The price has been consolidating within a narrowing range around $0.65 USDT, suggesting that selling pressure is weakening while buyers are beginning to regain control amid a recent 20% surge to multi-week highs. With consistent volume confirming accumulation at lower levels exceeding $180 million daily, the setup hints at a potential bullish breakout soon. The projected move could lead to an impressive gain of 90% to 100%+ once the price breaks above the wedge resistance, igniting interest in XTZUSDT price prediction for Tezos enthusiasts.
This falling wedge pattern is typically seen at the end of downtrends or corrective phases, and it represents a potential shift in market sentiment from bearish to bullish. Traders closely watching XTZUSDT are noting the strengthening momentum as it nears a breakout zone near $0.70, fueled by Etherlink L2 launches and RWA tokenization momentum. The good trading volume adds confidence to this pattern, showing that market participants are positioning early in anticipation of a reversal in this self-amending layer 1 blockchain token.
Investors’ growing interest in XTZUSDT reflects rising confidence in the project’s long-term fundamentals and current technical strength, especially with integrations like Google cloud credits for builders and European asset expansions. If the breakout confirms with sustained volume, this could mark the start of a fresh bullish leg. Traders might find this a valuable setup for medium-term gains, especially as the wedge pattern completes and buying momentum accelerates in falling wedge breakout crypto plays.
✅ Show your support by hitting the like button and ✅ Leaving a comment below! (What is You opinion about this Coin) Your feedback and engagement keep me inspired to share more insightful market analysis with you!

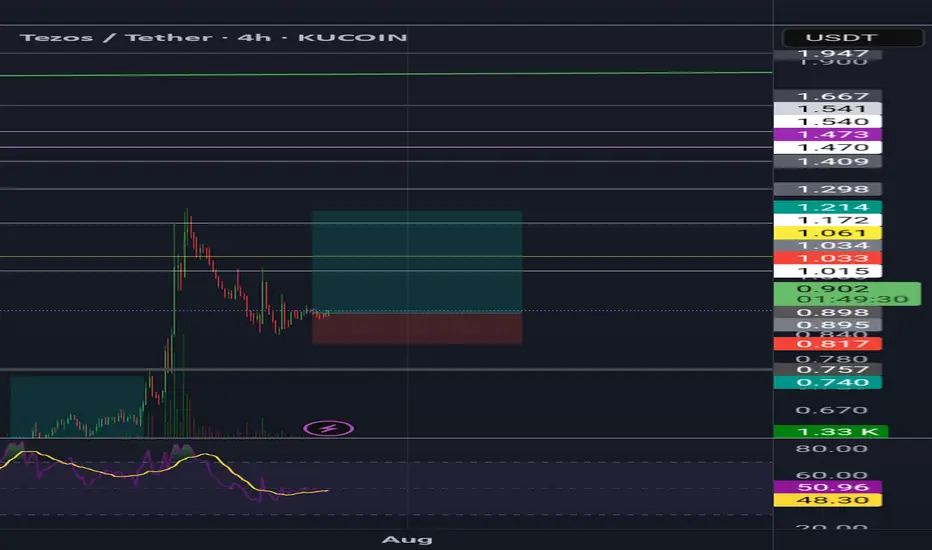
BUY TEZOS NOWWBased on the XTZ/USDT 30-minute chart using Heikin Ashi candles:
• Current Price: The price is around $0.5636 (as of 20:49 on November 06, 2025).
• Support Zone: The chart shows a strong support area around $0.5252. The price has touched and held firm above this level in recent days, showing consolidation in this region, which indicates buying pressure is starting to emerge and preventing the price from dropping lower.
• Trade Setup:
• Entry: Currently around the market price, approximately $0.5636.
• Stop Loss: Placed below the nearest support zone, around $0.5252 (or slightly lower to avoid wick-hunts).
• Take Profit: A relatively distant target, around $1.0762 (based on the peak level drawn on the chart).
• Candlestick Signal: Using Heikin Ashi candles, small green candles are starting to appear after a period of red accumulation, which is an early sign of a reversal or at least an impending upward move.
• Risk/Reward Ratio (R:R): With Risk: $0.5636 - $0.5252 = $0.0384 and Reward: $1.0762 - $0.5636 = $0.5126. The R:R ratio is $0.5126 / $0.0384 \approx 13.3:1. This is an extremely attractive ratio, suggesting that a successful trade could yield massive profits relative to the risk.

XTZ/USDT A Pattern of Strength in Market Weakness📍 The chart is forming a Livermore-style expanding wedge —
a structure where each price swing grows wider, and volatility increases.
📌 The current zone may be a key turning point for the trend.

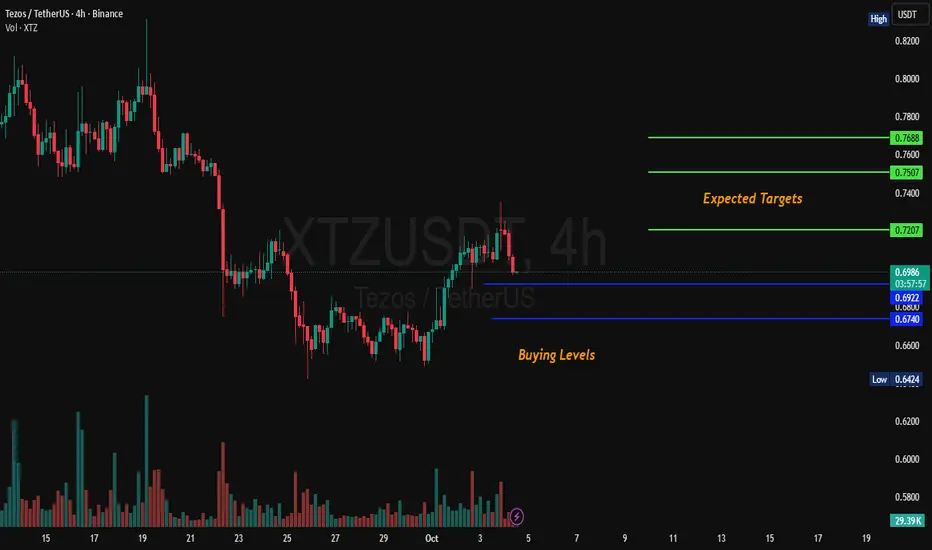
XTZ 4H Analysis XTZ Has started upward momentum. Key buying area are marked as 0.682 & 0.675. Possible targets are also given on the chart. NFA DYOR
Long trade 📘 Trade Journal Entry
Pair: XTZ/USDT
Date: Sun 5th Oct 25
Time: 4.30 pm
Session: NY to Tokyo Session AM
Direction: Buyside Trade
Timeframe: 30m
🔹 Trade Details
Entry: 0.7112
Profit Target: 0.8328 (+17.10%)
Stop Loss: 0.6933 (–2.52%)
Risk-Reward Ratio (RR): 6.79
🔹 Technical Context
Structure: Price confirmed a bullish continuation following a completed reaccumulation phase.
Confluences:
Strong FVG mitigation at 0.71 region signalling re-entry for continuation leg.
EMA/WMA alignment sustaining bullish momentum through NY close into Tokyo open.
RSI maintains midline support, indicating momentum retention without exhaustion.
Volume maintained steady during transition, validating liquidity handover between sessions.
Stop placement: Below the structural demand and FVG boundary at 0.6933.
30min TF overview
Targeting: 0.8328 — a premium-level inefficiency and prior liquidity zone aligned with a higher timeframe target.
🔹 Trade Narrative
The XTZ/USDT pair demonstrated strong inter-session continuity with demand sustaining through the NY close into Tokyo AM. The trade capitalised on institutional re-entry after accumulation, with price breaking cleanly from the 0.71 zone toward the 0.83 target.

Tezos long to $0.801 todayI entered this tezos position last night/early morning. Just scale in a while ago and adjusted sl to $0.7770
tp is $0.8010
Anticipating a continuation push to the upside soon. Setup also is in confluence with an inverse head and shoulder pattern

XTZ Secondary Trend. Channel. Wedge. Capitulation Zone. 07 05 20Logarithm. Time frame 1 week (less is not necessary).
The secondary trend has formed a horizontal channel for several years, with repeating wedge-shaped formations, the third time we entered under the support of this channel not by squeezes to collect long stop-loss, but by full candles and the structure of a descending wedge. It looks more vertical. The corrective movement to this semi-vertical wedge, quite possibly, will similarly have an aggressive character. The wedge is almost in the final phase of its formation. I showed percentages for clarity to the key reversal zones, for orientation for your money management and setting the first medium-term, and possibly local targets.
The main trend of this previously hyped cryptocurrency since 2017
XTZ/USD Main Trend. Descending Channel 01 2023

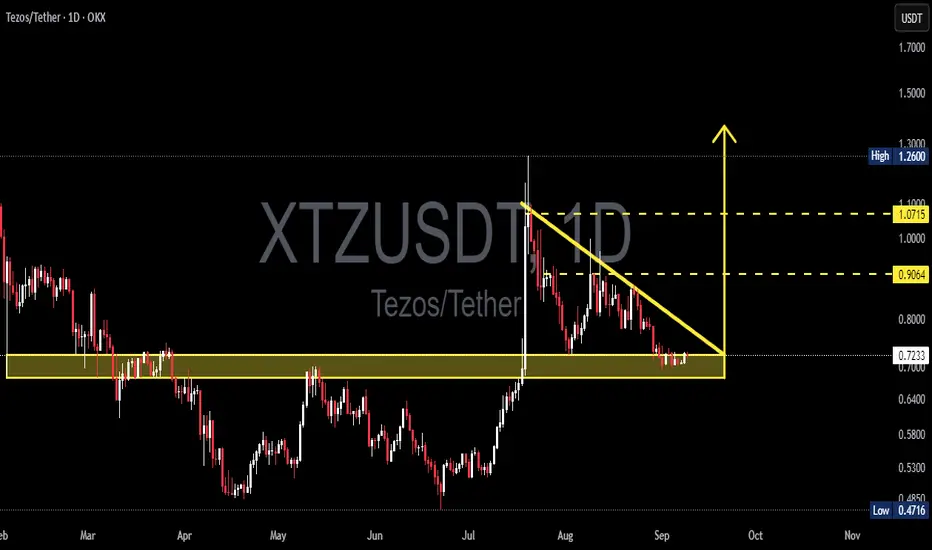
XTZ/USDT — Descending Triangle at a Critical Zone!Tezos (XTZ/USDT) is currently trading at a decision point. The chart shows a clear Descending Triangle pattern formed since late August, with price consolidating right above the major support zone at 0.64 – 0.74 USDT.
This structure is generally considered bearish, as consistent lower highs indicate selling pressure against a static demand zone. However, a confirmed breakout above the downtrend line could flip the pattern into a bullish reversal trigger.
---
🔑 Key Levels
Current Price: 0.7234 USDT
Major Support Zone: 0.64 – 0.74 USDT
Dynamic Resistance (downtrend line): ~0.78 – 0.82 USDT
Bullish Targets: 0.9064 → 1.0715 → 1.2600 USDT
Bearish Targets: 0.4716 (previous low), with a potential measured move down to ~0.37 USDT
---
🐂 Bullish Scenario (Reversal Potential)
Breakout above 0.78 – 0.82 with strong volume confirmation signals a bullish reversal.
First upside target at 0.9064, then 1.0715, and potentially 1.2600 if momentum continues.
Strategy: Buy on breakout or take aggressive entries near support with tight stops below 0.64.
Reward-to-Risk (R:R) ratio ≈ 2:1 if targeting 0.90.
---
🐻 Bearish Scenario (Breakdown Risk)
Breakdown below 0.64 – 0.70 with strong volume would confirm the descending triangle as bearish.
Downside targets: 0.4716 (structural support) and potentially 0.37 USDT (measured move).
Strategy: Short/hedge after confirmed breakdown and failed retest.
Potential R:R > 2.4:1 toward 0.37.
---
📌 Pattern Context
The Descending Triangle reflects market indecision: persistent sellers vs. defending buyers.
Such setups often end with a strong move, making this area a crucial inflection zone.
Volume will be the key confirmation factor — without it, false breakouts are highly likely.
XTZ is essentially in a “wait-and-see” equilibrium before its next decisive trend.
---
⚖️ Conclusion
XTZ is standing at a major turning point:
Bullish case: breakout could lift price toward 0.90 – 1.07.
Bearish case: breakdown may trigger a drop to 0.47 – 0.37.
Traders should wait for a daily close + volume confirmation before committing. This is a high-opportunity setup once direction is confirmed.
---
#XTZ #Tezos #XTZUSDT #Crypto #Altcoins #TechnicalAnalysis #PriceAction #ChartPatterns #SwingTrading

Is #XTZ Ready For a Major Breakout or Another Trap Ahead?Yello Paradisers! Are you prepared for what might be one of the sneakiest reversals brewing quietly on #XTZUSDT? Let's see the current setup of #Tezos:
💎#XTZ is trying to break out of a descending broadening wedge formation, a setup that typically signals the end of a corrective structure and the potential beginning of a major impulsive move. We’re likely witnessing the very first wave of this new impulse, and what happens next will depend entirely on how the price reacts to the overhead dynamic resistance.
💎The 1st impulsive wave appears to be nearing completion, and based on structure and current momentum, a minor pullback is both expected and healthy. This retracement will likely serve as a reset before the next leg higher begins, offering a potential entry for those who missed the breakout. However, we do not expect this correction to break below the origin of the first wave — doing so would undermine the integrity of the new trend.
💎Currently, the #XTZUSD is facing strong resistance from the EMA, which it must convincingly break and reclaim. This EMA level has repeatedly acted as a lid on price action, and until it’s cleared, any upside move remains tentative. However, if buyers step in with real volume, we could see a rapid acceleration toward the mid-term resistance at $0.916. That level has historically marked a shift in market control. And beyond it, the next major resistance lies at $1.134, a key supply zone that could trigger heavy distribution.
💎On the downside, the structure remains clean. The $0.491 – $0.516 zone is now our major support, and it must hold. If the price falls below this support and closes with weakness, it will invalidate the current bullish thesis and likely lead to a deeper correction.
Play it safe, respect the structure, and let the market come to you!
MyCryptoParadise
iFeel the success🌴

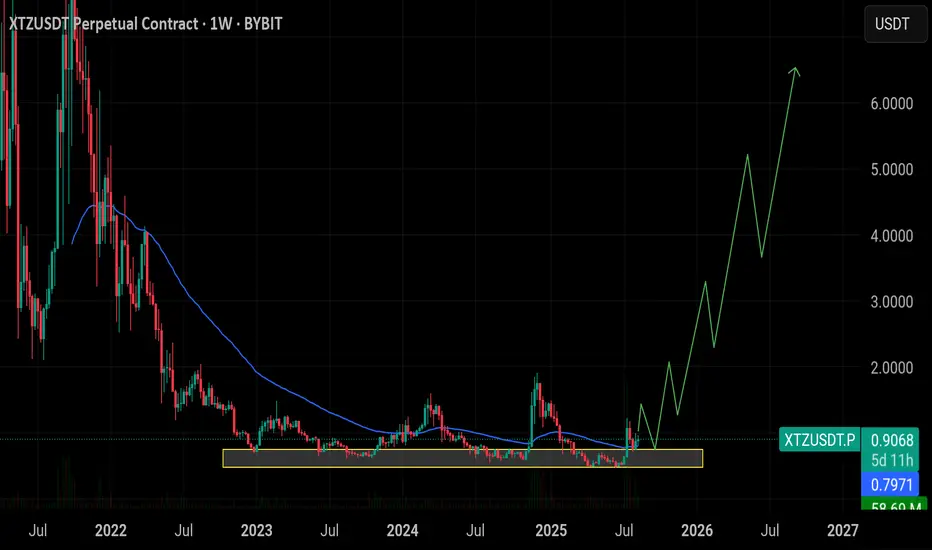
$XTZ Long-Term Accumulation AnalysisSEED_DONKEYDAN_MARKET_CAP:XTZ Long-Term Accumulation Analysis
🔸XTZ has been consolidating in a major accumulation zone between $0.50 – $0.76 for a long period, showing strong demand at lower levels. Current price is above this range, suggesting patience is needed for the bulk of entries — but partial exposure can be taken now to avoid missing upside.
🔸 Smart Entry Zone:
Primary accumulation entries remain between $0.50 – $0.76. Wait for a pullback into this range to add larger positions, but consider adding a small position at the current price to catch any early moves.
🔸 Upside Target: $6.00+
Once accumulation resolves, historical patterns point toward a potential rally to $3.00, $4.20, and eventually $6.00+.
🔸 Risk Level at $0.48:
A sustained break below $0.48 would invalidate the accumulation structure.
🔸 Outlook:
Add a light position now at 0.90 and , then wait for price to revisit the $0.50 – $0.76 zone before building the core position. Hold for long-term upside.
TezosXTZ usdt daily analysis
Time frame 4hourls
Risk rewards ratio >4
Target 1.124$
LS is very tight
If my analysis failed l will lost a few but if it reaches my target good benefit
Linear Tezos · 2,000% 2025 Bull MarketThe same support zone from 2019, pre-massive 2021 bull market, is being activated ultra long-term, since November 2022. That is, XTZUSDT (Tezos) has been trading at bottom prices for almost three years.
Just a month within the current price range managed to support a 1,111%+ bull market, one that lasted 714 days. Who is to say that the next bull market will only last 2 months? I saw one of the top authors here saying that everything would end after just 1-2 months. Why not 2-3 years?
So Tezos grew for 714 days, higher highs and higher lows, a classic uptrend. Then it entered a bear market and went down for more than a year. So years going up and more than a year going down. And then the market went sideways for almost three years. Notice how everything last years. One year or more.
This chart and much more I've been seeing is letting me believe that we are set to experience an ultra, unusual, splendid, unique and long lasting bull market. It will be different. It will be the same in the sense that it happens every 4 years and we have massive marketwide growth. It will be different because some pairs will grow for months while others will continue to grow non-stop for a decade or more. Some pairs will grow for 2 years and then crash while others will grow 3 or 4. It is a mixed bag. It is a big market and it continues to evolve. This is awesome news, don't get it confused. This is the best possible news ever. We are used to fast and this gives little time for adaptation. Market conditions are different now. You will have all the time you need to become rich. The bull market is being turned on and it will never be turned off again, at least not for our generation.
Thank you for reading.
Tezos is going up long-term. Massive growth.
Namaste.

XTZ Breakout Alert – Red Resistance Cleared!🚨 SEED_DONKEYDAN_MARKET_CAP:XTZ Breakout Alert – Red Resistance Cleared! 🔴✅
SEED_DONKEYDAN_MARKET_CAP:XTZ has broken out of the red resistance zone.
📊 Breakout signals bullish momentum — next move could target the green line level.

Xtz historic supportXTZ is at a historic support level here where it has consistently respected as support or resistance after recently busting over it and on higher volume seen in a long time. I’m optimistic.
Most tied up in staking it seems ~77%, so moves could happen quickly, as seen previously.

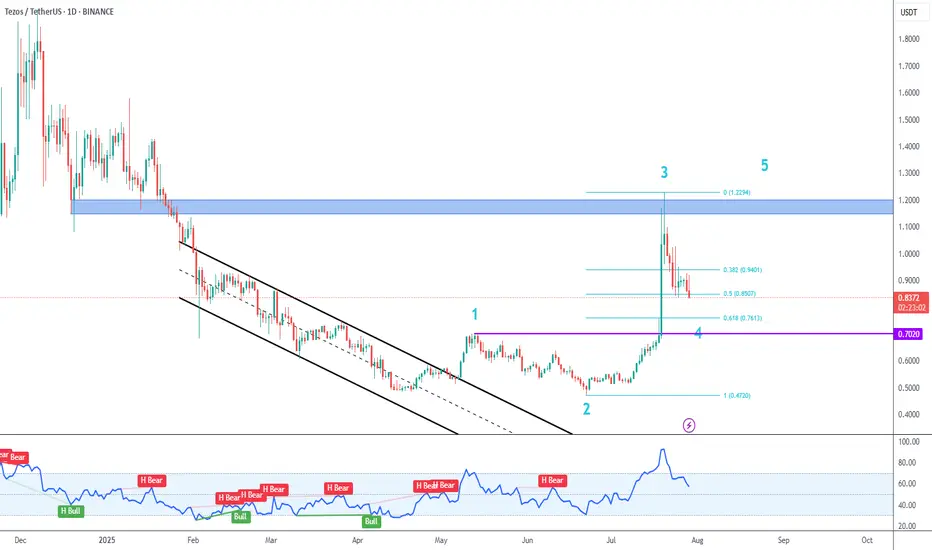
XTZ Motive Wave
After breaking the black descending channel price made waves 1/2 and pumped to the upside for wave 3, where it was held by the blue resistance zone.
We are now in wave 4 correction, and I am waiting for reversals in smaller timeframes for long trades.
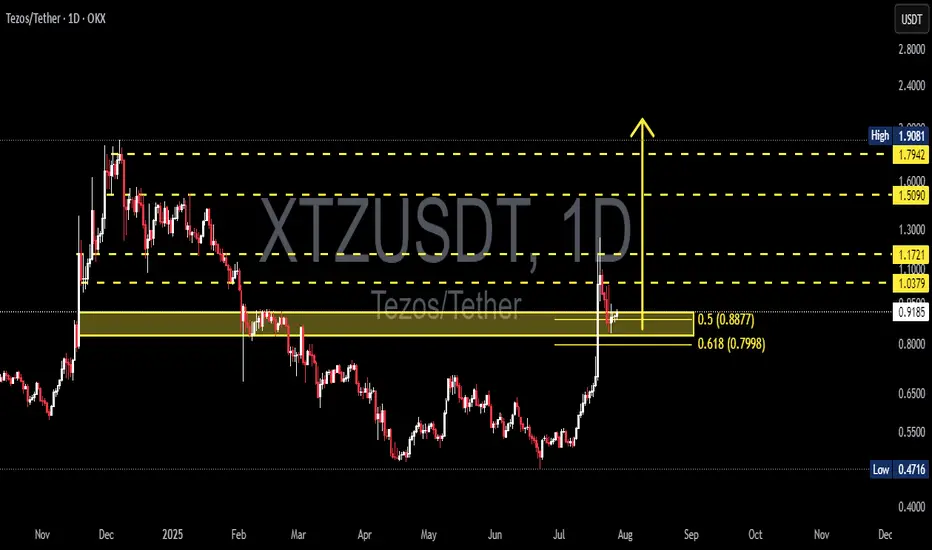
XTZUSDT Fibonacci Retest and Rebound Potential: Is Tezos Ready?Detailed Analysis of XTZ/USDT Chart (Daily Timeframe):
The XTZUSDT pair (Tezos vs USDT) has shown strong momentum following a breakout above previous support zones, with a sharp rally toward $1.17 before retracing.
Currently, the price is testing the Fibonacci Retracement levels, specifically the 0.5 ($0.8877) and 0.618 ($0.7998) zones — which also align with a key previous demand zone. This zone is critical for determining the next directional move.
---
🟢 Bullish Scenario:
If the price holds above the $0.80–$0.88 zone (Fibonacci support area), this could confirm a valid breakout retest.
Potential upside targets include:
$1.0379 (minor resistance)
$1.1721 (recent local high)
Further targets: $1.5090 – $1.7942, and potentially the major high at $1.9081.
This structure may form a bullish continuation pattern, especially if supported by volume.
---
🔴 Bearish Scenario:
A breakdown below $0.7998 may trigger further selling pressure toward $0.70 – $0.65.
A deeper retracement could take price back into the previous accumulation zone between $0.55 – $0.50.
Failure to hold the Fibonacci levels may confirm a bull trap, invalidating the recent breakout.
---
📌 Pattern Insights:
The current price action resembles a Bullish Flag / Retest Structure.
The 0.5–0.618 Fibonacci levels serve as a key confluence area for potential trend continuation.
This is a common setup before a major upside move — if the support holds.
---
Conclusion: XTZ is at a decisive moment. As long as the price stays above $0.80, the bullish trend remains intact. However, a drop below could shift momentum back to the bears. Traders should watch this zone closely for confirmation.
#XTZUSDT #Tezos #CryptoAnalysis #AltcoinSeason #FibonacciRetracement #BreakoutRetest #TechnicalAnalysis #CryptoTrading #BullishScenario #BearishScenario