EURGBP H4 | Potential bullish breakoutEUR/GBP is trading close to a pullback support and could potentially break above a descending trendline to make a bullish rise to the upside.
Buy entry is at 0.85700 which is a potential bullish breakout level (wait for price to break through the descending trendline for confirmation).
Stop loss is at 0.85350 which is a level that sits under a pullback support.
Take profit is at 0.86150 which is a pullback resistance that aligns close to the 38.2% Fibonacci retracement level.
High Risk Investment Warning
Trading Forex/CFDs on margin carries a high level of risk and may not be suitable for all investors. Leverage can work against you.
Stratos Markets Limited (www.fxcm.com):
CFDs are complex instruments and come with a high risk of losing money rapidly due to leverage. 66% of retail investor accounts lose money when trading CFDs with this provider. You should consider whether you understand how CFDs work and whether you can afford to take the high risk of losing your money.
Stratos Europe Ltd, previously FXCM EU Ltd (www.fxcm.com):
CFDs are complex instruments and come with a high risk of losing money rapidly due to leverage. 70% of retail investor accounts lose money when trading CFDs with this provider. You should consider whether you understand how CFDs work and whether you can afford to take the high risk of losing your money.
Stratos Trading Pty. Limited (www.fxcm.com):
Trading FX/CFDs carries significant risks. FXCM AU (AFSL 309763), please read the Financial Services Guide, Product Disclosure Statement, Target Market Determination and Terms of Business at www.fxcm.com
Stratos Global LLC (www.fxcm.com):
Losses can exceed deposits.
Please be advised that the information presented on TradingView is provided to FXCM (‘Company’, ‘we’) by a third-party provider (‘TFA Global Pte Ltd’). Please be reminded that you are solely responsible for the trading decisions on your account. There is a very high degree of risk involved in trading. Any information and/or content is intended entirely for research, educational and informational purposes only and does not constitute investment or consultation advice or investment strategy. The information is not tailored to the investment needs of any specific person and therefore does not involve a consideration of any of the investment objectives, financial situation or needs of any viewer that may receive it. Kindly also note that past performance is not a reliable indicator of future results. Actual results may differ materially from those anticipated in forward-looking or past performance statements. We assume no liability as to the accuracy or completeness of any of the information and/or content provided herein and the Company cannot be held responsible for any omission, mistake nor for any loss or damage including without limitation to any loss of profit which may arise from reliance on any information supplied by TFA Global Pte Ltd.
The speaker(s) is neither an employee, agent nor representative of FXCM and is therefore acting independently. The opinions given are their own, constitute general market commentary, and do not constitute the opinion or advice of FXCM or any form of personal or investment advice. FXCM neither endorses nor guarantees offerings of third-party speakers, nor is FXCM responsible for the content, veracity or opinions of third-party speakers, presenters or participants.
Community ideas

🅱️ Bitcoin Moving Below EMA50 Confirms Major CrashThis is not a drill... I repeat, this is not a drill!
Bitcoin is moving once more below EMA50 after a very weak bounce 16-January.
Moving daily below EMA50 simply confirms the upcoming correction without a shadow of doubt. This move is support by low volume and a weak RSI.
This signal only confirms when the day closes below $42,142 (EMA50).
While this is likely to happen today or fast, it can also take its time.
We are looking at the 20th of January, on or around this date (near) for the next major move to fully develop —based on Astrology (planetary movements).
Seeing these bearish signals, no doubt the next major move is down.
Prepare for a correction...
This is not a surprise we've been expecting this for months.
All related markets are also bearish.
The signals are coming from all across.
Prepare accordingly.
We still have some time left.
Thank you for reading.
Namaste.

Live stream - Morning Market ReviewJoin FXCM senior market specialist Russell Shor for a general review of the financial markets.

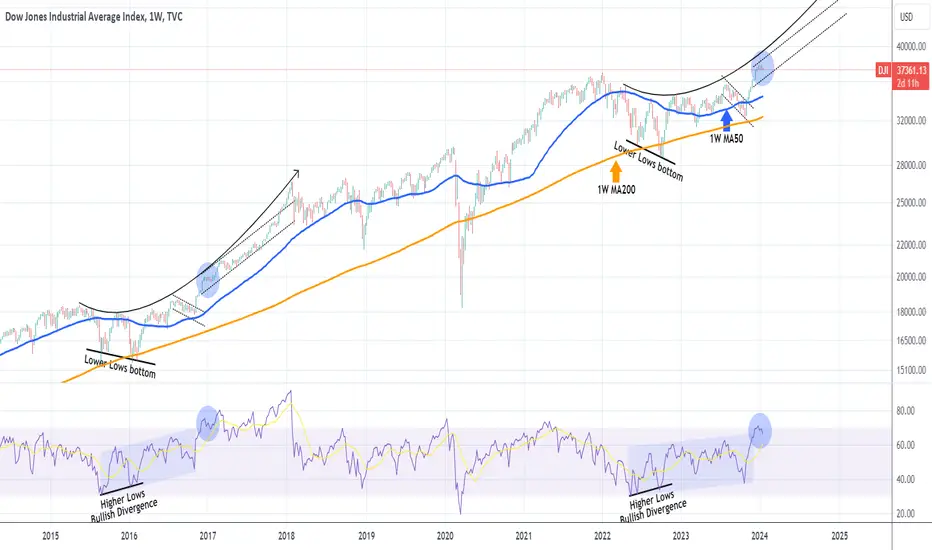
DOW JONES Why you don't want to miss this rally.Dow Jones (DJI) is pulling back on a technical correction as the 1W RSI got overbought (above the 70.00 mark) on the December 26 1W candle. That was basically the first time since June 01 2021 it got overbought and that time also gave a technical pull-back.
What draws our attention more than that time though is the December 19 2016 pull-back when the 1W RSI was again overbought. The difference here is that the price action and patterns that preceded that pull-back/ consolidation are very similar. A Lower Lows bottom on the 1W MA200 (orange trend-line) that took place on a 1W RSI Higher Lows Bullish Divergence, gave way to a break and sustainable rise above the 1W MA50 (blue trend-line). Following the current pull-back/ consolidation we are at, a very strong Channel Up took place.
As a result, even though the sentiment is bearish on the short-term, possibly until the January 31 Fed Meeting, it is clear that the long-term trend is bullish. Every such correction has high probabilities from now on to be a buy opportunity. The target can be as high as 43000 within 2024.
-------------------------------------------------------------------------------
** Please LIKE 👍, FOLLOW ✅, SHARE 🙌 and COMMENT ✍ if you enjoy this idea! Also share your ideas and charts in the comments section below! This is best way to keep it relevant, support us, keep the content here free and allow the idea to reach as many people as possible. **
-------------------------------------------------------------------------------
💸💸💸💸💸💸
👇 👇 👇 👇 👇 👇
USDCHF:The Confluence of Trends and FundamentalsHey Traders, in today's trading session we are monitoring USDCHF for a buying opportunity around 0.85300 zone, USDCHF is trading an uptrend and currently is in a correction phase in which it is approaching the trend at 0.85300 support and resistance area.
From a technical perspective, USDCHF exhibits a clear uptrend, and its current correction phase positions it near the critical support and resistance area at 0.85300. Traders will be closely monitoring this level for potential entry points.
Now, let's add a fundamental layer to our analysis. Recent economic indicators, especially the Consumer Price Index (CPI), play a pivotal role in shaping currency dynamics. Examining the previous CPI figures (3.1%, 3.2%, 3.7%) in contrast to the latest readings (3.4%, 3.1%, 3.2%), we observe a nuanced inflationary pattern. This trend suggests a potential strengthening of the US dollar, aligning with the Federal Reserve's dual mandate of price stability and maximum employment.
Considering the CPI data within the broader economic landscape, traders may anticipate increased speculation regarding the Federal Reserve's monetary policy. A growing inflationary environment could prompt the Fed to adopt a more hawkish stance, signaling potential interest rate adjustments in the future. This shift in monetary policy can significantly influence currency valuations, contributing to a possible strengthening of the USD against its counterparts.
In conclusion, as we navigate the intricacies of the forex market, keeping a watchful eye on both technical and fundamental factors is essential. The alignment of a favorable technical setup with evolving fundamental narratives enhances the overall decision-making process for traders.
Trade safe,
Joe.

Live stream - Morning Market ReviewJoin FXCM senior market specialist Russell Shor for a general review of the financial markets.

Bearish Bitcoin Spike on the Weekly"Buy the rumor/Sell the news" is a phenomenon as old as markets. It was like betting on the sun not to rise tomorrow.
I have talked to many Bitcoin enthusiasts who are perplexed by this occurrence. They were assured by various Twitter personalities that this week would see the largest inflow of capital into Bitcoin ever, price would rise, and if they just bought prior to the news they would make tremendous gains. This was never going to happen.
With the close of the prior eventful week's candle we now have a confirmed price Spike on the INDEX:BTCUSD Weekly. On Wednesday amid the "buy the news" nonsense price briefly surpassed a major high set in March 2022 only to retrace the entire ETF launch and then return to the bottom of the prior range. This is a very bearish signal from which price does not typically recover.
The first level of Support will be found around 32.2k; the 50% Retracement of the rally since November 2022. The most ironic, and most likely outcome, is that price retraces the entire ETF hype rally.
Breaking the ETF news high would of course resume the trend upward but at this point despite the memes circulating Twitter trying to reassure all to HODL that is a very low probability with the price action we have seen.
I remain short Bitcoin via pre-existing ETFs such as AMEX:BITI and will be adding to them during the coming week.
Wall Street is not coming to save your longs...

Is it time to buy China stocks? BABA? TME? PDD?Many Chinese stocks are quietly breaking out.
News headlines from other aspects of investing and world politics are drowning out these bullish setups.
Breakouts observed in some leading names.

Bitcoin: 40K Break Trend Change?Bitcoin rejects the 50K resistance area and goes from 49K to 41,500 over a two day period. If you have been following my analysis on here you should NOT be surprised. I have been highlighting the extreme risks above 46K in my articles AND my streams since the beginning of the month. Is this an adequate pullback to buy into? I will address that now.
The first question that we must consider is: has anything changed in terms of trend? From a technical perspective, NOT YET. The 40K support is still intact, and until this level is clearly compromised, it is still within reason to anticipate the overall support to hold. One thing to keep in mind though, there is a large red candle coming off a major resistance level and this means momentum is bearish. IF this momentum continues, 40K can break at which point a change in trend would be in play.
For this reason, BEFORE considering any swing trades on the long side, I will WAIT for a complex reversal pattern (see illustration on chart). This can appear in the form of a classic double bottom or failed low in the 40K AREA. A couple of green inside bars is NOT enough in this situation because of the recent surge in momentum. Typically inside bars in this configuration are often momentum continuation patterns which at the moment favors the bears.
In previous reports and streams I have specifically mentioned the relevance of the monthly time frame and potential of a bearish C wave developing. IF 40K breaks, this further confirms that argument. A bearish C wave can potentially lead to a test of 15K (this can take months to play out). It is important to be cognizant of this scenario particularly for investors who plan to dollar cost average into the next pullback. Don't make the mistake to getting too big too soon.
There is no way to know if 15K will be tested, maybe the bottom of C turns out to be 30K, or maybe Wave C never unfolds at all, and 40K holds. The point is, don't get married to any opinions bullish OR bearish. Avoid getting swept up into the nonsense machine (the internet). You only need a few components of information to make reasonable decisions. Start with having a repetitive way to identify trend and changes of trend, and second the same for KEY support and resistance levels. These two components alone can improve decision making because they help you align with market intent.
This game is NOT about "thinking" and being right. It is about ADJUSTING as the market processes new information. Unless you are ahead of the information curve, you have to accept that the market is ALWAYS right. It can do whatever IT wants, WHENEVER it wants for ANY REASON. Charts help to isolate a probable range of scenarios which you can reference to better quantify risk. The more you over think it, the greater the chance that you lose.
Thank you for considering my analysis and perspective.

Live stream - The Week Ahead - Daily Pitch Int. with Darius AnucNikkei225, China50, ASX200, DJIA, S&P500, Nasdaq100, DAX40, FTSE100, DXY, Gold, Silver,WTI Oil,NatGas,Sugar,Bitcoin,BitcoinCash,Ethereum,Polkadot,AUDUSD,AUDJPY,NZDJPY, CHFJPY,USDJPY,USDCHF,USDCAD,GBPUSD,EURNZD,EURJPY,EURUSD.

BTC REJECTED AT GOLDEN POCKET, PRINTS UGLY CANDLENot the move that ETF bulls were looking for, but also not surprising with GBTC now unlocked and putting selling pressure on the market.
Technicals at the moment indicate that more downside is likely.
The weekly candle closed as a shooting star , a candle with a long wick up and red body. This is often the signal of a weakening or ending uptrend. This also happened to have a wick up into the golden pocket, between the 61.8% and 65% retracement levels, a key resistance on the chart.
I have no idea what will happen - nobody does. The chart indicates that bears are back in control for the moment.
We need to see more downside to confirm the bearish candle from last week, or else the shooting star is not that meaningful.
This week will be fun to watch.

Live stream - Livestream 1-12-2024: Why Bitcoin Did Not Go UpBitcoin was supposed to go UP on the ETF launch news... but it did the opposite! Why this was just another "sell the news" event.

$SPX500 2024 Guess for the Year $SPYHere are the actual #'s for you to see the 2024 Wall Street analysts forecasts on the chart. Once those are charted in the black rectangles at the year-end price targets, we can see where there are concentrations of estimates and where investors might pause and sell as the target has been reached for the year.
And then I added in the 9% and 10% green lines to indicate the common average annual compound return of the stock market (excludes dividends).
I could imagine there will be multiple rejections of the cluster where people want to "lighten up at the target" into the election in November. I plotted three pullbacks from the resistance area and then once the doubt is no longer hanging over the market, it can rally and the money chases into stocks.
Election years have often been sideways grind and this year seems like more of the same. The media headlines are negative and investors are scared of a recession and another banking crisis. Inflation is always a fear and the Fed has hiked 500 basis points and although their language has shifted from "higher for longer" over to "easing ahead possibly three rate cuts in 2024" to paraphrase Jerome Powell at the Fed.
The stock market is unchanged after two years and many investors are shell-shocked from the bear market in 2022 and trying to fend off the lure of T-Bills and money market funds with their juicy 4%-5% yields which are the highest they have been in years. Take a look at my interest rate "guess" from last year when rates were near peak to show you what I was thinking back then (hint: topping, down to sideways. See link below).
This is my annual fun 'guess' which has been something I have done for about the last 10 years and with some luck it has at least acknowledged the big factors in the market and even if I am dead wrong I took a shot at it and welcome questions and comments.
Cheers to a healthy 2024 for everyone.
Tim
Jan 11, 2024 10:00AM EST

Spot Bitcoin ETFs Surge – A Bullish Signal for Market Adoption?Welcome to a pivotal moment in the Bitcoin market! As we witness the launch of several spot Bitcoin ETFs, including giants like Fidelity's FBTC, Bitwise's BITB, and Franklin Templeton's EZBC, the landscape of cryptocurrency investing is evolving before our eyes.
First-day volumes paint a promising picture, with funds that 'Buy Bitcoin' directly, such as FBTC (Fidelity), BITB (Bitwise), and EZBC (Franklin Templeton), accounting for a significant 14.06% of the total volume. This direct investment approach is injecting fresh capital into the spot Bitcoin market, hinting at a bullish outlook for Bitcoin adoption and price movement.
Let's not overlook the powerhouses that follow Bitcoin's price through derivatives, such as the ProShares Bitcoin Strategy ETF (BITO) and Grayscale's GBTC, which command an impressive 85.94% of the total volume. While they may not directly purchase Bitcoin, their market presence can't be ignored, as they reflect growing investor interest and add to the overall Bitcoin market depth.
With the potential move to a T+1 settlement cycle, the market could see increased efficiency and a more immediate impact from ETF inflows. This could be particularly beneficial for ETFs purchasing Bitcoin, as it allows for quicker capital deployment, enhancing the responsiveness of the market to new investments.
But let's temper our optimism with a dose of reality. It's crucial to remember that not all ETFs are created equal – some provide direct exposure to Bitcoin's price movements, while others offer a more nuanced approach through futures and other financial instruments. The true impact of these funds will unfold with time, as we closely monitor their influence on market demand and price dynamics.
In essence, the influx of new Bitcoin ETFs could be a harbinger of increased adoption and integration of Bitcoin into the mainstream financial world. This is a bullish sign for those of us optimistic about the future of digital assets.
Stay tuned for more updates as we navigate this exciting phase of market growth. And remember, despite the complexities, the introduction of these ETFs is a step toward broader acceptance and a testament to Bitcoin's enduring allure.
So..still very Bullish news... still very Good news!
One Love,
The FXPROFESSOR 💙

XRP High probability Uptrend with 70% move with target: $1.042The analysis below outlines a bullish case, with a target price of $1.042, marking a potential 71.76% increase from the current level.
Ascending Channel Formation:
The XRPUSD has been trading within an ascending channel, exhibiting higher lows and higher highs, a classical indicator of a bullish trend. The lower boundary of the channel has consistently provided support, suggesting a strong buying interest.
Consolidation Zone:
Prior to the current price action, XRPUSD was consolidating, with the price oscillating between a well-defined range of support and resistance levels. The upper boundary of this range may act as a springboard for a breakout.
Z-Score Probability Indicator:
The Z-Score indicator has dipped into the red zone, which often precedes a reversal. Given the other bullish signals, this could indicate a potential buying opportunity.
Moving Averages:
XRPUSD is currently trading above its significant moving averages, which have started to trend upwards, suggesting a bullish market structure.

AMD - Approaching All Time HighsHello Traders, welcome to today's analysis of AMD.
--------
Explanation of my video analysis:
After the massive breakout in 2016 we saw a rally of more than 4.500% on AMD. This rally was perfectly followed by a correction of 70% in 2022. As mentioned in my analysis, I am now waiting for a retracement back to the previous structure and if we have enough bullish confirmation, I will then look for potential trading opportunities.
--------
I will only take a trade if all the rules of my strategy are satisfied.
Let me know in the comment section below if you have any questions.
Keep your long term vision.

Breakout Alert: Nvidia (NVDA)Revolutionary AI-Optimised Graphics Propel Nvidia's Breakout
After months of sideways consolidation, Nvidia’s share price broke and closed decisively above resistance during yesterday's session – potentially reigniting the stocks powerful long-term uptrend.
Nvidia, a key player in the AI revolution, had an exceptional 2023, with its stock value more than tripling. However, the majority of these gains occurred in the first half of the year. Since summer, Nvidia's stock has been consolidating within a sideways range, as indicated in the chart below.
These prolonged consolidation phases within an established trend are not just typical but also beneficial. They facilitate stock rotation, involving accumulation and distribution, which helps prevent the trend from becoming overly stretched.
The breakthrough to new trend highs occurred following Nvidia's announcement of groundbreaking desktop graphics processors tailored for AI purposes—the GeForce RTX 40 SUPER Series. This unveiling triggered a substantial 6.4% surge, propelling the stock to close at record highs. Additionally, ahead of the Consumer Electronics Show in Las Vegas, the company introduced other AI-related components and software.
Nvidia (NVDA) Daily Candle Chart
Past performance is not a reliable indicator of future results
A Closer Look
If we take a closer look at yesterday’s breakout, there are several technical factors which indicate that the breakout has potential to continue:
Backed By Volume: On the hourly candle chart (below) we can see that the breakout was backed by an increase in volume – signalling increased participation. Volume acts as a validation mechanism for breakouts. It provides confidence to traders that the breakout has a stronger chance of being a genuine shift in market sentiment, rather than a temporary blip.
Higher Swing Lows: From November to December, Nvidia’s share price had been carving out a series of higher swing lows as the market repeatedly tested resistance. This signals that institutional ‘smart money’ traders were accumulating shares prior to the breakout.
Strong Close: Yesterday’s price action saw the shares maintain the breakout into the closing bell. This signals strong demand and reduces the probability that the breakout will fail.
Nvidia (NVDA) Hourly Candle Chart
Past performance is not a reliable indicator of future results
Disclaimer: This is for information and learning purposes only. The information provided does not constitute investment advice nor take into account the individual financial circumstances or objectives of any investor. Any information that may be provided relating to past performance is not a reliable indicator of future results or performance. Social media channels are not relevant for UK residents.
Spread bets and CFDs are complex instruments and come with a high risk of losing money rapidly due to leverage. 75% of retail investor accounts lose money when trading spread bets and CFDs with this provider. You should consider whether you understand how spread bets and CFDs work and whether you can afford to take the high risk of losing your money.

Bitcoin's Final Make Or Break MomentThis is my first post in some time. As I stated before, I'm largely moving on from crypto. I'm still here, paying attention to the market. I've also created a site for my fiction writing. Eventually, I may migrate some of these posts over there as representations of my non-fiction speculative market analysis.
Anyway, on to the important stuff.
Bitcoin did not succeed as a currency. Active addresses have still not seen any meaningful increase since 2017. The rate of growth for authentic currency adoption has slowed down along with price growth and expensiveness. studio.glassnode.com
There are only about 1 million active addresses. Nevertheless, price continues to be resilient. Perhaps this is due to its limited supply and its pivot in narrative to a "store of value." Indeed, it has been a pretty lucrative store of value, though more volatile than the stock market and other commodities. This doesn't necessarily make it a "good" store of value.
Regardless of what I think, the market will make its decision. Now is the time for that to happen. With ETFs supposedly on the horizon, we will get to see how much demand really exists for Bitcoin.
I'm going to take this moment to speculate a bit. If it continues to go up, my guess is it will be because of the ETF hype, but volume amongst most spot exchanges will remain low. Bitcoin dominance would likely rise to levels not seen since 2019. If it results in a bubble, eventually people will come to their senses and there will be a pop. It will attract a lot of media and government attention, not all of it positive.
If it drops from here, it will be like all the other times people had high hopes for Bitcoin. It will be like all the times Bitcoin was supposed to represent economic freedom. It will be like every single time Bitcoin made major news, only for everyone to talk about it just as it was about to crash. It will not come as any surprise.
If the ETFs fail to sustain the market to new highs, then I think there is little other chance for this asset, at least in the near future, until some other narrative takes hold. The thing exists, and as long as it does, people will ascribe their hopes, dreams, and (in my case) disdain towards it.
What would be a departure would be continued price appreciation and adoption. But, with a finite supply, there is of course a limit to how much people can buy. Then, what happens to it?
We shouldn't forget the other side of this market (apart from the ETF hype and the coin accumulation that requires). Binance is still a thing. BNB is still a juggernaut. Tron is still a thing, and so is the big stablecoin cartel which likely revolves around both.
But I'll spare you all my other thoughts on this subject. I just wanted to post a chart update, to show that I'm at least paying attention.
As for technicals, my chart shows two options. If it continues to hold in this broadening wedge pattern, the next target could be $90k, or roughly 2x from here, surpassing the previous all time high. As much as my previous analysis will be wrong if that happens, it's a possibility. The other scenario shows what could happen on a breakdown, back below the broadening pattern.
Here's the BLX chart, showing that Bitcoin has so far been rejected at a former long term trendline. This chart shows some more possibilities.
Let's see if it can break back above.
Zoomed out:
Either way, prepare for volatility!
As always, thank you so much for reading. This is not financial advice, but meant for speculation and entertainment only.
-Victor Cobra

SEIUSD Hindsight AnalysisJust looking back at SEI-USD on COINBASE and figured I'd put my thoughts out there. By no means am I a professional--just trying to learn a few things along the way. Peep the chart and let me know your thoughts. I'm always looking for ways to improve my trading!

OMUSDT Potential Breakout Structure📊 BINANCE:OMUSDT is currently nestled in the tight base of a Falling Wedge pattern. Keep a close eye on the support level around 0.017, as a critical price to break sits at 0.024. Key resistances and upcoming targets are at:
🎯 Targets:
Target 1: 0.036
Target 2: 0.057
Target 3: 0.084
Target 4: 0.123
Regardless of the market situation, remember to use appropriate stop loss. A prudent approach is to set the stop loss below the support zone, with a weekly candle closing around 0.016 as a viable option.
Stay vigilant and keep an eye on the charts! 🚀

USDCAD Trading Strategy: Technical and Order Flow Analysis ! Hello Traders, here is the full analysis for this pair, let me know in the comment section below if you have any questions, the entry will be taken only if all rules of the strategies will be satisfied. I suggest you keep this pair on your watchlist and see if the rules of your strategy are satisfied. Please also refer to the Important Risk Notice linked below.

Eli Lilly Challenges Falling TrendlineEli Lilly spent the fourth quarter consolidating gains, and now trend followers may expect further upside.
The first pattern on today’s chart is the falling trendline along the peaks of November and December. Prices tried to fight above that resistance yesterday, creating potential for a breakout.
The pharma giant also pushed above its 50-day simple moving average (SMA). Both of those events may suggest that the intermediate-term trend is getting more bullish.
Next, LLY jumped on November 2 following strong quarterly results and bottomed around $567 the next session. It tested that post-earnings low last month and repeatedly closed above it. Is new support in place?
Finally, MACD just turned positive.
TradeStation has, for decades, advanced the trading industry, providing access to stocks, options, futures and cryptocurrencies. See our Overview for more.
Important Information
Past performance, whether actual or indicated by historical tests of strategies, is no guarantee of future performance or success. There is a possibility that you may sustain a loss equal to or greater than your entire investment regardless of which asset class you trade (equities, options, futures or cryptocurrencies); therefore, you should not invest or risk money that you cannot afford to lose. Online trading is not suitable for all investors. View the document titled Characteristics and Risks of Standardized Options at www.TradeStation.com . Before trading any asset class, customers must read the relevant risk disclosure statements on www.TradeStation.com . System access and trade placement and execution may be delayed or fail due to market volatility and volume, quote delays, system and software errors, Internet traffic, outages and other factors.
Securities and futures trading is offered to self-directed customers by TradeStation Securities, Inc., a broker-dealer registered with the Securities and Exchange Commission (“SEC”) and a futures commission merchant licensed with the Commodity Futures Trading Commission (“CFTC”). TradeStation Securities is a member of the Financial Industry Regulatory Authority, the National Futures Association (“NFA”), and a number of exchanges. TradeStation Crypto, Inc. offers to self-directed investors and traders cryptocurrency brokerage services under federal and state money services business/money-transmitter and similar registrations and licenses.
TradeStation Securities, Inc., TradeStation Crypto, Inc., and TradeStation Technologies, Inc. are each wholly owned subsidiaries of TradeStation Group, Inc., all operating, and providing products and services, under the TradeStation brand and trademark. TradeStation Crypto, Inc. offers to self-directed investors and traders cryptocurrency brokerage services. It is neither licensed with the SEC or the CFTC nor is it a member of NFA. When applying for, or purchasing, accounts, subscriptions, products and services, it is important that you know which company you will be dealing with. Visit www.TradeStation.com for further important information explaining what this means.

Bitcoin kicks off the New Year on a bullish noteAfter a series of bearish breakouts from the pattern resembling a triangle on the hourly chart, Bitcoin kicked off the new year on a bullish note and skyrocketed through its upper bound. By doing so, it established a new high at $45,532. Yet, despite this being a bullish development, a few things continue to ring an alarm bell for us. Last week, we noted that Bitcoin addresses with balances exceeding 100 BTC and 1,000 BTC increased in number following the dip in price. However, we have seen the opposite happening since 29th December 2023, with big players seemingly unloading their holdings into Bitcoin’s strength. While this occurrence does not necessarily warrant Bitcoin’s top, it is something to monitor in the foreseeable future. Another thing to watch out for would be an invalidation of a breakout above $44,729 and technicals on the daily chart. In the past two weeks, we have seen RSI retreat from the overbought territory and MACD reverse to the downside. Then, in the past three trading sessions, we have seen them attempting to reverse to the upside. If MACD follows through and RSI breaks above 70 points, it will bolster a bullish case. In such a scenario, we expect Bitcoin to test an important resistance near $48,000. Contrarily, the failure of the mentioned technicals to continue gaining strength will raise our concerns. All in all, our stance remains unchanged, and we will update our thoughts on the asset with the emergence of new developments.
Illustration 1.01
The picture shows the hourly chart of Bitcoin and the pattern resembling an ascending triangle. Yellow arrows indicate essential developments.
Illustration 1.02
Illustration 1.02 displays the daily graph of Bitcoin and simple support/resistance levels.
Technical analysis gauge
Daily time frame = Neutral (no trend/weak trend)
Weekly time frame = Bullish
*The gauge does not necessarily indicate where the market will head. Instead, it reflects the constellation of RSI, MACD, Stochastic, DM+-, ADX, and moving averages.
Please feel free to express your ideas and thoughts in the comment section.
DISCLAIMER: This analysis is not intended to encourage any buying or selling of any particular securities. Furthermore, it should not serve as a basis for taking any trade action by an individual investor or any other entity. Your own due diligence is highly advised before entering a trade.
